Irene Garcia Martí
A
DDING
SOS
C
ORE
&
T
RANSACTIONAL
P
ROFILES
S
UPPORT TO A
W
EB
T
HIN
C
LIENT
Dissertation supervised by: PhD Joaquín Huerta Guijarro PhD Óscar Belmonte Fernández
PhD Pedro Cabral
A
CKNOWLEDGMENTS
I would like to thank Professors Óscar Belmonte and Pedro Cabral for their support and accepting the responsibility of reviewing and commenting this document; to researchers Laura Díaz, José Antonio Gil and Alain Tamayo because their general expertise working with programming, OGC standards and gvSIG was very useful to solve punctual problems along the development of this project; to my Erasmus Mundus friends to make this experience such a valuable and pleasant one.
A
DDING
SOS
C
ORE
&
T
RANSACTIONAL
P
ROFILES
S
UPPORT TO A
W
EB
T
HIN
C
LIENT
A
BSTRACT
K
EYWORDS
GIS web applications Google Web Toolkit Sensor Network
A
CRONYMS
AJAX – Asynchronous Javascript and XML CSW – Catalogue Service for the Web GAE – Google App Engine
GIS – Geographic Information Science/System GWT – Google Web Toolkit
IDE – Integrated Development Environment O&M – Observation and Measurement RPC – Remote Procedure Call
SOAP – Simple Object Access Protocol SOS – Sensor Observation Service SWE – Sensor Web Enablement UML – Unified Model Language WFS – Web Feature Service WMS – Web Map Service
I
NDEX
C
HAPTER1
-
I
NTRODUCTION... 1
C
HAPTER2
–
S
TATE OF THEA
RT... 5
2.1 – Sensor Network and Sensor Web ... 5
2.2 – Sensor Web Enablement ... 6
2.3 – Sensor Observation Service ... 8
2.3.1 – Core Profile ... 9
2.3.2 – Enhanced profile... 10
2.3.3 – Transactional profile ... 11
2.4 – Sensor Web and SWE applications ... 12
2.4.1 – Sensor Web applications ... 13
2.4.2 – SWE applications ... 16
2.5 – Summary ... 18
C
HAPTER3
–
T
ECHNOLOGIESU
SED... 19
3.1 – Google Web Toolkit ... 19
3.2 – ExtSOS external library ... 22
3.3 – LibRemoteServices external library... 24
3.4 – Thin client concept ... 24
3.5 – AJAX ... 25
3.6 – Summary ... 25
C
HAPTER4
-
A
NALYSIS... 26
4.1 – Requirements ... 26
4.2 – Use Case Diagram ... 27
4.3 – High level architecture ... 29
C
HAPTER5
–
D
ESIGN ANDI
MPLEMENTATION... 33
5.1 – Application structure and behaviour ... 33
5.1.1 – Application structure ... 33
5.1.2 – Application behaviour ... 35
5.2 – Designing thin client user interface ... 37
5.3 – Communicating with the server ... 39
5.3.1 – Getting client-side package parameters ... 39
5.3.2 – Send operation XML request to the server ... 40
5.4 – Parse results ... 41
5.5 – Display retrieved data on the map ... 43
5.6 - Summary ... 45
C
HAPTER6
-
F
UTUREW
ORK ANDC
ONCLUSIONS... 46
I
NDEX OF FIGURES
Figure 1: Depiction of Sensor Web Enablement family ... 8
Figure 2: Detail of the operations defined in the SOS standard document ... 9
Figure 3: Primary structure of a GWT-based project ... 20
Figure 4: RPC mechanism diagram ... 21
Figure 5: UML use-case diagram for the project ... 29
Figure 6: High-level architecture diagram ... 30
Figure 7: Package diagram for this project ... 32
Figure 8: Class diagram for SOSProject... 35
Figure 9: General sequence diagram for this project ... 36
Figure 10: Detail sequence diagram for the RPC mechanism ... 37
Figure 11: Detail sequence diagram for parse operation ... 38
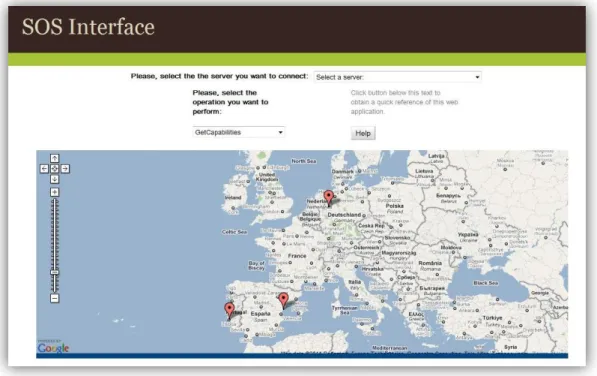
Figure 12: General appearance of the application when it is executed in the web browser ... 40
Figure 13: Overlapping windows for Transactional Profile operations ... 41
Figure 14: XML response file needed to parse for Get Observation operation... 44
C
HAPTER
1
I
NTRODUCTION
Open Geospatial Consortium (OGC) has developed in the last years a set of standards that try to standardize the distribution and spreading of geographic information on a network, allowing interoperability between systems, transparency and near real time data publishing.
Since the development of these standards many public and private entities have adopted this kind of models to build up geospatial-data servers or develop new software or software extensions that fit new requirements and needs. For example, widely known company ESRI has developed several plug-ins to connect ArcGIS desktop software to different OGC service providers and locally work with remote data; the Spanish open-source alternative gvSIG has followed a similar path, providing extensions to connect and work with the same services; finally, on the side of server software providers it is important to mention the work of German company 52º North that provides as well open-source server applications that can be downloaded, installed or modified to fit a company requirements.
In this context, it turns out necessary to develop a new generation of web browser thin clients that connect to a remote geospatial server and request some data following a criterion independently of any software, just using our favourite web browser. At present, there exist many public applications connecting OGC services in general and display the data they contain, but mainly those applications connect to Web Map Service (WMS) servers that allow the general public to check the available data about a parcel, province or area. In the case of SOS services, there exist some public ones providing data from sensors, but in most of the cases just the Core profile operations are available and XML data retrieved from the sever is not presented on a map layout for a better comprehension..
Another key concept on this project development is sensor networking. By definition, a sensor network is a net of almost autonomous sensors that monitor physical or environment conditions such as air pollution, seismic activity, water gauge level on a river or sound waves near a highway. A sensor network is a broad concept used in many fields such as industry or security. Starting from that concept, OGC created a particular family of standards focused on the distribution of geospatial information in a network and called this set of specifications Sensor Web Enablement (SWE). This family is composed of seven different standards that will be explained briefly on the following pages of this document, but it is important to mention one of the most important in the family: Sensor Observation Service (SOS). This standard provides a set of functions divided in three different profiles (Core, Enhanced, Transactional) for managing deployed sensors and retrieving sensor data and observation data directly from the sensors available on the sensor network.
Maps map. It is important to note that the operations of Transactional profile are not supported by most of the web clients found on the net, although they are important to enlarge and enrich the sensor network by adding it new raw data or monitoring devices.
The aim of this project is developing an improved web thin client that provides to the user Core and Transactional operations described in SOS specification document in a friendly GWT interface and with the possibility of downloading the data associated to each observation requested to the server.
As a basis to develop this new thin client, it is going to be used two gvSIG-related libraries: The first one was developed in 2009 as a Thesis of this same master program by researcher A. Tamayo. It is an extension to the basic functionality of gvSIG software and makes it capable to connect and manage SOS Core Profile requests and responses. The second one is part of the gvSIG kernel and it is the library that manages the real connection with remote servers, in this case, a SOS one.
In 2010, as an end-of-degree project, students M. Benedito and I. Garcia extended the functionality of (Tamayo, 2009) to include the necessary source code to make that extension also accept Enhanced & Transactional Profile operations. Therefore, this new project uses as a basis this modified version to start working, not the original one.
open-source and web-oriented framework that allows the possibility of working without needing a determined software.
C
HAPTER
2
S
TATE OF THE ART
In this chapter it is presented a general introduction to Sensor Networks in order to provide a general overview to the topic. First it is possible to find a summary about what Sensor Network, Sensor Web Enablement and Sensor Observation Service are. Then some real applications of sensor networks are described. Finally it is explained how this project may fit other ongoing projects carried out by the Institute of New Imaging Technologies (INIT) at Universitat Jaume I.
2.1
–
Sensor Network and Sensor Web
A sensor network is a computer accessible network of spatially distributed devices that monitor a particular set of conditions in different locations like temperature, water gauge level, light or air pollution among many other options. A sensor web provides similar information than the previous type, but in this case it will be accessible through a computer or a computer-like device using standard protocols and APIs. (Botts et al. 2008)
user, but with a correct data presentation (for example, using maps) it is possible to depict and explain easily complex phenomena.
One of the most interesting features this kind of infrastructure provides is the possibility of analyzing a phenomenon in near real-time, because it is possible to program sensors to take a sample of the monitored condition and send it to the central repository. (Botts et al. 2008)
2.2
–
Sensor Web Enablement
Sensor Web Enablement (SWE) is an Open Geospatial Consortium (OGC) initiative to build a framework using open standards to make accessible the data that web-sensors periodically produce and exploit them almost in real-time as a user considers. It is a particularization of Sensor Web created by OGC in 2006.
OGC is establishing the interfaces and protocols that will enable Sensor Webs through which applications and services will be able to access sensors of all types over local networks or the Internet and with the same standard technologies and protocols that enable the web, such as HTTP. These specifications are completely defined in seven basic components needed for a Sensor Web, namely (OGC, 2007a):
Observations & Measurements (O&M): Defines the general models and XML encoding documents for sensor observations and measurements.
Sensor Model Language (SensorML): Defines general models and XML schema for describing sensors and processes associated with measurement.
Sensor Planning Service (SPS): Provides a standard interface to collection assets and support systems around them. This service can support different kinds of assets with differing capabilities and request processing system and it is useful for planning, scheduling, tasking, collection, processing and distribution of request and the resulting observed data from the requests. Therefore, this is a service to configure sensor platforms on a Sensor Web. (OGC, 2007c)
Transducer Markup Language (TML): This service defines general characterizations of transducers (receivers and transmitters) regarding data, how it is generated, what phenomenon is being measured and necessary metadata for a later processing and understanding of the transducer data.
Web Notification Service (WNS): Defines how a client may conduct asynchronous dialogues with one or more other services. It is useful when many collaboratin services are required to satisfy a client request and when significant delays are involved.
In the following figure it is depicted the whole SWE family:
Figure 1: Depiction of Sensor Web Enablement family. The highlighted one is the principal used on this project.
2.3
–
Sensor Observation Service
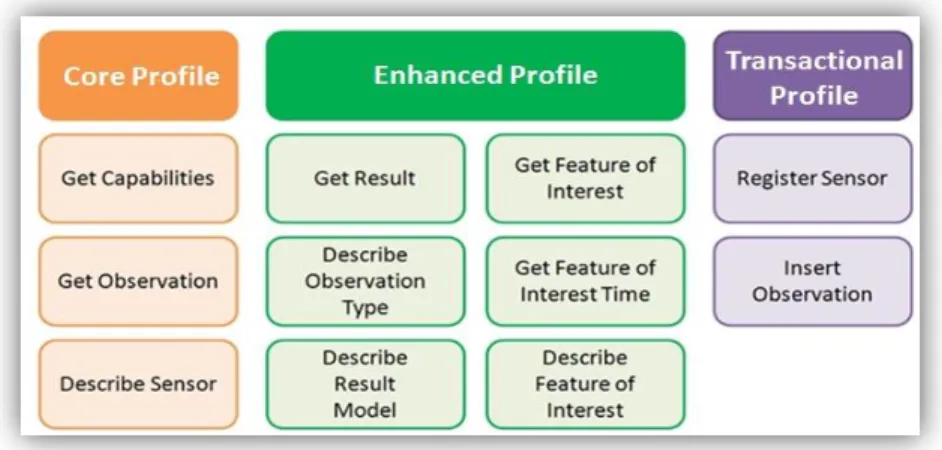
SOS is a standard intended and conceived for requesting, filtering and retrieving observations using web service and internet protocols. This protocol lies in between a client interface and a sensor data source that could be a standard spatial database or a near real-time sensor channel. (Botts, 2008). According to the standard definition document, SOS defines operations in three levels or profiles: Core, Enhanced and Transactional profiles. When a SOS system implements all three sub profiles it is said that implements the Entire Profile, a theoretical fourth one. In this image all profiles are presented specifying the operations for each one:
Figure 2: Detail of the operations defined in the SOS standard document.
It is important to note that not all functions return to the user georeferenced information: some of them just return a XML file with the information associated, but it is not possible to represent it in a map. For example, GetFeatureOfInterestTime returns a XML file with the date of the first observation and the date of the last one so, in that cases, just the text will be presented on the screen.
2.3.1
–
Core Profile
Here is the list of operations found in the specification document for the Basic or Core Profile: (OGC, 2007b):
GetCapabilities: Allows requesting to a remote SOS service the metadata document about a specific service instance. It provides a full description of what the remote server can provide to the client.
GetObservation: This operation is designed to query a service to obtain a specific observation data. The result to this operation will be a document in O&M format that will be necessary to parse to extract the data within.
2.3.2
–
Enhanced profile
Here is the list of operations found in the specification document for the Enhanced Profile:
GetObservationById: The functionality is to query a remote SOS service to retrieve a specific observation data that is defined manually bye the user. Response is formatted following O&M specification.
GetResult: The purpose of the GetResult operation is to allow a client to repeatedly obtain sensor data from the same set of sensors without having to send and receive requests and responses that largely contain the same data except for a new timestamp. The motivation for including the operation is to support a data center requesting data from a node that talks directly to sensors over a low bandwidth connection such as a 3G wireless link. The GetResult operation relies on the creation of an O&M template from a previous call to GetObservation. The identifier of the template is used for subsequent GetResult calls instead of sending a duplicate GetObservation XML document. The response contains only the result portion of the O&M Observation because the other components are included by reference in the template.
GetFeatureOfInterest: This operation returns a featureOfInterest that was advertised in one of the observation offerings of the SOS capabilities document.
DescribeFeatureType: This operation returns the XML schema for the specified GML feature found in GetCapabilities.
DescribeObservationType: Returns the XML schema that describes the observation type, returned for a particular phenomenon. This allows the SOS to list the set of Observation types that it can deliver. These are specialized observation types, in which one or other of the standard properties are specialised or restricted, or additional properties added.
DescribeResultModel: Returns the schema for the result element that will be returned when the client asks for the given result model by the given ResultName. The qualified name of the result element can be obtained from the schema that is returned by DescribeObservationType.
2.3.3
–
Transactional profile
Here is the list of operations found in the specification document for the Transactional Profile:
RegisterSensor: Allows the client to register a new sensor system with the SOS as part of the transactional profile. Sensor observations can only be inserted for sensors that have first been registered with the SOS. RegisterSensor is mandatory for the transactional profile.
obtained from the RegisterSensor operation. The observation must be encoded in XML following the O&M specification. InsertObservation is mandatory for the transactional profile.
2.4
–
Sensor Web and SWE applications
One of the main applications of sensor network is environmental modelling. A complex environmental phenomenon it is difficult to study or analyze as a whole, but using a sensor network can overcome this difficulty. The general application of a sensor web is deploying on an area where a phenomenon occurs, sensors measuring one or more environmental features and inserts the observed data on a database.
After having these data on a geospatial database, it is possible to exploit and process all them, make inferences and estimations or providing a good and detailed description or theory about the studied phenomenon. Talking about complex phenomena involves seismic activity, air quality modelling, tide gauge, oceans monitoring, movement of pollutants plume like Iceland volcano event on 2010, etc. Not all sensor web applications do use OGC standards; this section is just to illustrate what it is possible to do using them.
2.4.1
–
Sensor Web applications
a) Air Quality Monitoring
As population living in cities will increase until 70% around 2050 (UN, World urbanization prospects 2009), one of the collateral effects of this overpopulation is air contamination. Cities need huge amounts of resources to keep “living” and mostly they reach them using transportation by road, train or boat that use huge amount of fossil fuel. A similar problem happens on electricity production to supply electrical power to every house, in industrial activity or in daily people displacements to provide enough resources for everybody.
The major problem of this is contamination in cities and surrounding areas. It is well known the pernicious effects on air contamination on population health (Baldauf, 1999) and it is something necessary to control to prevent respiratory illnesses or acid rain.
It would be particularly interesting to deploy sensor networks in heavy industrialized areas or in the main road network of a country or city to check what type of pollutants and the concentration of each of them is present on air in order to take actions to prevent common health problems like allergies or asthma.
United Kingdom provides this kind of data in (UK Air Quality Archive, 2010) to the general public by using web services after monitoring some pollutants in all country by monitoring 1500 cities separately. Nevertheless they provide data in a tabular way, without maps, so it is difficult to see and compare how the pollution is in an area or even include those data in our system for a further or more detailed analysis. It is possible to find some generic data that work as a summary to view on Google Earth software.
b) Seismic Activity
Seismic activity due to friction between two or more tectonic plates or due to volcanic eruptions it is something difficult to predict with current methods and has disastrous consequences when an event like this happens on an area. The lack of data and the uncertainty of the data scientists have available, make difficult to predict when a dangerous seismic activity can take place.
In (Werner-Allen et al., 2006) it is described a method for monitoring volcanic eruptions in Ecuador by using sensor networks. Monitoring seismic activity is described in this document as taking continuously sensor samples about low-frequency signals on a terrain strip. Major drawbacks this process present is that sometimes, sensor stations have to lie in a difficult-to-access terrain, the equipment is expensive and heavy to transport and periodically it is necessary to come back to each of them for reparation or battery recharging purposes.
database obtaining a more than a hundred megabytes of data with few effort and resources.
c) Wildlife Habitat Monitoring
Wildlife is subjected to small climate variations that do not affect human being, but can cause major disasters among flora and fauna. Sensor networks can help environmental scientist (ecologist, biologists, etc.) community to monitor and control those microclimates variations on an area and try to avoid future problems.
In (Szewczyk et al., 2004) it is described the importance of this kind of networks to monitor burrow-nesting birds, insects or small mammals in its own habitat. Concretely, in this document it is explained how a non-standardized sensor network was deployed to study the bird-nesting in San Jacinto Mountains Reserve (California, U.S.A.). Among other things, in the document it is explained how the sensors were deployed, how did they communicate with the central server, how the network architecture looked liked or the data needed to be stored on a database.
2.4.2
–
SWE applications
a) OOSTethys
It is an open source software project that has as main purpose integrate all ocean observing systems by following OGC standards. This project intends to provide software tools and manuals in order to release web services for an interoperable ocean science; therefore, it is possible to access to their ocean sensor network and check a determined data from a concrete sensing platform. In general, this system provides the Core profile of SOS, but it is not possible to access to more specific operations like the ones on the Enhanced or Transactional profile.
Not all platforms do measure the same properties: As the data is provided by 60 different organizations, the data each platform serves is different. Some examples of what it is possible to find on this services is data related with wind speed, air temperature, water temperature, salinity, georeference or water level.
b) GeoCENS
Geospatial Cyberinfrastructure for Environmental Sensing (GeoCENS) is a geoportal with a specific OGC SWE architecture as the fundamental interoperability between systems architecture. It allows the enablement of exchanging and processing sensor observations and other relevant geospatial data, since it is a sensor web platform (Liang et al. 2009).
GeoCENS allows several interesting features like a virtual globe system browsing, collaborative geotagging, OGC web services or parallel processing to pre-process raw sensor readings. At present, GeoCENS is one of the only two servers that have passed the OGC SOS compliance test along with the one developed by 52ºNorth.
c) Sensors ANYwhere
SANY (Havlik et al., 2006) is a project driven by the SANY Consortium, an aggregation of several European partners associated with OGC. SANY is focused on the interoperability of in-situ sensors and sensor networks. One of its main goals is assuring that collected sensor data can be easily processed and later used as a basis for decision making. In order to achieve this goal, SANY relies on the Sensor Service Architecture (SensorSA) defined in (OGC, 2009). This OGC-verified specification, belonging to Service-Oriented Architectures (SOA), defines a fundamental architectural framework for the design of sensor-based environmental applications.
acces to third-party sensor networks. It also provides web-based services that make possible remote data processing.
Some applications where this project can be useful are within the domain of risk assessment such as air pollution, marine fauna or urban hazards, because it provides predictive modelling services to prevent them.
2.5
–
Summary
C
HAPTER
3
T
ECHNOLOGIES USED
In this chapter will be presented the additional technologies used along the development of this project in terms of external software necessary to run and properly deploy the application.
3.1
–
Google Web Toolkit
On 2006 Google released a primary version of a toolkit specially conceived to create and maintain complex JavaScript applications that were natively programmed in Java. Since then, that toolkit called Google Web Toolkit (GWT) has been refined and expanded through 15 versions until it has converted in one of the more widely known toolkits to easily develop web applications. In essence, GWT is a Java-to-Javascript automatic compiler, but it is necessary to strictly use native GWT classes to make this conversion successful.
GWT is a development toolkit for building and optimizing browser-based applications. This toolkit provides a set of Java-based libraries that abstract most of the functionality of the web design and the client/server communications, making the programming and deployment of web applications easy to build-up and to maintain.
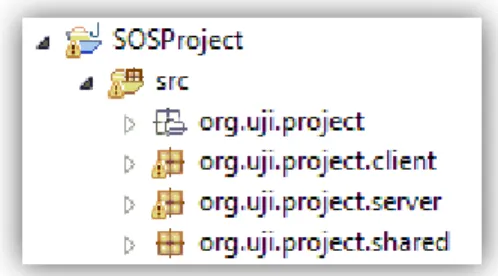
JavaScript; therefore, files located in this project sub folder have to be written in pure GWT classes. On the other side, server package can contain non native GWT classes.
It is important to highlight that GWT project definition does not allow to use non native GWT classes or third-party source code on the client-side package due to a very simple reason: this code is not directly translatable from Java to JavaScript and each attempt to do this on the client-side package will raise an error.
Figure 3: Primary structure of a GWT-based project.
Translatable code goes under the “client” package one and non-translatable to the “server” package.
At some point, most GWT applications running on the client-side package will need to interact with a back-end server-side package. GWT RPC is a HTTP communication mechanism between both packages.
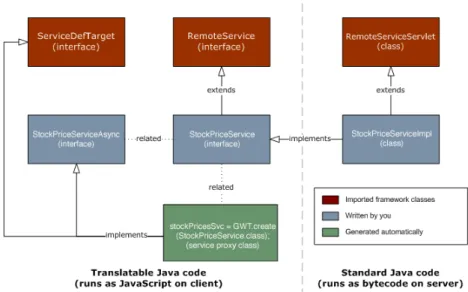
Figure 4 provides an example of RPC mechanism:
Figure 4: RPC mechanism diagram. Source: Google
To illustrate the previous diagram with an example, consider that it exist a class called “SampleClass”, the RPC structure that would be constructed between both packages would be made of three different files:
SampleClassService: This class lies on the client package, extends GWT RemoteService interface and contains a call to the server-side class.
SampleClassServiceAsync: This one also lies on the client package and creates a callback object that will execute when the call to the RPC is finished.
Finally, it exists a key piece on this package structure: a file with extension .gwt.xml that is responsible of make the project run. This file is located in an outer level than client and server sub packages (in org.uji.project) and just contains files like that. In this file it is necessary to specify fields like the Entry Point class or the modules that are going to be used in this project, like Google Maps, the style of the page, packages where translatable code can be found, etc. Without these specifications, Eclipse compiler does not know what libraries look to compile the code and raises many errors.
3.2
–
ExtSOS external library
ExtSOS (also called gvSOS) is a library created by researcher A.Tamayo during 2008 and was inititally conceived to be an extension for GIS desktop software gvSIG. This extension allows increasing original program functionality adding a new and independent module that makes possible the connection and communication to SOS service provides.
In an origin, the module gives support to Core Profile operations but in a later expansion of his Master Thesis Project, student M. Benedito and I enlarged it as an end-of-degree project in 2010, where Enhanced & Transactional Profile operations were added to his extension (Benedito & Garcia, 2010). Nevertheless, these operations are not included in gvSIG despite I have started my project based on the modified code.
functional, process data retrieved from server, make graphics or maps with the data coming from the server.
Due to the main features of this project, that do not need a window environment but a browser-based one, I have used the minimum necessary set of sub packages from ExtSOS to ensure that creation, reception and parsing of XML requests and responses are working properly and without having unused code.
This is the list of packages that I am going to use along this project development:
org.gvsig.remoteClient.ows.capabilities org.gvsig.remoteClient.sos org.gvsig.remoteClient.sos.exceptions org.gvsig.remoteClient.sos.filters org.gvsig.remoteClient.sos.requests org.gvsig.remoteClient.sos.sos_1_0_0 org.gvsig.remoteClient.sos.sos_1_0_0.requests org.gvsig.remoteClient.sos.sosutils
The other packages on the extension are not necessary because they are useful for other purposes like use gvSIG kernel, window displaying etc.
server necessary data, establishing a XML format dialogue between desktop application and remote server.
3.3
–
LibRemoteServices external library
LibRemoteServices is a gvSIG core library created in 2004 that has as primary function to establish successfully a communication channel with a generic remote server using HTTP requests. It takes care of the low-level details on a communication channel.
This library also provides distributed web services which interface implements OGC standards specifications. Actually, it is implementing the client-side communications for standards WMS 1.0.0, WMS 1.1.1, WMS 1.3.0, WFS 1.0.0, SOS, CSW, etc. In general, the underlying philosophy of this library is making a clear separation between the gvSIG communication part and gvSIG graphical interface, allowing a high scalability of the model.
ExtSOS library described in the previous section makes use of this library to contact with the SOS server, so it is absolutely necessary to include it in this project.
3.4
–
Thin client concept
In this case the client is in charge of retrieving the input parameters the user has specified, create a SOS request using ExtSOS plug-in, wait for the server response and then, start processing the parameters. In this case, it is necessary to parse the response XML file, extract the relevant data from within and then use Google Maps to place the data on a map and show its value.
3.5
–
AJAX
Asynchronous Javascript and XML (AJAX) it is a development technique to build in an easy and efficient way, web applications. These types of applications run on the client side and try to lighten as much workload as possible to the server maintaining an asynchronous connection with the latter one; that is why it is possible to display dynamic content without refreshing the browser and making again a full request to the server.
AJAX it is always on the background of this project although it is not specifically mentioned in any section. Applying this technique to the web application provides faster and lighter applications, something very important if the size of the website, requests to the server or embedded widgets is high.
3.6
–
Summary
C
HAPTER
4
A
NALYSIS
In this chapter it is presented the analysis process done at the beginning of the project in order to establish which are the competences, features and functionalities that the SOS Thin Client has to provide to the user. This section is divided in primary application requirements, a use-case diagram explaining the functionality and finally an overview of the high-level architecture behind the full project.
4.1
–
Requirements
The SOS Thin Client must satisfy a set of requirements explained below:
It must process Core and Transactional Profile operations.
A user interface must be provided and allow these functionalities:
o Select the required operation and type the input parameters of the request that will be sending to the server.
o Present an embedded map powered by Google Maps to place the data that the server will turn back to the user.
o The interface has to allow displaying many observations in the same map and deleting all of them when necessary.
Information retrieved from the server, must be displayed when an observation is directly selected on the map.
Interchange format between client and server is XML, therefore, it is necessary to parse XML files to extract relevant data coming from the server.
4.2
–
Use Case Diagram
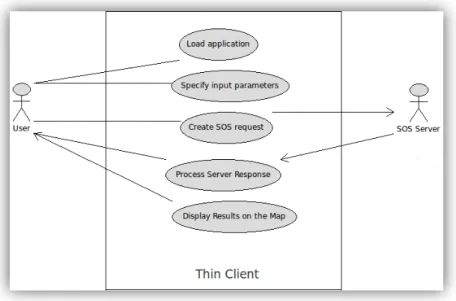
In this section a UML Use-case diagram is presented in order to give a graphical overview of the functionality provided by the system designed along this project. This diagram defines the behaviour of the system highlighting who the actors in the system are, which are their goals and show the dependencies between all the elements.
Thus, these are the actors and use cases found in this project:
a) Actors:
User: End user of the web application designed along this project. All processes starts because of the action of this actor.
SOS Server: This actor starts interacting with the system when the thin client has sent the SOS request to it.
b) Use cases:
Load application: This use case is activated by the user to start working the web application.
Create SOS request: This creates a customized XML request with the parameters the user has introduced that will be send to the SOS server, something that it is out of this system.
Process server response: When the server gives the response back to the thin client, this one will parse the XML response file in order to extract the relevant information, like georeference and value observed in a particular date, sensor station, sensor ID etc.
Display results on the map: Once this information has been extracted from the file, it is necessary to place it on the map and display the information associated to a sensor.
Finally it is presented the use case diagram for this project:
4.3
–
High level architecture
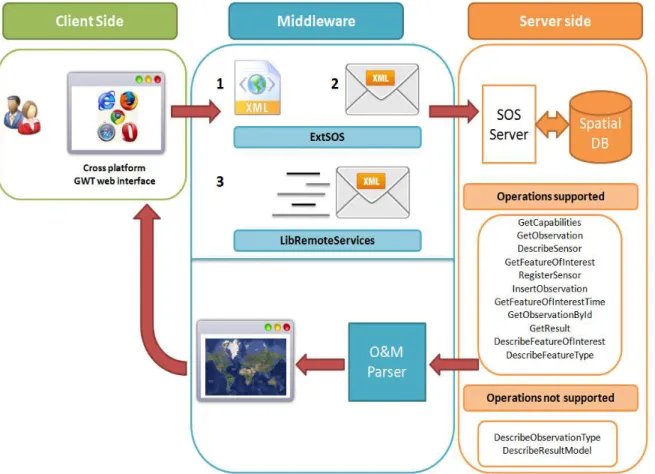
In this section will be described the general communication schema or high-level architecture diagram, in order to have a better understanding of the necessary elements used and programmed during the development of this project. Therefore, the general schema is the following one:
Figure 6: High-level architecture diagram.
The client-side part is in charge of the user interface presentation. It is a simple and clean interface where the user has to select one of the operations allowed by the server, fulfil the required parameters to complete a valid XML request that will be send to the remote server and finally display graphically the data that the latter one has sent back to the client-side.
According to definition, middleware is computer software that connects software components. This technology tries to increase interoperability between systems with different architectures and it is very useful to simplify complex distributed applications. In the context of geographic web applications, middleware is crucial to integrate information based on XML, SOAP or other web services. As its name suggests, middleware is software who lies in the middle of Client-Server architecture, trying to provide a full functionality without allowing client and server to be aware of the other counterpart. As said previously, middleware code is written and executed in our local machine.
In this case, middleware is software that has to get the input parameters the user has written and use enlarged ExtSOS extension (view section 3.2) to build a XML that will be send to the server. At this point, middleware has to wait for the server response. Then it will be necessary to parse the incoming response in order to extract relevant data, something that will depend on the type of operation selected by the user. Once this data has been extracted and stored in memory, it will be necessary to place them on a map displaying the information associated; for this we will use the georeference and raw data already parsed from the server response.
them try to follow OGC SOS standards, maybe they do not implement the Entire profile containing all 13 operations. To have access to Entire profile (or nearly Entire) profile is important for the development of this server, provided that Transactional Profile operations, as they are not mandatory to implement (like the Core Profile) sometimes they are just ignored/skipped by the developers of SOS servers.
Considering all this, the server chosen to make the testing of the project is the one hosted in Münster and managed jointly by 52ºNorth company and University of Münster. The reason for that is that server implements 11 of 13 operations defined on the SOS standard included both from the Transactional profile.
It is hosted in: http://giv-sos.uni-muenster.de:8080/52nSOSv3/sos
When the server receives an incoming XML request, this one is checked to know if it is correct or not. If so, then it is processed. Processing a XML request means that the server will parse, recognize the operation needed to perform and make a query to the spatial database it has associated.
Once the data (if any) is extracted, it will be enveloped on an Observation & Measurement (in advance O&M) format response and send back to the middleware part. It is important to note that O&M is a XML standard format for modelling sensor observations, so it needs a special way of parsing.
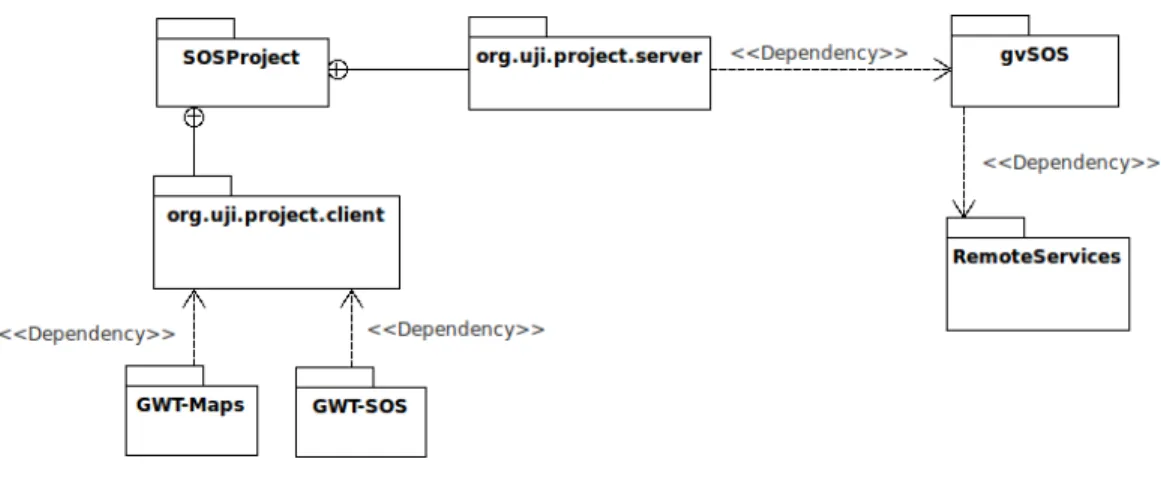
Figure 7: Package diagram for this project.
As the image depicts, general SOSProject package source code is divided into two main subpackages: client and server. The client package takes care of displaying windows and maps in the user interface. The server package contains code that uses gvSOS library and takes care of sending the request to the server, receiving and parse the response in order to extract relevant data that the client-side package will display again on the screen.
4.4
–
Summary
C
HAPTER
5
D
ESIGN AND
I
MPLEMENTATION
In this chapter it will be described in detail the necessary steps to build up a SOS thin client following the requirements exposed in previous section. For simplicity, just some sample code will be presented.
5.1
–
Application structure and behaviour
In this section it is possible to find some UML diagrams explaining the application structure and behaviour. First a class diagram is depicted and explained and finally, some sequence diagrams showing how classes interact along time are shown.
5.1.1
–
Application structure
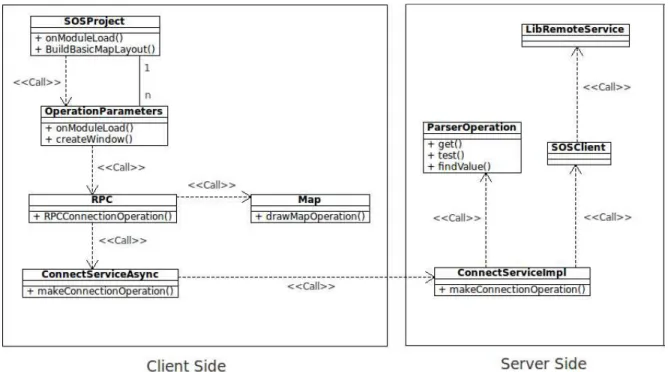
As said, next figure depicts the class diagram for this project:
Figure 8: Class diagram for SOSProject.
Therefore, these are the principal classes used on this application. The main program is written in SOSProject class that it is, at the same time, the entry point class for this application. This class builds the basic map layout and allows multiple operations selections. When an operation is selected, it starts a cascade function calling that will follow the flow represented on the diagram.
5.1.2
–
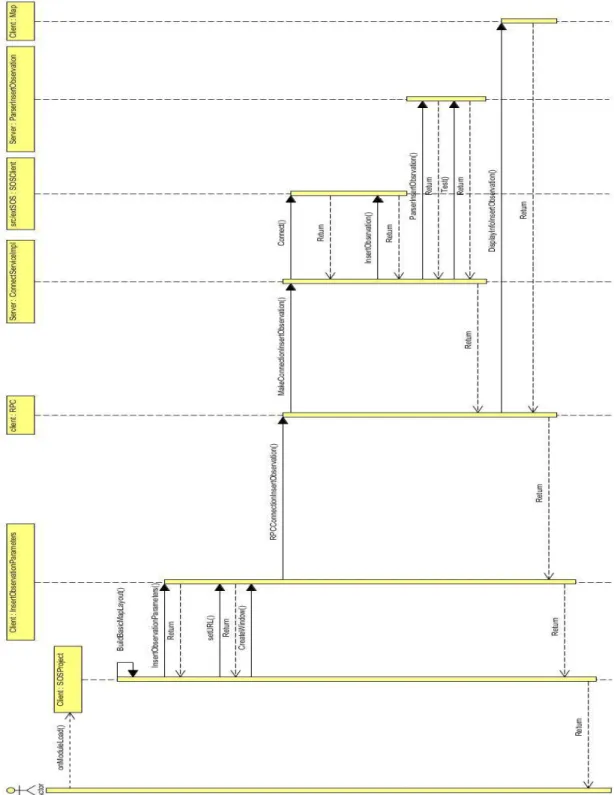
Application behaviour
Next image depicts the general behaviour of the application on runtime:
Previous sequence diagram illustrates the flow messages necessary between classes to connect to the server, send it the input parameters specified by the user, process the response and show the results on the final map. Next two diagrams (Figures 10 & 11) add more detail to the general sequence diagram presented above:
Figure 10: Detail sequence diagram for the RPC mechanism
In this first case, the diagram depicts how the RPC mechanism works and which are the classes involved on the communication between packages. The following sequence diagram details the functions and classes involved in the XML response parsing:
5.2
–
Designing thin client user interface
The initial version of this thin client user interface is very simple but provides a complex functionality. The interface is divided in two main parts: one for operation selection and insert input parameters for the specified operation and one for data visualization after sending the XML request to the server.
To design the interface, some paper sketches were done, until it was clear how the interface should look. After making the final sketch, next step was convert it to a GWT interface. First I created the panels and layouts using GWT Designer and some simple text boxes to verify that everything was on its place.
There are some considerations that an inexperienced GWT programmer has to deal with when using this toolkit:
On the client package it is just possible to write code using GWT classes, because this one is directly translatable into Javascript.
The server side will contain any code that requires non-GWT libraries. In this side, it is not possible to use GWT classes, the opposite than in the previous.
To communicate both packages, if needed, it is necessary to use a RPC mechanism. It is not possible to simply call from one package, a class lying in the other one, something that does not happen between the server package and any other external libraries.
it. It was necessary to read and practice individually with RPC mechanisms before obtaining a functional version of the web application.
After considering this, I started to fill each layout with the necessary elements: So I added to the operation selection panel a drop down list box with all SOS standard operations. Every time an operation is selected it is necessary to show up an extra window where the user can insert the required parameters for that operation. Therefore, using GWT classes, it is possible to overlap a window to the user interface to write the parameters and then click on a button to make the request to the server effective.
The map layout initially it is displaying as default three points that represent the three universities participating in this program, but, as long as the user requires to the server some geospatial data, this points will be substituted by the data coming from the server. The following image presents the final appearance of the user interface:
As seen, final appearance it is exactly the same as using Google Maps on the web browser and there are available all functionalities this tool provides. Therefore, it is possible to use to present the results, pins, lines, scales and other elements, customize their external look and use those elements according to the data retrieved from the server.
5.3
–
Communicating with the server
Once the final appearance of the interface is completed, it is time to starting a proper communication with the server. In this section it is important to divide this part in two as follows.
5.3.1
–
Getting client-side package parameters
As explained in section 3.1, to communicate client and server packages it is necessary to establish a RPC mechanism. In this project, it is absolutely required to use this way of communication between packages because client-side parameters introduced by the user are basic to construct a XML request for a SOS operation on the server-side.
parameters, it is necessary to program as many RPC functions as operations do exists, although all they are grouped in a single file.
Figure 13: Overlapping windows for Transactional Profile operations. The blank fields have to be used for inserting XML code.
5.3.2
–
Send operation XML request to the server
Once introduced parameters reach the server side, it is possible to build the XML request. It is in this point where external libraries are used: First I create a “SOSStatus” object and I fill the fields using the input parameters. After this operation I make a call to a “SOSClient” object that has a function called “connect” that will make the connection to the server effective.
Using these libraries it is possible to create either HTTP GET or POST request but in this case, just POST request are used, because it is necessary to attach an XML to the request and it would difficult to do using a GET one, especially considering that parameters are directly pasted on the URL.
5.4
–
Parse results
After sending the XML request with a SOS operation to the remote server it is time to wait for the response. When this one comes back to the server package of this web application, it is required to parse the response to extract relevant data.
The option chosen to parse this response that comes in an O&M format is Java XML Path Language library or XPath. There are other Java libraries to help out with parsing operation. In this case I chose XPath library, because it is relatively fast and easy to use, according to the size of this project. This library provides tools to extract specific nodes from a XML document independently of the inner format they have making distinction between an elements, attributes and lists: An element it is a value that lies between two XML tags; an attribute is the name of the tag in itself; a list is a special item because can be a list of attributes or elements. Its main feature is that if in a XML document there are many elements or attributes called the same, it gathers them all in a single and iterable list.
On Table 1, it is presented in detail of what is going to be searched and parsed on each response:
Operation / Parse georeference? value? other parameter?
GetCapabilities X X
DescribeSensor X X
GetObservation X X
InsertObservation X X
RegisterSensor X X
Table 1: It is important to note that just Core and Transactional Profile Operations are presented.
The parser receives a XML stream as the following one:
Figure 14: XML response file needed to parse for Get Observation operation.
As said, depending on the operation that is being performed (check Table 1) some parameters will be parsed or not and inserted on a list of type String. At this
mechanism (in section 5.2.1) to return this type of list in order to show or draw the results on the user interface.
The criterion followed to parse the available sample data is displaying easily recognizable information from the XML response, like the sensor name, the date when the sample was taken or what are they measuring. Actually, it is possible to show all response parameters found on the response and but how useful a parameter is, depends on the user purpose.
XPath is not a library with a high efficiency, because in difference of other parsers that builds a tree with the tags and values of the XML input on-the-fly with a linear cost, XPath builds a tree reading all characters one by one and comparing groups of them with the required field. In other words: XPath compares all substrings on a XML file with the one specified as input and this has a very high computational cost.
Initially and due to time restrictions on this master thesis development, high efficiency is not required, because at this stage it is more important to have a functional thin client than an unfinished one, so, for further versions of this software, it would be important to change XPath library for another one that provides a high efficiency performance, especially if it is expected to parse long XML documents or the thin client serves many requests per unit of time.
5.5
–
Display retrieved data on the map
web application is inserting the required data on a list of type string. At the end of parsing, this list will be available and in this moment it is time to call a function that will draw a specific map for this operation.
As said in section 2.2, not all operations return georeferenced data. For those that have this feature, just the response XML file will be presented on the user interface screen.
In case that they provide a georeferenced data it will be displayed a map on a screen as follows:
Figure 15: Result for a GetObservation operation.
5.6 - Summary
C
HAPTER
6
F
UTURE WORK
&
C
ONCLUSIONS
In this chapter, first it is given a brief description about the possible extensions that this project would accept and after this, conclusions for this work are presented.
First it would be interesting to do the following improvements:
Allow the displaying of more than one data request at once.
Allow to include data from multiple sources
Like this, some new features would appear. For example, given a georeferenced points cloud, it would be possible to calculate the convex hull that is wrapping some of the points. In sum, it would be possible to calculate different hulls depending on the points selected to make this curve. Other options would be: giving some statistical data of a points cloud like the minimum, maximum, mean values, covariance, etc.; calculate the area between all selected points; calculate the influence area surrounding a determined measure (like mercury in water: how far is contaminating ground and water) or, finally, allow the exportation of data to common formats like .shp, .gml, .kml, etc.
that initially, has a more complex functionality than Google Maps but it is heavier to work with.
Considering that it is possible to this project to be used for real, it is recommended to change XPath parser library for another one with a better efficiency. Maybe there is no need to do this change at first, but it should be considered if the client has to support many requests to the remote servers.
As a final comment for the future work analysis, it is important to mention one last thing. As everything is going mobile in the last years, it would be interesting to develop a user interface specially prepared for mobile or smartphone platforms and make the data accessible anywhere on Earth where an Internet connection is available. Of course, if this improvement or extension was carried out, it would be necessary, among other things, to make a software re-engineering process to the user interface in order to fit the size of different mobile devices.
Switching to the conclusions for this project, this document has presented the details about the development process of a SOS Thin Client, programmed using Java & GWT. The client allows users to interact easily with remote SOS servers without being necessary to have a powerful machine or a specific desktop application: just with a computer connected to Internet and a web-browser it is enough equipment.
One of the major problems found of the topic of this thesis is that all concepts are very new: for example, SOS standard was published in 2007 and GWT is still going through more and more improvements and has changed its SDK twice during the development of this thesis. Therefore, it is complicated to find much information or papers talking accurately about the topics described on this document. Nevertheless it exists an increasing user and developer‟s community available in forums and other types of websites that are quite enthusiastic with geographic information distribution and can be very helpful if a doubt or problem appears
For each step of the development process it is explained what to do and how to proceed and at the end, it is possible to find a whole section describing the major problems found along this project.
R
EFERENCES
[1] 52° North, Homepage. http://52north.org/. [9 January 2011].
[2] Aberer, K, Hauswirth, M & Salehi, L, “Middleware support for the Internet
of Things,” 5. GI/ITG KuVS Fachgespraech - Drahtlose Sensornetze, pp. 15 – 19, 2006
[3] Baldauf, RW, Lane, DD & Marote, GA 1999, „Ambient air quality monitoring
network design for assessing human health impacts from exposures to airborne contaminants‟, Environmental Monitoring and Assessment 66: 63–76.
[4] Benedito, M & Garcia, I 2010, Implementation of the operations corresponding to Enhanced & Transactional Profilse in a desktop SOS Client , Degree thesis,
University Jaume I.
[5] Botts, M, Percivall, G, Reed, C & Davidson, J 2008, „OGC Sensor Web
Enablement: Overview and High Level Architecture‟, Proceedings of the 5th
International ISCRAM Conference – Washington, DC, USA, May 2008.
[6] Bröring, A, Foerster, T & Jirka, S 2010. „Interaction Patterns for Bridging the gap between Sensor Networks and Sensor Web’, IEEE Internet
[8] Elbir, T 2003, „Comparison of model predictions with the data of an urban
air quality monitoring network in Izmir, Turkey‟, Journal of Athmospheric Environment, vol. 37, 2149 – 2157. Available from Elsevier.
[9] GeoCENS SOS passed OGC SOS compliance test, 2010. Available from:
http://sensorweb.geomatics.ucalgary.ca/news/geocens-sos-passed-ogc-sos-compliance-test . [28 February 2011]
[10] Google App Engine, Homepage,
http://code.google.com/intl/ca/appengine/. [9 January 2011].
[11] Google App Engine, The JRE Class White List,
http://code.google.com/intl/ca/appengine/docs/java/jrewhitelist.html [4
February 2011]
[12] Google Web Toolkit, Homepage,
http://code.google.com/intl/ca/webtoolkit/ .
[6 February 2011]
[13] Google Web Toolkit, Building User Interfaces,
http://code.google.com/intl/ca/webtoolkit/doc/latest/DevGuideUi.html.
[9 January 2011]
[14] Google Web Toolkit, Communicating with a Server,
http://code.google.com/intl/ca/webtoolkit/doc/latest/tutorial/clientserv
[15] Google Web Toolkit, Developer’s Guide,
http://code.google.com/intl/ca/webtoolkit/doc/latest/DevGuide.html.
[20 January 2011]
[16] Google Web Toolkit, Making Remote Procedure Calls,
http://code.google.com/intl/ca/webtoolkit/doc/latest/tutorial/RPC.html
. [20 January 2011].
[17] Google Web Toolkit Designer, GWT Designer User Guide,
http://code.google.com/intl/ca/webtoolkit/tools/gwtdesigner/index.htm
l. [20 January 2011].
[18] Harkat, MF, Mourot, G & Ragot, J 2005, „An improved PCA scheme for sensor FDI: Application to an air quality monitoring network‟, Journal of Process Control, vol. 16, 625 – 634. Available from: Elsevier.
[19] Havlik, D, Schimak, G, Denzer, R & Stevenot, B 2006, „Introduction to SANY (Sensors Anywhere) Integrated Project’, Available from Available from: < http://www.sany-ip.eu/publications/69 > [28 February 2011]
[20] Heinzelman, WB, Murphy, AL, Carvalho, HS & Perillo, MA 2004,
„Middleware to support sensor network applications‟, IEEE Network, Mar./Apr. 2006.
[21] Jirka, S, Bröring, A & Stasch, C, “Applying OGC Sensor Web Enablement to
Risk Monitoring and Disaster Management,” in GSDI 11 World Conference,
[22] Kereki, F 2010, Essential GWT: Building for the Web with Google Web Toolkit 2, Pearson Education, Boston, U.S.A.
[23] OOSTethys, Homepage, http://www.oostethys.org/. [20 January 2011]
[24] Open Geospatial Consortium. Observations and Measurements. 1.0.0. OGC Document Number 07‐022r1. 2007
[25] Open Geospatial Consortium. Sensor Observation Service. 1.0.0. OGC Document Number 06‐009r6. 2007.
[26] Open Geospatial Consortium. Sensor Planning Service. 0.0.3. OGC Document Number 05-089r3. 2005.
[27] Open Geospatial Consortium. Specification of the Sensor Service Architecture. 3.1. OGC Document Number 09-132r1. 2009
[28] Sierra, K & Bates, B 2005, Head First Java, O‟Reilly Media, Sebastopol (USA)
[29] Szewczyk, R, Osterweil, E, Polastre, J, Hamilton, M, Mainwaring, A & Estrin, D 2004, „Habitat Monitoring with Sensor Networks’, Communications
of the ACM, vol. 47, no. 6, June 2004.
[31] United Kingdom Air Quality Archive, Homepage, http://www.airquality.co.uk/ [18 January 2011]
[32] United Nations 2009. World Urbanization Prospects. The 2009 Revision., Available from: United Nations Population Division Home Page. [6 February 2011]
[33] Werner-Allen, G, Lorincz, K, Welsh, M, Marcillo, O, Johnson, J, Ruiz, M & Lees, J 2006, „Deploying a Wireless Sensor Network on an Active Volcano‟, IEEE Internet Computing, vol. 10, no. 2, pp. 18-25, Mar./Apr. 2006,
Irene Garcia Martí
ADDING SOSCORE &TRANSACTIONAL PROFILE SUPPORT TO A WEB THIN CLIENT