I
Universidade de Lisboa
Faculdade de Farmácia
Dissertation
Range and output simulation for elemental impurities in drug products
Rodrigo Filipe Teixeira da Silva
Dissertation supervised by
Professor Rui Loureiro and co-supervised by
Professor Dr. Joana Marques Marto.
Master degree in Pharmaceutical Engineering
II
Universidade de Lisboa
Faculdade de Farmácia
Dissertation
Range and output simulation for elemental impurities in drug products
Rodrigo Filipe Teixeira da Silva
Dissertation supervised by
Professor Rui Loureiro and co-supervised by
Professor Dr. Joana Marques Marto.
Master degree in Pharmaceutical Engineering
III “Imagination is more important than knowledge. For knowledge is limited to all we now know and understand, while imagination embraces the entire world, and all there ever will be to know and understand.”
IV
ABSTRACT
This master's degree in Pharmaceutical Engineering was developed at the Faculty of Pharmacy of the University of Lisbon (FFUL) in partnership with the Laboratório Edol - Produtos Farmacêuticos, S.A.
This project is based on a strong innovative component, since the control of elemental impurities has only applied to oral, parenteral and inhalation pharmaceutical forms. Therefore, the main objective of this project is perform a risk assessment for the control of EI in ophthalmological drugs of chronic, acute and sporadic use. To do this, it was necessary to carry out a study, as detailed as possible, of the entire process and components involved in the production of the three drugs products, making it essential to collect all process, product and use parameters.
After an in-depth knowledge of all those involved in the manufacturing process of each of the ophthalmological drugs under study, a Risk Assessment methodology was developed based on the principles of ICH Q3D. In this methodology the various calculation options available in the ICH Q3D are tested and the control of the levels of Impurities is performed using the Permitted Parental Daily Exposure made available in the ICH Q3D, since due to the lack of information, it was not possible to calculate the PDEs of the ophthalmic route.
With this project, it was possible to conclude that EI is commonly present in the most materials that come in direct contact with the drug and may affect the drug's efficacy and the health of the patient. It was also possible to verify that the lack of data was the greatest condition in the accomplishment of the same one, since it was necessary to resort to data of bibliography that represent scenarios quite maximized but still l most of the sources of elemental impurities are considered negligible, since the levels presented are much lower than the CL. Therefore, the Risk Assessment approach is an adequate strategy to control EI in ophthalmic drug products.
The goal of this project has been successfully achieved, and a risk assessment methodology for ophthalmic products is now available.
Key words: Elemental impurities, Eye drops solution Determination of Elemental Impurities, Simulation, Risk Assessment
V
RESUMO
Este projeto de mestrado em Engenharia Farmacêutica foi desenvolvido na Faculdade de Farmácia da Universidade de Lisboa (FFUL) em parceria com o Laboratório Edol - Produtos Farmacêuticos, S.A.
As impurezas elementares são contaminantes que podem ser oriundos da adição intencional de catalisadores, na síntese da substância medicamentosa, ou podem surgir naturalmente devido à contaminação ambiental dos excipientes ou substância ativa que compõem a formulação do medicamento.
As interações existentes entre os equipamento e todos os materiais que contactam diretamente com o produto durante a sua produção, incluindo os materiais de armazenamento, que por norma no caso de colírios são feitos de polímeros, são outro fator a ter em consideração numa avaliação de risco devido aos longos tempos de exposição do produto a estes materiais. Assim sendo, e sabendo que as impurezas elementares não oferecem qualquer benefício terapêutico e que por outro lado podem afetar negativamente o comportamento toxicológico do fármaco é extremamente importante controlar os seus níveis a fim de se garantir que estes se encontram dentro dos limites aceitáveis. O controlo das impurezas elementares era efetuado recorrendo ao método colorimétrico, no entanto, devido às suas limitações, e com o objetivo de se harmonizar os requerimentos técnicos para a regulação de impurezas elementares em produtos farmacêuticos de três regiões (Europa, Japão e Estados Unidos) a ICH iniciou, em 2009, a Q3D. Este documento classificou as impurezas elementares em 3 classes e estabeleceu os PDE para os 24 elementos. No entanto, este guia apenas apresenta os PDE’s para as vias de administração oral, parentéricas e inalatórias, ficando por estabelecer para as restantes vias. Sugere ainda que o controlo das impurezas elementares seja efetuado recorrendo aos princípios descritos na ICH Q9 assim sendo, este projeto assenta numa forte componente inovadora, dado que o principal objetivo deste projeto é a realização de uma avaliação de risco para o controle de impurezas elementares em medicamentos oftalmológicos de uso crónico, agudo e excecional. Para que tal seja exequível, foi necessário efetuar-se um estudo, o mais detalhado possível, de todo o processo e intervenientes envolvidos na produção dos três medicamentos, tornando-se essencial a recolha de todos os parâmetros de processo, produto e utilização.
Após um conhecimento aprofundado de todos os intervenientes no processo de fabrico de cada um dos medicamentos oftalmológicos em estudo, desenvolveu-se, baseada nos princípios da ICH Q3D, uma metodologia de Risk Assessment. Nesta metodologia são testadas as várias opções de cálculos disponibilizadas na ICH Q3D e o controle dos níveis de Impurezas é realizado recorrendo aos PDE’s parentéricos disponibilizados na ICH Q3D, dado que devido à inexistência de informação, não foi possível efetuar o cálculo dos PDE’s da via oftalmológica e a absorção medicamentosa nesta via é maioritariamente por via parentérica. A metodologia apresentada contempla 7 etapas:
• Etapa 1 – Identificação das fontes de impurezas elementares – Nesta etapa é realizado um estudo aprofundado de todos os componentes que contactam diretamente com o produto durante a sua produção, pretende-se obter uma lista exaustiva de todos os intervenientes a fim de se obter uma perspetiva global dos
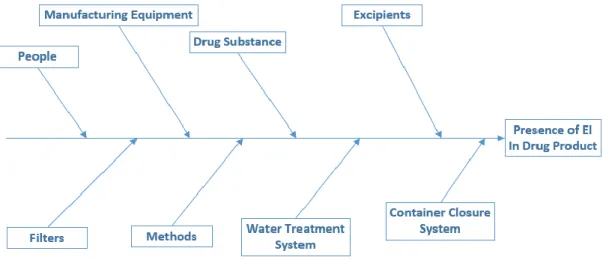
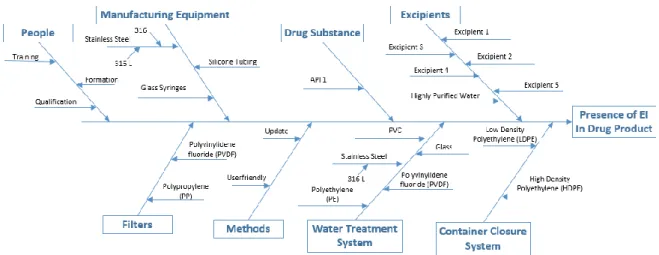
VI potenciais contaminantes do medicamento. Para que tal seja exequível, por norma recorre-se a um diagrama Ishikawa.
• Etapa 2 – Avaliação da contribuição da substância ativa e excipientes para a presença de impurezas elementares no produto final – Após a identificação da substância ativa e respetivos excipientes, foi necessário obter informação relativa à presença de impurezas elementares nos mesmos. Assim sendo, contactou-se os respetivos fornecedores que, quando tinham a informação disponível, enviaram os respetivos dossiers com os elementos presentes nos seus produtos e as respetivas concentrações. No caso de inexistência de resposta foi decidido assumir o worst-case scenario, isto é, que cada impureza assumiria a concentração permitida disponibilizada pela ICH Q3D. Após se obter esta triagem, ficou decidido quais os elementos a incluir nesta avaliação, nos casos em que o fornecedor não disponibilizou dados, assumiu-se que para esse produto as impurezas elementares não teriam sido intencionalmente adicionadas e por esse motivo a avaliação de risco foi realizada segundo as recomendações da ICHQ3D para elementos a serem considerados na avaliação de risco para a via de administração parentérica. De seguida comparou-se as concentrações de cada impureza elementar com as concentrações limite obtidas pelas opções de cálculo 1, 2A e 2B, disponibilizadas pela ICH Q3D.
• Etapa 3 – Avaliação da contribuição do equipamento de fabrico para a presença de impurezas elementares no produto final – O equipamento que contacta diretamente com o produto durante toda a fase de produção, incluindo o embalamento, pode constituir sérios riscos para a presença de impurezas elementares. Assim sendo, foi efetuado um levantamento criterioso de todo o equipamento, para os 3 produtos em teste, com o objetivo de se obter a sua composição e assim entender quais os potenciais elementos contaminantes. Do contacto com os fornecedores apenas se obteve os certificados analíticos de qualidade, tendo sido necessário recorrer-se à pesquisa bibliográfica para se obter a constituição do aço inox. Em termos de avaliação de risco, optou-se por usar uma abordagem conservativa em que se assume que por cada lote de fabrico migra 0.5 g/metal para o produto final. Assim, a contribuição do equipamento para a presença de impurezas elementares foi realizada para o lote de fabrico mais pequeno, de entre os produtos em tese, com o objetivo de se obter o worst-case scenario.
• Etapa 4 - Avaliação da contribuição dos filtros para a presença de impurezas elementares no produto final – Após o levantamento dos filtros utilizados durante o processo de fabrico contactou-se os fornecedores a fim de se obter os elementos presentes nos mesmo, dado que não se obteve resposta, recorreu-se à pesquisa bibliográfica para se estimar os elementos e as respetivas concentrações. Salienta-se que as concentrações obtidas estão bastante sobrestimadas, pois as condições
VII onde são realizados os testes de extração são bastante mais agressivas que as próprias características do produto.
• Etapa 5 - Avaliação da contribuição do sistema de tratamento de água para a presença de impurezas elementares no produto final – A água é o elemento mais comum na maioria das preparações farmacêuticas, especialmente nos colírios, e é facilmente contaminado. Assim sendo, foi realizado um estudo de todo o sistema de tratamento de água, permitindo identificar todos os materiais que contactam diretamente com a água. Após o contacto com os fornecedores verificou-se que a informação obtida era bastante escassa tendo sido necessário recorrer à pesquisa bibliográfica.
• Etapa 6 - Avaliação da contribuição do sistema de acondicionamento para a presença de impurezas elementares no produto final – Os sistemas de acondicionamento são considerados uma das maiores fontes de impurezas elementares, dado que o tempo de residência do produto é bastante elevado. Tendo em conta este facto, é extremamente importante efetuar um levantamento do material que constitui este sistema. No caso dos produtos em teste estes apenas contactam com um tipo de polímero, tendo sido o próprio fornecedor a realizar os testes para a presença de impurezas elementares e a disponibilizá-lo.
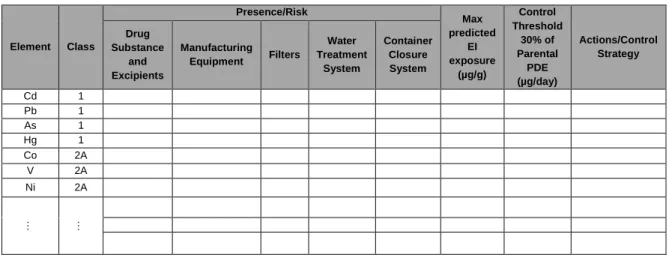
• Etapa 7 – Resumo da Avaliação de Risco – Nesta etapa foi decidido estudar-se 3 cenários, para se obter uma perspetiva diferente das várias possibilidades em estudo. Esta etapa permite ao aplicante decidir se é necessário recorrer a ações de correção, recorrendo para isso aos princípios descritos na ICH Q3D.
Com a implementação desta metodologia foi possível verificar, que embora os cenários em teste estejam bastante maximizados, que a análise de risco é uma abordagem perfeitamente adequada para a quantificação destes contaminantes, pois as concentrações obtidas são bastante abaixo das concentrações limite.
A realização deste projeto científico permitiu ainda verificar que a ICH Q3D apresenta algumas limitações, nomeadamente ao nível das opções de cálculo disponibilizas, pois estas deveriam ter em consideração as vias de administração e a forma farmacêutica em estudo. Assim sendo, o objetivo deste projeto foi alcançado com sucesso, e uma metodologia de avaliação de risco para produtos oftalmológicos encontra-se agora disponível.
Palavras-Chave: Impurezas Elementares, Colírios, Determinação de Impurezas Elementares, Simulação, Avaliação de Risco
VIII
AKNOWLEGEMENTS
A realização deste projeto não seria possível sem o contributo de algumas pessoas, que deste modo, apoiaram e incentivaram tornado possível a concretização deste projeto científico.
Em primeiro gostaria de agradecer ao professor Rui Loureiro da Faculdade de Faculdade de Farmácia da Universidade de Lisboa e orientador principal da minha tese, pelo apoio incondicional, pelo acompanhamento cuidado e por um esclarecimento mais abordado acerca do tema em estudo.
Agradeço à Prof. Doutora Joana Marques Marto da Faculdade de Faculdade de Farmácia da Universidade de Lisboa e minha coorientadora, por todo o apoio e disponibilidade demonstrada durante a execução deste trabalho científico, pois sem para além de toda a ajuda prestada foi um grande elo de ligação com o Laboratório EDOL, Produtos Farmacêuticos SA.
Ao Engenheiro Diogo Manata, por toda a disponibilidade prestada no esclarecimento de algumas questões técnicas cruciais ao desenvolvimento do meu projeto.
Á Prof. Doutora Helena Margarida Marques da Faculdade de Faculdade de Farmácia da Universidade de Lisboa e à Doutora Sara Raposo Loreau Diretora do Controlo de Qualidade e I&D do Laboratório EDOL, Produtos Farmacêuticos SA, pelo apoio e por todas as sugestões proferidas.
Agradeço ainda aos meus pais e avós, alicerces importantes na minha educação, e que sem eles nada disto seria possível. Obrigado pelo apoio e força dados para a concretização dos meus objetivos. Agradeço ainda aos meus irmãos e amigos por todo o apoio, incentivo e paciência durante a elaboração deste projeto científico, em especial à Ana Fernandes e à Patrícia Silva que foram grandes alicerces nos momentos mais complicados.
IX
List of Contents
ABSTRACT ... IV RESUMO ... V AKNOWLEGEMENTS ... VIII LIST OF FIGURES ... XIII LIST OF TABLES ... XIV
CHAPTER 1 – Introduction ...1
CHAPTER 2 – Literature Review ...2
2.1 Regulation of Impurities ...2
2.2 Impurities ...5
2.3 Heavy metals to Elemental Impurities...7
2.4 Elemental Impurities ...7
2.4.1 Sources of Contamination ... 8
2.4.2 New methods used to determine EI in drug product... 9
2.5 . Quality Risk Management ... 11
2.5.1 Risk Assessment process ... 12
2.5.2 Risk Control ... 13
2.5.3 Risk Communication ... 15
CHAPTER 3 – Materials and Methods ... 16
3.1 Data and data processing ... 16
3.2 Methodology for obtaining the PDE’s for the ophthalmic route ... 16
3.3 Calculation the Concentration Limit (CL) to control the levels of EI in the Active Substance and Excipients that composes the drug product. ... 18
3.3.1. Option 1: ... 18
3.3.2. Option 2A: ... 19
3.3.3. Option 2B: ... 19
3.3.4. Option 3: ... 20
3.4. Risk Assessment Process ... 20
3.4.1. Step 1: Identification of sources of the EI: ... 21
3.4.2. Step 2: Evaluation of the contribution of the Active Substance and Excipients to the presence of EI in the final dur product: ... 22
3.4.3. Step 3: Evaluation of the contribution of the Manufacturing Equipment to the presence of EI in the final dur product: ... 23
3.4.4. Step 4: Evaluation of the contribution of the filters to the presence of EI in the final drug product: ... 24
3.4.5. Step 5: Evaluation of the contribution of the Water Treatment System to the presence of EI in the final drug product:... 24
3.4.6. Step 6: Evaluation of the contribution of the Container Closure System to the presence of EI in the final drug product:... 24
X
3.4.7. Step 7: Summary of the Risk Assessment: ... 25
CHAPTER 4 – Results and Discussion of Results ... 26
4.1. Drug product 1 ... 26
4.1.1. Drug product presentation ... 26
4.1.2. Information about components of the drug product to be included in the Risk Assessment ... 28
4.1.3. Sources of Contamination ... 31
4.1.4. Elements included in Risk Assessment ... 32
4.1.5. Risk Assessment to Active Substance and Excipients ... 32
4.2. Drug product 2 ... 36
4.2.1. Drug product presentation ... 36
4.2.2. Information about components of the drug product to be included in the Risk Assessment ... 38
4.2.3. Sources of Contamination ... 40
4.2.4. Elements included in Risk Assessment ... 40
4.2.5. Risk Assessment to Active Substance and Excipients ... 41
4.3. Drug Product 3 ... 45
4.3.1. Drug product presentation ... 45
4.3.2. Information about components of the drug product to be included in the Risk Assessment ... 47
4.3.3. Sources of Contamination ... 49
4.3.4. Elements included in Risk Assessment ... 49
4.3.5. Risk Assessment to Active Substance and Excipients ... 50
4.3.6. Risk Assessment to Manufacturing Equipment ... 55
4.3.7. Risk Assessment to Filters ... 57
4.3.8. Risk Assessment to Water treatment system ... 59
4.3.9. Risk Assessment to Container Closure System ... 62
4.3.10. Summary of the Risk Assessment ... 63
4.3.10.1. Summary of Risk Assessment for drug product 1. ... 64
4.3.10.2. Summary of Risk Assessment for drug product 2. ... 69
4.3.10.3. Summary of Risk Assessment for drug product 3. ... 74
4.3.11. Discussion of Results ... 79
CHAPTER 5 – Conclusion ... 81
CHAPTER 6 – Further Considerations ... 82
References ... 83
Appendix 1 ... 86
XI
LIST OF ABREVIATIONS
AAS Atomic Absorption Spectrometry
Ag Silver
Al Aluminium
API Active Pharmaceutical Ingredient
As Arsenic Au Gold B Boron Ba Barium Bi Bismuth BP British Pharmacopeia Ca Calcium Cd Cadmium CL Concentration Limit Co Cobalt Cr Chromium EI Elemental Impurities
EMA European Medicines Agency
Fe Iron
GR-AAS Atomic Absorption Spectrometry including graphic furnace
HDPE High Density Polyethylene
Hg Mercury
ICH International Conference on Harmonization
ICP Inductively Coupled Plasma
ICP-MS Inductively coupled plasma mass spectrometry
ICP-OES/AES Inductively Coupled Plasma Optical Emission Spectrometry
Ir Iridium
JP Japanese Pharmacopoeia
K Potassium
LDPE Low Density Polyethylene
Li Lithium
LO(A)EL Low-Observed-Effect Level
XII Mg Magnesium Mn Mn Mo Molybdenum Na Sodium Ni Nickel
NO(A)EL Non-Observed-Effect Level
Os Osmium
Pb Lead
Pd Palladium
PDE Permitted Daily Exposure
Ph.Eur European Pharmacopoeia
Pt Platinum
QRM Quality Risk Management
Rh Rhodium Ru Ruthenium Sb Antimony Se Selenium Sn Tin Tl Thallium
USP United States Pharmacopoeia
V Vanadium
W Tungsten
XIII
LIST OF FIGURES
Figure 1. EMA classification of EI. Adapted (9). ... 2
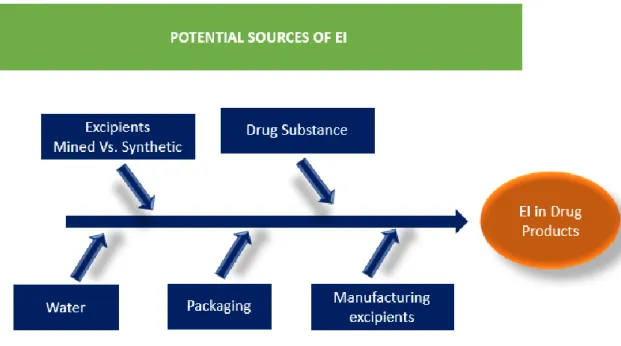
Figure 2. Potential Sources of metallic impurities during the production process of pharmaceuticals. Adapted (28)... 8
Figure 3. Articles published from 2005 to 2015 (up to October 2015) regarding to the use of inductively coupled plasma (ICP)-based and atomic absorption spectrometry (AAS) methods for the determination of elements elemental impurities in pharmaceutical products. Data received from: (24). ...10
Figure 4. Overview of a typical quality management process (34). ...12
Figure 5. Risk Assessment process...13
Figure 6. Hierarchy of Controls (40)...14
Figure 7. Simplifying methodology to implement the ICH Q3D. ...21
Figure 8. Fishbone diagram showing risk assessment of inclusion of the EI in production of a drug product and potential sources and the overall contribution of the EI to the drug product (adapted by ICH Q3D guideline (2)). ...22
Figure 9. Methodology to identify the elements included in the manufacturing. ...23
Figure 10. Potential sources of Elemental Impurities in drug product 1. ...31
Figure 12. Potential sources of Elemental Impurities in drug product 2. ...40
Figure 14. Potential sources of Elemental Impurities in drug product 3. ...49
XIV
LIST OF TABLES
Table 1. ICH Q3D Classification of elemental Impurities and the need for Risk Assessment
considering the route of administration. Adapted from (2). ... 4
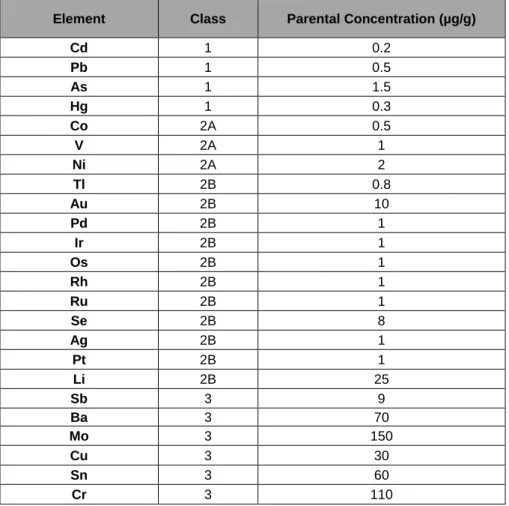
Table 2. Parental Permitted Daily Exposures for Elemental Impurities. Data revived from (2). ...18
Table 3. Permitted Concentration of EI, adapted from (2). ...23
Table 4. Model table that allows to obtain the Summary of the Risk Assessment. ...25
Table 5.Composition of drug product 1. ...27
Table 6. Analytical data of elemental impurities in excipient 2, provided by Novo Nordisk Pharmatech...29
Table 7.Analytical data of elemental impurities in Excipient 5, provided by Merck Millipore. ...30
Table 8. Elements considered in elemental impurities Risk Assessment for drug product 1. ...32
Table 9. Predicted Elemental impurities level in drug product 1 take in consideration the option 1 and assuming one daily amount of drug product of 3 g/day. ...33
Table 10. Predicted Elemental impurities level in drug product 1 take in consideration the option 1 and assuming one daily amount of drug product of 5 g/day. ...33
Table 11. Predicted Elemental impurities level in drug product 1 take in consideration the option 1 and assuming one daily amount of drug product of 10 g/day. ...34
Table 12. Predicted Elemental impurities level in drug product 1 take in consideration the option 2A. ...35
Table 13. Predicted Elemental impurities level take in consideration the option 2B...36
Table 14. Qualitative/quantitative composition of drug product 2. ...37
Table 15. Elements considered in elemental impurities Risk Assessment for drug product 2. ...41
Table 16. Predicted Elemental impurities level in drug product 2 take in consideration the option 1 and assuming one daily amount of drug product of 3 g/day. ...42
Table 17.Predicted Elemental impurities level in drug product 2 take in consideration the option 1 and assuming one daily amount of drug product of 5 g/day. ...42
Table 18. Predicted Elemental impurities level in drug product 2 take in consideration the option 1 and assuming one daily amount of drug product of 10 g/day. ...43
XV Table 19.Predicted Elemental impurities level in drug product 2 take in consideration the option 2A. ...44 Table 20. Predicted Elemental impurities level of drug product 2 take in consideration the option 2B. ...45 Table 21. Composition of drug product 3 per bottle with 5 ml of solution. ...46 Table 22. Analytical data of elemental impurities in API 3, provided by Química Sintética, S.A. ...47 Table 23. Elements considered in elemental impurities Risk Assessment for drug product 3. ...50 Table 24. Predicted Elemental impurities level in drug product 3 take in consideration the option 1 and assuming one daily amount of drug product of 3 g/day. ...51 Table 25. Predicted Elemental impurities level in drug product 3 take in consideration the option 1 and assuming one daily amount of drug product of 5 g/day. ...51 Table 26. Predicted Elemental impurities level in drug product 3 take in consideration the option 1 and assuming one daily amount of drug product of 10 g/day. ...52 Table 27. Predicted Elemental impurities level in drug product 3 take in consideration the option 2A. ...53 Table 28. Predicted Elemental impurities level in drug product 3 take in consideration the option 2B. ...54 Table 29. Composition of stainless steel grades 304, 316 and 316L. The values are present in percentage and represent the worst-case scenario. ...55 Table 30. Main equipment that directly contact with the three drugs products during their manufacturing. ...55 Table 31. Stainless steel 316L EI contribution in the finished drug product considering material composition. ...57 Table 32. Predicted EI levels from filters materials used in the manufacture train of the drug products, obtained through extraction. Concentrations are presented in µg/g. Data retrieved from reference (3)(57). ...58 Table 33. Components of the water treatment system to be included in the Risk Assessment. ...60 Table 34.Predicted EI levels from water treatment system material. Concentrations are presented in µg/g. Data retrieved from reference (53)(57)(3). ...61 Table 35. Predicted EI levels from LDPE bottle and dropper dispenser. Concentrations are presented in µg/g. ...62 Table 36. Conclusion summary of EI Risk Assessment assuming the highest value of each element observed in all Risk Assessment components against the Control Threshold for each
XVI identified elemental impurity. Contribution of drug substance and excipients by Option 2A. ...64 Table 37. Conclusion summary of EI Risk Assessment assuming the highest value of each element observed in all Risk Assessment components against the Control Threshold for each identified elemental impurity. Contribution of drug substance and excipients by Option 2B. ...65 Table 38. Conclusion summary of EI Risk Assessment assuming the contribution of Active Substance and Excipients given by option 2A and all contribution given by all components of the Risk Assessment against the Control Threshold for each identified elemental impurity. ...66 Table 39. Conclusion summary of EI Risk Assessment obtained only by the contribution of Active Substance and Excipients given by option 2A against the Control Threshold for each identified elemental impurity. ...67 Table 40. Conclusion summary of EI Risk Assessment obtained only by the contribution of Active Substance and Excipients given by option 2B against the Control Threshold for each identified elemental impurity. ...68 Table 41. Conclusion summary of EI Risk Assessment assuming the highest value of each element observed in all Risk Assessment components against the Control Threshold for each identified elemental impurity. Contribution of drug substance and excipients by Option 2A. ...69 Table 42. Conclusion summary of EI Risk Assessment assuming the highest value of each element observed in all Risk Assessment components against the Control Threshold for each identified elemental impurity. Contribution of drug substance and excipients by Option 2B. ...70 Table 43. Conclusion summary of EI Risk Assessment assuming the contribution of Active Substance and Excipients given by option 2A and all contribution given by all components of the Risk Assessment against the Control Threshold for each identified elemental impurity. ...71 Table 44. Conclusion summary of EI Risk Assessment obtained only by the contribution of Active Substance and Excipients given by option 2A against the Control Threshold for each identified elemental impurity. ...72 Table 45. Conclusion summary of EI Risk Assessment obtained only by the contribution of Active Substance and Excipients given by option 2B against the Control Threshold for each identified elemental impurity. ...73 Table 46. Conclusion summary of EI Risk Assessment assuming the highest value of each element observed in all Risk Assessment components against the Control Threshold for each identified elemental impurity. Contribution of drug substance and excipients by Option 2A. ...74 Table 47. Conclusion summary of EI Risk Assessment assuming the highest value of each element observed in all Risk Assessment components against the Control Threshold for each identified elemental impurity. Contribution of drug substance and excipients by Option 2B. ...75
XVII Table 48. Conclusion summary of EI Risk Assessment assuming the contribution of Active Substance and Excipients given by option 2A and all contribution given by all components of the Risk Assessment against the Control Threshold for each identified elemental impurity. ...76 Table 49.Conclusion summary of EI Risk Assessment obtained only by the contribution of Active Substance and Excipients given by option 2A against the Control Threshold for each identified elemental impurity. ...77 Table 50. Conclusion summary of EI Risk Assessment obtained only by the contribution of Active Substance and Excipients given by option 2B against the Control Threshold for each identified elemental impurity. ...78
1
CHAPTER 1 – Introduction
Elemental impurities (EI) are external entities to the drug product that may arise from a variety of sources. They can be added during the production of raw material, occur naturally by environmental contamination or result from contamination by the equipment and packaging systems. Because they have no therapeutic benefit and are associated with drug safety and efficacy problems, they should be controlled (1–3).
The implementation of the ICH Q3D guideline, which establishes the permitted daily exposure (PDE) of each element for the oral, inhalation and parenteral routes, has led the pharmaceutical industry to focus on this theme, suggesting the control of these impurities (2,4). The objective of this project is to realize a Risk Assessment to implement this guideline to three products for ophthalmologic application and for chronic, acute and sporadic use, thus making it necessary to obtain an EI control methodology for the respective route of administration, to obtain the maximum level of elemental impurities in products (2).
This project is divided in 6 chapters, the next chapter – LITERATURE OVERVIEW - has the purpose of giving the background required to understand the issues addressed in the later chapters. Therefore, the focus is mainly on EI and its regulation, and on the principles of Quality Risk Management (QRM). Following this, the chapter – MATERIALS AND METHODS – are described the materials and methods used to perform the experimental procedures related to the performance of the risk assessment are described. This chapter is focus on data processing, methodology for obtaining the PDE’s for the ophthalmic route, on options for control the levels of EI in active substance and excipients and finally in the methodology proposed for the implementation of the Risk Assessment.
In chapter – RESULTS AND DISCUSSION OF RESULTS - presents the results obtained for the three products applying in a detailed way the methodology developed. These results are duly discussed during this chapter. Finally, in Chapter – CONCLUSIONS -, the conclusions reached in this study are presented and on Chapter – FURTHER CONSIDERATIONS – are given future work perspectives, allowing the continuity of the work presented here.
2
CHAPTER 2 – Literature Review
2.1 Regulation of Impurities
The impurities in drug products often possess unwanted pharmacological–toxicological effects and do not provide any therapeutic benefit to the patient, their levels in the drug product should be controlled within acceptable limits (5)(6).
In 1998, the European Medicines Agency (EMA), initiate the development of a guideline on residual catalysts in pharmaceuticals. The goal of this guidance is to establish limits for the control of 14 metal catalyst or metal reagents on toxicological safety assessment (7)(8). In 2008, The EMA Guideline on Specification Limits for Residues of Metal Catalysts or Metal Reagents was officially implemented for new drug products. This guidance introduces the principle of the mass-based PDEs to establish permissible exposures in drug products rather than concentration limits in drug product. The PDEs in this guideline were based on assessments of toxicological data on individual metals (7).
The EMA guideline clusters the 14 metal residues into three classes. Metals with significant toxicity, including human carcinogens, are placed in Class 1. This class are further subdivided into three subclasses called 1A, 1B and 1C. The class 1A include Platinum (Pt) and Palladium (Pd). Iridium (Ir), Osmium (Os), Rhodium (Rh) and Ruthenium (Ru) elements are placed in Class 1B. Class C elements are Molybdenum (Mo), Nickel (Ni), Chromium (Cr) and Vanadium (V). In Class 2 are placed metals with a low safety concern and which includes Cupper (Cu) and Manganese (Mn). Metals with no significant toxicity are grouped in Class 3. This class include Iron (Fe) and Zinc (Zn) (9). Figure 1 indicates classification of elements by EMA.
Figure 1. EMA classification of EI. Adapted (9).
EMA Classification Class 1 Class 1A (Pt and Pb) Class 1B (Ir, Rh, Ru and Os) Class 1C (Cr, Ni, v and Mo) Class 2 (Cu and Mn) Class 3 (Fe and Zn)
3 Later in 2008, the USP proposed introduce two new chapters, chapter <232>, which would establish safety based limits on elemental impurities in pharmaceutical products, and <233> which would establish appropriate criteria in methods for elemental analysis, to replace the old colorimetric method <231> These chapters are official implemented in February 2013 (7). In 2009, with the scope of harmonizing technical requirements for elemental impurities in pharmaceutical products across three regions (Europe, Japan, and United States), the International Conference on Harmonization (ICH) initiated the Q3D expert working group. This working group, like in EMA guidance and USP chapters, try to set maximum PDE’s for elemental impurities in pharmaceutical products based on assessment of existing toxicological data for oral, parenteral and inhalation routes of administration. In June 2013, ICH Q3D reached step 2 and was published for a public review. The step 4 reaches in November 2014 and the USP Expert Panel on Elemental Impurities align Chapters <232> and <233> with Q3D (7).
This council group propose classify 24 elemental impurities in three classes, based on their toxicity (PDE) and likelihood of occurrence in the drug product for inhalation, parenthetic and oral route. The probability of occurrence of each EI depends on factors such as: likelihood of use in pharmaceutical process, probability of being a co-isolated impurity with other elemental impurities in materials used in pharmaceutical process, and the observed natural abundance and environmental distribution of the element (2)(6). The elements are dived in three classes and two subclasses (Table 1). The class 1 includes elements that are human toxicants and recommend evaluate them during the risk assessment. Their presence normally comes from used materials, such as mined excipients. Because your toxicity, the use of this elements needs to be limited or excludes in the manufacture of pharmaceuticals. In Class 2, the probably of occurrence the impurities in drug product are subdivided in Class 2A, 2B and 2C. The elements in Class 2A have more probably of occurrence in drug product than Class 2B elements, for this reason, these elements should be included in the risk assessment while Class 2B elements need not to be considered during the risk assessment, because they have low potential to be co-isolated with other materials. In the Class 3, are included the elements with low toxicity but they may require consideration for the risk assessment for inhalations and parenteral routes (2).
This guidance still suggests some other elemental impurities, but because their low inherent potential toxicity and/or differences in regional regulations the PDEs are not established. The elements considered are: Aluminium (Al), Boron (B), Calcium (Ca), Iron (Fe), Potassium (K), Magnesium (Mg), Manganese (Mn), Sodium (Na), Tungsten (W) and, Zinc (Zn) (2)(6).
4 Table 1. ICH Q3D Classification of elemental Impurities and the need for Risk Assessment considering the route of
administration. Adapted from (2).
Class Elements Characteristics
Risk Assessment If
intentionally added (all
routes)
If not intentionally added
Oral Parental Inhalation
1
Arsenic (As), Cadmium (Cd), Mercury (Hg), and
Lead (Pb)
Toxic elements that have limited or no use in the
manufacture of pharmaceuticals, require risk
assessment across all potential sources of EI and
routes of administration.
Yes Yes Yes Yes
2A Cobalt (Co), Nickel (Ni), and Vanadium (V)
High probability of occurrence in drug product, require risk
assessment across all potential sources of EI and
routes of administration.
Yes Yes Yes Yes
2B
Silver (Ag), Gold (Au), Iridium (Ir), Osmium (Os), Palladium (Pd), Platinum (Pt), Rhodium
(Rh), Ruthenium (Ru), Selenium (Se), and
Thallium (Tl)
Reduced probability of occurrence in drug product,
excluded from the risk assessment unless they are intentionally added during the manufacture of drug product.
Yes No No No
3
Barium (Ba), Chromium (Cr), Lithium (Li), Molybdenum (Mo), Antimony (Sb), and Tin
(Sn).
Low toxicities by the oral route of administration but may require consideration in the risk assessment for inhalation
and parental routes.
Yes No
Yes, for Cu, Li, and Sb,
no for Ba, Cr, Mo, and
Sn
Yes
This guidance also suggests that EI in the drug should be controlled using the principles of Quality Risk Management, described in ICH Q9: “Quality Risk Management”. With this approach, the applicant can identify/analyse the risk, evaluate (compare levels with the PDE’s) and controls as required (2). But this guidance does not provide any specific tool to perform this(2).
The ICH guideline also provides a number of specific control options, to ensure that the concentration of elemental impurities in drug product or their components not exceed the PDEs. Option 1: Common permitted concentration limits of elements across drug product components for drug products with daily intakes of ≤10 g, providing a simplified approach to the PDE calculations. The option assumes that elemental impurities identified in the risk assessment (the target elements) are present in all components of the drug product (2). Option 2a: As per Option 1, except that the calculation is modified to include the specific product dose (2).
Option 2b: Permitted concentration limits of elements across drug product component materials for a product with a specified daily intake. This option allows the applicant to establish limits in terms of permitted concentrations for each individual component based on the distribution of elements in the components, i.e., it permits higher concentrations of specific elements in some components provided that for each element the total amount of the elemental impurity in the final drug product does not exceed the permitted limit (2).
5 Option 3: Finished Product Analysis. The concentration of each element can be measured in the drug product (2).
This guideline covers all elemental impurities, including those arising from natural sources and/or process impurities. In contrast, the earlier EMA guideline specifically focused on metal catalysts / metal reagents.
The ICH Q3D Step 5 has been effect for new marketing authorisations since June 2016 and for existing authorised medicinal products since 2017 (10). The new USP General Chapters USP<232> ‘Elemental Impurities – Limits’, USP<233> ‘Elemental Impurities – Procedures’ and USP<2232> ‘Elemental Contaminants in Dietary Supplements has implemented in 1 January 2018 (11)(10).
2.2 Impurities
According to ICH, an impurity in a drug substance is defined as “Any component of the drug product which is not the chemical entity defined as the drug substance or an excipient in the drug product” (ICH Q6A: Specifications) (12). In pharmaceutical world, an impurity are considered an external compound besides drug substance, or excipients, which arise out of synthesis or the unwanted chemicals that remains with the Active Pharmaceutical Ingredient (API) (13).
Because pharmaceutical impurities are also referred to as “drug-related substances” they can arise from a variety of origins including starting materials, reaction by products generated during synthesis of drug substances, intermediates, degradation products formed during the formulation manufacture process and/or storage of formulated products, reagents, ligands and catalysts (14)(15). However, impurities can have safety and efficacy implications and are therefore the subject of considerable attention by both the manufacturer (industry) and regulatory (15).
The safety of a drug product, or a dosage form, depends not only on the toxicological properties of the drug substance but also on the properties of those pharmaceutical impurities (14). The presence of impurities in pharmaceuticals, even in small amounts, is a concern, not only because some contaminants are inherently toxic, but because they may adversely affect the drug stability, efficacy and, self-life of the drug product, or may cause unwanted side-effects (16)(17)(18).
While the use of pharmaceuticals is always a balance of risks and benefits, the same is not true for impurities in pharmaceuticals, because impurities convey only risk and not have any therapeutic benefit to the patient, they are expected to be known and rigorously managed (19)(3). Monitor and control of impurities generally gives assurance of the quality and safety of a drug, but the control of pharmaceutical impurities are considerate a critical and challenging issue by pharmaceutical industry and regulatory agencies, because they try to create norms to assure that the level drug impurities does not reach high risk values (5)(20)(19).
6 Impurities in drug product can be dived in two types: Impurities associated with the API and Impurities formed during the formulation and/or aging or that are related to the formulated forms (17).
The impurities associated with the API can be classified in three categories and different names can be adopted to classify these impurities, but according ICH guidelines, impurities can be classified in organic, inorganic and residual solvents (17)(13)(16).
Organic impurities are commonly found in API’s and can arise during the manufacturing processes, including synthesis steps, and/or packing materials (16)(21)(22). They may be identified or unidentified, volatile or non-volatile (17). This type of impurities can be called “process and drug related” and can include: (21)(22)
• Starting materials or intermediates • By-products of the synthesis: • Degradation products
• Material using during the synthesis like reagents, ligands and catalysts (21)(22). Inorganic impurities are associated to manufacturing process and normally they are known and identified (16)(21). They can include:
• Reagents, ligands, and catalysts • Heavy metals
• Inorganic salts
• Other materials like filters aids and charcoal (16)(21)(22).
Residual solvents are organic volatile chemicals used in the manufacturing process of drug substances or excipients, or generated during the production (16). Normally this type of impurity can’t be totally removed by practical manufacturing techniques (21). The residual solvents are classified into three classes, depending on the level of risk they present to human health (16):
• Class 1 solvents: Identifying with human carcinogens, strongly suspect human carcinogens, and environmental hazards. This class is to be avoided.
• Class 2 solvents: Include non-genotoxic animal carcinogens or possible causative agents of other irreversible toxicity. Solvents suspected of other significant but reversible toxicities. The use of this solvents is to be limited.
7 2.3 Heavy metals to Elemental Impurities
Heavy metals are natural compounds of the Earth’s crust and they cannot be degraded or destroyed. This components can enter in human body via food, drinking water, cigarettes and air (23). But, in the past, the term “Heavy Metals” was erroneously used in literature to refer a group of metals, metalloids, and some non-metals which had some toxicity and were associated to contamination of pharmaceuticals. This term has no basis connection with toxicological or chemical data and suggest that all compounds of the same element (organic and/or inorganic) have the same physical, chemical and toxicological properties, which is not true for the most elements. In addition, heavy metals refer to any metallic chemical element that has relatively high density and is toxic at low concentrations. For the most pharmacopoeias the term heavy metals are “metallic impurities that are coloured by 7 sulphide ion, under the specified test conditions” but this designation is limited because this term include other elements and only a specific group of elements respond to this test, in addition some relevant elements with toxicological relevance are not covered by this test. To solve this problem, a new designation for the term heavy metals was created and the term IE comes as a new designation for this group of elements (24).
2.4 Elemental Impurities
Are defined as elements that are found in the environment and that can be used or introduced in the manufacture of drug substances or excipients (25)(8). This term is adopted an alternative to the ill-defined term heavy metals and include various transition metals and metalloids (26). This metallic impurities can be present in pharmaceuticals from several sources and via a number different means (27)(3). They can be present in the drug product by intentional addition in chemical synthesis (metal catalysts or metal reagents),or be present by as a contaminant resulting the interactions with the process equipment and piping, raw materials, water, the environment, cleaning solvents and storage systems that contact directly with the drug product (6)(26)(27)(28).
The presence of this elemental (inorganic) impurities in finish drug products, even in small amounts, may influence the safety and efficacy of the drug product (17). Their levels in the drug product should be known and controlled with the acceptable limits, because these contaminates not provide any therapeutic benefit and pose some risk to the patient health due to toxicological effects (6).
Some elements classified as EI, like zinc, copper, chromium, iron, and manganese are considerate to be essential to the human nutrition, as they play critical roles in the structures of proteins and the activities of enzymes, but only in trace and ultra-trace levels (5)(27)(29). On the other hand, some elements such arsenic, mercury and lead, are known to be quite toxic to human beings (5). According this, the level of elemental impurities in drug products should be managed, known and low (3).
8 2.4.1 Sources of Contamination
Elemental Impurities can be present in final drug product by intentional addition of the elements in the production process, such reagents and catalysts or can result of the elements cannot completely removed from the API synthesis (2)(25). There are also other sources of contamination related to the materials used in equipment and all surfaces (generally metals) that directly contacts with API or drug product. The incorporation of elemental impurities in drug product may be related to phenomena such as corrosion extraction/leaching, or delamination, like it was verified in contamination by aluminium from glass, zinc from plastic and rubber materials used in container closure systems (24).
The container closure system is another source of elemental impurities because the elemental entities present in the materials of construction of this systems, that contact directly with the drug product, may leach to the during the time that the drug product is in contact with the polymers, and these leached elemental impurities become elemental impurities in drug product (3).
Water is another source of contamination of the drug product because it is widely used in many pharmaceutical process, from synthesis to the production of pharmaceutical dosage forms and if any problem related to the quality of this component are not detected this can contaminate the drug product. According this, and because these contaminations are very difficult to detect, it is very useful to choose an appropriate Water Treatment System. To control the level of contamination of the water, is strongly recommended to determine EI level in all pharmacopoeias (24). In Figure 2, are identified the potential sources of metallic impurities present in production process of pharmaceuticals.
9 Knowledge about the presence, level and “leachability” of elemental entities in polymers used in manufacturing and packaging systems is relevant to understanding how manufacturing and packaging systems contribute to a drug product’s total elemental impurity burden (3).
2.4.2 New methods used to determine EI in drug product
The pharmaceutical industry is subject to a high level of regulation, leading to the development and manufacture of drugs controlled by government agencies through a set of laws and guidance documents. The main propose of regulations is to ensure quality, efficacy and safety of drugs (8). The world regulatory agencies require the control and monitoring of the toxic elements to acceptable levels in pharmaceutical industry (11).
The acceptable levels of heavy metals in pharmaceuticals usually are defined by the regulatory agencies and controlled by limit tests. These limit tests are regulated by pharmacopoeias and permit ensure the absence that inorganic contaminants in drug products (5)(8). Due this, the USP, British Pharmacopoeia (BP), European Pharmacopoeia (Ph.Eur) and Japanese Pharmacopoeia (JP) have developed chapters to propose collective monitoring of total metal content in drugs and drugs substances (5)(8)(30). These pharmacopoeia methods include this elements: As, Cd, Cu, Sn, Sb, Pb, bismuth (Bi), Ag, Hg and Mo and the methodology is similar in all pharmacopoeias, involve the precipitation of metal sulfides from a weak acid media and the colours of metal sufides range from white to yellow, orange, brown and black, this precipitate is compared by visual comparison with a 10 ppm lead sulphide reference standard (dark brown) (8)(30)(5). This test has been in place for over 100 years, and different names are used by pharmacopoeias to designate this method. In USP this test is called Chapter <231>: Heavy Metals Analysis and Ph.Eur General Chapter 2.4.8 Heavy metals (8)(27).
This colorimetric method have some significant limitations, that including non-specific method, less sensitive, time consuming and less accurate (5):
• Subjective and difficult visual exam of the sample solution compared to standard solution.
• The result of this method is seldom reliable and reproductible, because the formation of the sulfides is affected by sample matrix and hence.
• Only applied to elements that form coloured sulfide precipitates, applicable to ten elements (Pb, Hg, Bi, As, Sb, Sn, Cd, Ag, Cu and Mo).
• Non-selective method, which means it cannot distinguish between elements with high and low toxicity.
• Requires large sample amounts for low detection levels (for example a minimum of 2 g sample is required for a detection limit of 10 ppm).
• Time consuming and require many workers.
• The sample preparation can be leading to the loss of volatiles elements, because it occurs in a furnace at 600 degrees. It is mean that the procedure does not provide real quantitative results. (example: mercury in solid samples is not recovered at all) (8)(9)(31).
10 According to the limitations of the old colorimetric method, the Ph.Eur, USP and ICH have introduced new changes in regulation of elemental (inorganic) impurities, motivating an increase of the interest of determination of elemental impurities in pharmaceutical products (2)(28)(24).
With this new changes, the wet chemical and colorimetric test have been replaced with instrumental methods that provide specific, quantitative determination of individual elemental impurities in drug products and ingredients and new analytical methods are proposed (32). The USP replace the old method with Inductively Coupled Plasma Mass Spectrometry (ICP-MS) and Inductively Coupled Plasma Optical Emission Spectrometry (ICP-OES/AES) and the Ph.Eur provides a several general chapters for the analysis of elemental impurities using the analytical methods Atomic Absorption Spectrometry (AAS) , including graphic furnace AAS (GF-AAS), Inductively Coupled Plasma – Atomic Emission Spectrometry (ICP-OEA/AES) and Inductively Coupled Plasma – Mass Spectrometry (ICP-MS) (11)(8).
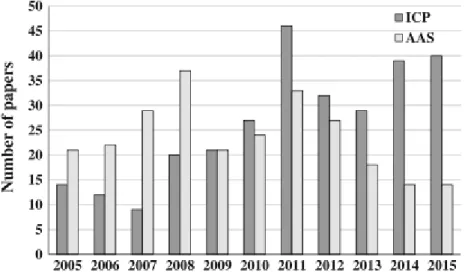
Determination of EI by ICP-based methods in pharmaceuticals is increasing, like we can observe in Figure 3. This increasing may be justified by the multielemental capability of plasma-based instruments, especially when compared with absorption spectrometry (AAS) (24).
Figure 3. Articles published from 2005 to 2015 (up to October 2015) regarding to the use of inductively coupled plasma
(ICP)-based and atomic absorption spectrometry (AAS) methods for the determination of elements elemental impurities in pharmaceutical products. Data received from: (24).
In Figure 3 it is possible to verify that from the year 2008 to the year 2009, the interest by the ICP methods had a great prospect because two important documents from EMA and USP, both published in 2008, that refer to the evaluation of elemental impurities certainly contributed to increase the interest of this techniques. These documents alerted the community to the importance of establishing limits of concentration for EI and given the ability of these equipment’s to carry out analyses of multielements, these techniques were considered a valid option in the determination of EI. In 2010, the USP and BP create two general chapters to determine EI in APIs and this chapters are published in 2012 in EP. In these pharmacopoeias, the use of spectrometry techniques, including ICP-MS and ICP-OES, is recommended (24).
11 The main advantages and limitations of using ICP methods are described, covering the applications reported in the literature mainly for active substance, raw materials, and pharmaceutical dosage forms (24). These advantages include:
• Ability to identify and quantify all elements with exception of Aragon.
• Suitable for all concentrations from ultra-trace levels to major components because many wavelengths of varied sensitivity are available for determination of any one element.
• Detection limits are generally low for most elements with a typical range of 1-100 g/L.
• Perform multielemental analysis quite and rapidly, a complete multielemental analysis can be undertaken in a period as short as 30 seconds and consuming only 0.5 ml of sample solution (33).
2.5 . Quality Risk Management
Quality Risk Management (QRM) is a systematic process for the assessment, control, communication and review of risks to the quality of the drug (medicinal) product across the product lifecycle (34)(35). QRM concept depends upon the understanding of terms ‘Quality’ and ‘Risk’. The term Quality means “The degree to which a set of inherent properties of a product, system or process fulfils requirements” (ICH Q9) and as per ISO/IEC Guide 51, the term Risk means “The combination of the probability of occurrence of harm and the severity of that harm” (35).
Quality Risk Management, as described in ICH Q9, can be used in a variety of activities including assessing options for the design of the manufacturing process, assessing quality attributes and manufacturing process parameters, and increasing the assurance of routinely producing batches of the intended quality (36). It can provide a proactive approach to identifying, scientifically evaluating and controlling potential risks to quality. It facilitates continual improvement of process performance and product quality throughout the product lifecycle (37).The QRM process involves:
• Hazards (sources of harm) that can adversely influence drug quality characteristics. • Extent of harm.
• Sub processes critical for quality (35).
12 Figure 4. Overview of a typical quality management process (34).
2.5.1 Risk Assessment process
Risk Assessment, according to the principals described in ICH Q9: Quality Risk Management, has a part of a quality Risk system (Figure 4) and consists of the identification of hazards and the analysis and evaluation of the Risk associated with exposure to those hazards. According this, Risk Assessment is an simple way to minimize the process Risk, which should include a multidisciplinary expertise group and to begin with this approach it is necessary to have an well-defined problem description (38)(34). To do this, there are three fundamental questions:
• What can go wrong with the process? • How frequently occur?
• What are the consequences?
2.5.1.1 Steps of Risk Assessment process
To start a Risk Assessment process, it is necessary to follow a set of steps that the ICH Q9 guide suggests (Figure 5). The first step is Risk Identification that consists of identifying the hazards of the entire manufacturing process, referring to the Risk question or problem description. Essentially, identifying the hazards answers the question, "What can go wrong?". This is a brainstorming activity with the team. This activity should generate many known and potential failure modes. The goal is to make this list as exhaustive as possible. Since identifying all potential failures can be an enormous task when considering an entire manufacturing process, the process map generated during the initiation phase of the risk management process is a valuable tool to generate the logical breaks that organize and focus the brainstorming (34)(39).
13 The next step in the Risk Assessment is Risk Analysis. It is the qualitative or quantitative process of linking the likelihood of occurrence and severity of harms. The qualitative or quantitative estimation of severity or the consequence, and the likelihood and the ability to detect the failure, are determined during the risk analysis (34).
The final step in the Risk Assessment is the Risk Evaluation. In this stage are compared the identified and analysed Risk against given risk criteria. At this point, the risk assessment phase ends (34).
The risk management process would continue through the steps of risk control, risk review and communication (Figure 4).
2.5.2 Risk Control
Risk control includes decision making to reduce and/or accept risks. The purpose of risk control is to reduce the risk to an acceptable level. The amount of effort used for risk control should be proportional to the significance of the risk. Decision makers might use different processes, including benefit-cost analysis, for understanding the optimal level of risk control (34).
Risk control might focus on the following questions: • Is the risk above an acceptable level?
• What can be done to reduce or eliminate risks?
• What is the appropriate balance among benefits, risks and resources? • Are new risks introduced as a result of the identified risks being controlled?
Risk reduction focuses on processes for mitigation or avoidance of quality risk when it
exceeds a specified (acceptable) level (Figure 4). Risk reduction might include actions taken to mitigate the severity and probability of damage. Processes that improve the detectability of hazard and quality risks might also be used as part of a risk control approach. The implementation of risk reduction measures can introduce new risks into the system or increase the significance of other existing risks. Hence, it might be appropriate to revisit the risk assessment to identify and evaluate any possible change in risk after implementing a risk reduction process (34).
Risk
Identification
Risk Analysis
Risk
Evaluation
14
Risk acceptance is a decision to accept risk (decided case by case assessment). Risk
acceptance can be a formal decision to accept the minor risk or it can be a passive decision in which minor risks are not specified. For some types of harms, even the best quality risk management practices might not eliminate risk .In these circumstances, it might be necessary an appropriate quality risk management support and that quality risk is reduced to a specified (acceptable) level (34).
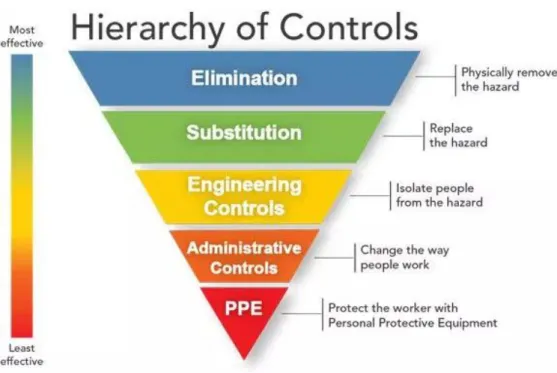
In some industries, are widely used the Hierarchy of Controls (Figure 6) to minimize or eliminate exposure to hazards. The hazard controls in the hierarchy are, in order of decreasing effectiveness:
• Elimination
• Substitution
• Engineering Controls
• Administrative Controls
• Personal protective equipment
(40).
Figure 6. Hierarchy of Controls (40).
The idea behind this hierarchy is that the control methods at the top of graphic are potentially more effective and protective than those at the bottom. Following this hierarchy normally leads to the implementation of inherently safer systems (41).
15 2.5.3 Risk Communication
Risk communication is the sharing of information about risk and risk management between the decision makers and others. Parties can communicate at any stage of the risk management process (Figure 4). The output/result of the quality risk management process should be appropriately communicated and documented (Figure 4). Communications might include those among interested parties; e.g., regulators and industry, industry and the patient, within a company, industry or regulatory authority, etc. The included information might relate to the existence, nature, form, probability, severity, acceptability, control, treatment, detectability or other aspects of risks to quality. Communication need not be carried out for each and every risk acceptance. Between the industry and regulatory authorities, communication concerning quality risk management decisions might be affected through existing channels as specified in regulations and guidance’s (34).
16
CHAPTER 3 – Materials and Methods
3.1 Data and data processing
In Risk Assessment, the data and their mode of treatment can influence the success of this approach. Due this, in this scientific project, the data collection was performed following two different approaches. To obtain information about the levels of EI present in the API and Excipients, used in the formulation of the drug product, a formulary was sent to the respective suppliers. In absence of a response it was decided assuming the worst-case scenario, that the presence of EI in the component was in the maximum concentration allowed for option 1. This scenario was derived for the remaining calculation options. In the case of the supplier does not perform the EI level tests for the required elements and considering the route of administration to be used, it was decided that the highest value of an element that the supplier has quantified was assumed.
A complete risk analysis includes the identification of all materials that directly contact with drug product, including throughout the manufacture. This material can contribute significantly to the presence of EI in final drug product, in order to obtain the possible contribution, it was performed a bibliographic literature review, in absence of information from the supplier. It is important to note that in many of these extractable studies the conditions under which the tests are carried out more aggressive than the properties of the product. Thus, these tests can overestimate the presence of this elements.
The lack of data and the worst-case scenario negatively influence the outcome of the Risk Assessment, since the results obtained can lead to this analysis for three scenarios. Therefore, the result of the Risk Assessment can be found in the green zone, an area that, even assuming the worst scenario, does not require control actions to be implemented. The results that are in the orange zone, are considered limiting because they are close to the zone that requires control actions. In the red zone are the results of Risk Assessment that exceed the maximum values of control. In this zone control actions are necessary, resorting to the principles described in ICH Q9.
3.2 Methodology for obtaining the PDE’s for the ophthalmic route
The Permitted Daily Exposure (PDE) gives the maximum permitted quantity of each element that may be contained in the maximum daily intake of a drug product. In this guidance, the PDE’s are considered the to be protective of public health for all patients populations (2). The ICH Q3D, only establishes the PDE’s for the Oral, Parenteral and Inhalation routes of administration, however the objective of this scientific work is to apply this guide to ophthalmic products. Thus, it is necessary to obtain the PDE’s of each elemental impurity for the ocular route of administration and to do this it is necessary to calculate the ophthalmologic PDE. To perform this approach is necessary to apply the Equation 1, were the NO(A)EL means Non-Observed-Effect Level and F1, F2, F3, F4 and F5 represents the modifying factors.
17
𝑃𝐷𝐸 =
𝑁𝑂(𝐴)𝐸𝐿×𝑀𝑎𝑠𝑠 𝐴𝑑𝑢𝑠𝑗𝑡𝑚𝑒𝑛𝑡𝐹1×𝐹2×𝐹3×𝐹4×𝐹5 (Eq. 1)
F1 – A factor to account for extrapolation between species. F2 – A factor 10 to account for variability between individuals.
F3 – A variable factor to account for toxicity studies of short-term exposure. F4 – A factor that may be applied in cases of severe toxicity.
F5 – A variable factor that may be applied if the NO(A)EL was not established.
Normally, the PDE is preferably derived from a NO(A)EL. If no NO(A)EL is obtained, the LO(A)EL, Lowest-Observed-Effect Level, may be used. Due the lack of information on bioavailability, it was not possible to conclude this procedure and the suggestion of this guidance, derivation of the PDE, was adopted (2).
Given the complexity of the eye as an organ, demonstration of appropriate acceptance limits for elemental impurities derived from the ophthalmic route of administration is required. Thus, a specific assessment for elemental impurities exposure and derived risks was performed, with an aim to establish acceptance limits for ophthalmologic products. During this assessment the factors considered were the physiology and the performance of the tear-flow drainage system, the effect of excipients and bioavailability of the drug product on ocular and the ocular toxicological profile of the elemental impurities of interest.
According to the ocular toxicological profile of the elements it is possible indicate that, unless the eye is exposed to excessive levels of particular elements, no local effects or visual impairments are expected. Given that, the major part of the applied dose is absorbed systemically through a non-productive absorption to the conjunctiva of the eye via the nasal mucosa by spillage from the conjunctival sac or loss through the puncta to the lacrimal drainage system. Therefore, it was decided that the Permitted Daily Exposures, for ocular route, in all of the three products included in this scientific work, assume the values provided in ICH Q3D for parenteral route. Due this, no local effects are expected at exposure levels below the parenteral PDE values, thus it was not necessary apply modification factors in parental PDE’s (42)(43).
In view of the facts above mentioned, for the proposes of the Risk Assessment, the values of the Predicted Daily Exposure of each elemental impurity included on this evaluation are depicted in Table 2.