Brazilian Journal of Microbiology (2012): 517-527 ISSN 1517-8382
COMPARISON OF DIFFERENT PROTOCOLS FOR THE EXTRACTION OF MICROBIAL DNA FROM REEF
CORALS
Santos, H.F.1; Carmo, F.L.1; Leite, D.C.A.1; Jesus, H.E.1; De Carvalho Maalouf, P.1,2; Almeida, C.1; Soriano, A.U.3;
Altomari, D.4; Suhett, L.3; Vólaro, V.4; Valoni, E.3; Francisco, M.3; Vieira, J.3; Rocha, R.4; Sardinha, B.L.3; Mendes, L.B.3;
João, R.R.3; Lacava, B.3; Jesus, R.F.3; Sebastian, G.V.3; Pessoa, A.5; van Elsas, J.D.6; Rezende, R.P.8; Pires, D.O.7,9; Duarte,
G.7,9; Castro, C.B.7,9; Rosado, A.S.1,9; Peixoto, R.S.1,9
1
Laboratório de Ecologia Molecular Microbiana, Universidade Federal do Rio de Janeiro, Rio de Janeiro, RJ, Brasil; 2Protein Engineering Center, Institute of Chemistry, University of Liege, Belgium; 3Gerência de Biotecnologia, Centro de Pesquisas
Leopoldo Américo Miguez de Mello, Petrobras, Rio de Janeiro, RJ, Brasil; 4 Fundação Gorceix, Ouro Preto, MG, Brasil;
5
Faculdade de Ciências Farmacêuticas, Universidade de São Paulo, SP, Brasil; 6Department of Microbial Ecology, University of Groningen, Groningen, The Netherlands; 7Departamento de Invertebrados, Museu Nacional, Universidade Federal do Rio de Janeiro, Rio de Janeiro, RJ, Brasil; 8Universidade Estadual de Santa Cruz, Ilhéus, BA, Brasil; 9Projeto Coral Vivo, Universidade
Federal do Rio de Janeiro, Rio de Janeiro, RJ, Brasil.
Submitted: December 10, 2011; Approved: June 07, 2012.
ABSTRACT
This study aimed to test different protocols for the extraction of microbial DNA from the coral Mussismilia harttii. Four different commercial kits were tested, three of them based on methods for DNA extraction from soil (FastDNA SPIN Kit for soil, MP Bio, PowerSoil DNA Isolation Kit, MoBio, and ZR Soil Microbe DNA
Kit, Zymo Research) and one kit for DNA extraction from plants (UltraClean Plant DNA Isolation Kit,
MoBio). Five polyps of the same colony of M. harttii were macerated and aliquots were submitted to DNA extraction by the different kits. After extraction, the DNA was quantified and PCR-DGGE was used to study
the molecular fingerprint of Bacteria and Eukarya. Among the four kits tested, the ZR Soil Microbe DNA
Kit was the most efficient with respect to the amount of DNA extracted, yielding about three times
more DNA than the other kits. Also, we observed a higher number and intensities of DGGE bands for both
Bacteria and Eukarya with the same kit. Considering these results, we suggested that the ZR Soil Microbe
DNA Kit is the best adapted for the study of the microbial communities of corals.
Key words: coral, microbial diversity, DNA extraction.
INTRODUCTION
Among the ecosystems that are responsible for
maintaining the diversity of life in the oceans, coral reefs have
long been recognized as the most important. They are among
the systems that support the greatest biodiversity and thus offer
the most valuable benefits to man. About 30% of all marine
life in the oceans is present in coral reef ecosystems, which
*Corresponding Author. Mailing address: Laboratory of Molecular Microbiology, Federal University of Rio de Janeiro (UFRJ), Rio de Janeiro, Brazil.; E-mail:
account for only 0.20% of the ocean area (15, 17). Conversely,
corals are under serious threat because of anthropogenic
activities as well as environmental changes caused by global
warming, such as rising temperatures and ocean acidification
(6, 12). While about 30% of reefs worldwide have already been
seriously damaged, 60% of them are in danger of being
completely lost by 2030 (26). On the bright side, recent studies
have revealed particular physiological mechanisms that
improve the resilience of corals to the effects of climate change
and anthropogenic activities (12).
Recently, it was postulated that corals need a
diverse community of microorganisms to live healthily, this
association is called holobiosis (2, 19, 21). This resulted in
the hologenome concept, where the genome of the host can
act in concert with the genomes of the associated
symbiotic microorganisms, providing the holobiont organism
with greater adaptive potential. To understand the role
of microorganisms in the survival and evolution of corals, it is
extremely important to carry out studies on the composition,
structure and functional activity of the microbial
community associated with healthy as well as diseased corals
from different regions.
Studies on the microbial communities in
different environments have shown that about 90.0%
to 99.9% of the microbial community is often not cultivable by
the traditional techniques of microbiology (7). For this reason,
to carry out a survey of the microbial diversity associated
with a particular environment or organism, such as corals, it
is critical to use direct molecular techniques. The DNA
extraction from the samples is the first critical step in
any molecular technique based on DNA (12). However, there
is a paucity of DNA extraction methods that have been
successfully applied to corals. Therefore, this study aimed
to test four different methods of DNA extraction from coral:
three kit-based methods for DNA extraction from soil
(FastDNA SPIN Kit for soil, PowerSoil DNA Isolation Kit,
MoBio, and ZR Soil Microbe DNA Kit, Zymo Research) and
one kit for DNA extraction from plants (UltraClean Plant DNA
Isolation Kit, Mobio).
MATERIALS AND METHODS
Site and sample collection
A colony of Mussismilia harttii was collected from a reef area off Porto Seguro, Bahia, Brazil (circa 16˚29’28,8” S and 039˚03’49,9” W), on a 2 m depth fringing reef at 400 m of the coast.
Preparation of coral samples
Five polyps of the same colony were separated in small
pieces of approximately 1 g each, containing mucus, tissue and
skeleton. They were macerated in a mortar in dry condition
using a pestle before proceeding with the
different extraction protocols.
DNA extraction and quantification
For this study we tested four different methods of DNA
extraction: the FastDNA SPIN Kit for soil (Method F), the
PowerSoil DNA Isolation Kit (Method P), the ZR Soil Microbe
DNA Kit (Method Z) and the UltraClean Plant DNA Isolation
Kit (Method U).
The FastDNA SPIN Kit for soil was designed to isolate
bacterial, fungal, plant and animal genomic DNA from soil and
other environmental samples, such as feces, environmental
water, wastewater and sludge. The PowerSoil DNA
Isolation Kit is ideal for processing all types of environmental
samples including most difficult ones with high contents of
humic acid such as compost, sediment and manure. This
Kit distinguishes itself from others with a patented procedure
that eliminates PCR inhibitors (humic substance) from the most
difficult soil types, promoting successful downstream PCR
analysis. The ZR Soil Microbe DNA Kit™ is designed to
isolate humic-free, PCR-quality genomic DNA from microbes
Santos, H.F. et al. Microbial DNA from reef corals
tough-to-lyse bacteria, fungi, protozoa, and algae that inhabit a
range of samples including clay, sandy, silty, peaty, chalky,
and loamy soils. The UltraClean® Plant DNA Isolation Kit is designed to purify total cellular DNA from plant cells and
tissues. For all kits, we followed the manufacturer’s instruction
with some modifications to perform the extractions.
Method F - The FastDNA SPIN Kit for soil
Up to 500 mg of sample was added to 978 μL of Sodium Phosphate Buffer and 122 μL of MT Buffer in Lysing Matrix E tubes. The mixture was homogenized in the FastPrep®
machine for 40 s at a speed setting of 6.0, after which it was
centrifuged at 14,000 x g for 5-10 min to pellet debris. The
supernatant was transferred to a clean 2.0 mL microcentrifuge tube. After this, 250 μL PPS (Protein Precipitation Solution) was added, and the solution was mixed manually by shaking 10
times the tubes. Then, centrifugation was performed at 14,000
x g for 5 min to pellet the precipitate, after which the
supernatant was transferred to a clean 15 mL tube. The
Binding Matrix was resuspended and 1 mL was added to the
supernatant in the 15 mL tube. Next, the tubes were inverted by
hand for 2 min to allow binding of DNA and kept still for 3 min to allow settling of the silica matrix. Then, 500 μL of the supernatant were removed and discarded, being careful to
avoid the settled Binding Matrix containing the DNA. The
Binding Matrix was then resuspended in the remaining
supernatant. Then, approximately 600 μL of the mixture was
transferred to a SPIN™ Filter and centrifuged at 14,000 x g for
1 min. The catch tubes were emptied and the remaining
mixture was added to the SPIN™ Filter and centrifuged as
before. The catch tubes were emptied again. At this step, a pellet is formed above the SPIN™ Filter, 500 μL of prepared SEWS-M wash solution is added in order to gently
resuspended it using the force of the liquid from the pipette tip.
The catch tubes were centrifuged at 14,000 x g for 1 min, after
which they were emptied and replaced. Without any addition of
liquid, the system was centrifuged a second time at 14,000 x g
for 2 min to “dry” the matrix of residual wash solution. The
catch tubes were discarded and replaced with clean ones. The
SPIN™ Filter was air-dried for 5 min at room temperature and
the Binding Matrix was gently resuspended (above the SPIN
filter) in 50-100 μL of DES (DNase/Pyrogen-Free Water).
Finally, a centrifugation step at 14,000 x g for 1 min
brings the eluted DNA into the clean catch tubes and is now
ready for any downstream application.
Method P - The PowerSoil DNA Isolation Kit
The kit provides PowerBead Tubes to which 0.25 mg of
each coral sample were added and the tubes are mixed by
gentle vortexing. Then 60 µL of Solution C1 were added and
the tubes were vortexed for 5 seconds. After a centrifugation
step at 10,000 x g for 30 seconds at room temperature, the
supernatant was transferred to a clean 2 mL Collection Tube.
Then 250 µL of Solution C2 were added and the tubes were
vortexed for 5 seconds. Following that, the tubes were
incubated at 4°C for 5 min and the centrifuged at room
temperature for 1 min at 10,000 x g. Then up 600 µL of
supernatant were transferred to a clean 2 mL Collection Tube
avoiding the pellet. 200 µL of Solution C3 were added and the
tubes were briefly vortexed and incubated at 4°C for 5 min.
The mixtures were centrifuged at room temperature for 1 min
at 10,000 x g. Then, up to 750 µL of supernatant were
transferred to a clean 2 mL Collection Tube. Then 1200 µL of
Solution C4 were added to the supernatant and the mixtures
vortexed for 5 seconds. Approximately 675 µL of the mixture
were loaded onto a Spin Filter and centrifuged at 10,000 x g for
1 min at room temperature. The flow through was discarded, an
additional 675 µL of supernatant was added to the Spin Filter
and centrifuged at 10,000 x g for 1 min at room temperature.
The same was done with the remaining volume of supernatant.
Then 500 µL of Solution C5 were added and centrifuged at
room temperature for 30 seconds at 10,000 x g. After
discarding the flow through, the samples were centrifuged
Spin Filters were placed in a clean 2 mL Collection Tube with
care not to splash them with the flow through. Then 100 µL of
Solution C6 were added to the center of the white filter
membrane. Centrifugation was performed at room temperature
for 30 seconds at 10,000 x g and the Spin Filter was discarded.
The DNA in the tube is now ready for any downstream
application.
Method Z - The ZR Soil Microbe DNA Kit™ Short Protocol
For this Kit was added up to 0,5 g of coral sample to a ZR
BashingBead™ Lysis Tube. The tubes were homogenized in
the FastPrep® for 40 seconds at a speed setting of 6.0 and
centrifuged at 14,000 x g for 1 min. Then 400 µL of the
supernatant were transferred up to a Zymo-Spin™ IV Spin
Filter (orange top) in a Collection Tube and centrifuged at
14,000 x g for 1 min. Next 1,200 µL of Soil DNA Binding
Buffer were added to the filtrate in the Collection Tube and a
volume of 800 µL of this mixture was transferred to a
Zymo-Spin™ II Column in a Collection Tube. The mixture was
centrifuged at 10,000 x g for 1 min. The flow through was
discarded and another 800 µL of the mixture was transferred to
the Zymo-Spin™ II Column and the same centrifugation was
performed. Then the Zymo-Spin™ II Column was transferred
to a new Collection Tube and 200 µl of DNA Pre-Wash Buffer
were added and centrifuged at 10,000 x g for 1 min. After that,
500 µL of Soil DNA Wash Buffer were added to the
Zymo-Spin™ II Column and centrifuged at 10,000 x g for 1 min. The
Zymo-Spin™ II Column was transfered to a clean 1.5 mL
microcentrifuge tube and 100 µL of DNA Elution Buffer were
added directly to the column matrix. Next a centrifugation was
performed at 10,000 x g for 30 seconds to elute the DNA.
Finally, the eluted DNA was transferred to a prepared
Zymo-Spin™ IV-HRC Spin Filter (green top) in a clean 1.5 mL
microcentrifuge tube and was centrifuged at 8,000 x g for 1
min. The filtered DNA is now suitable for PCR and other
downstream applications.
Method U - UltraClean Plant DNA Isolation Kit
In this kit, 200 mg of sample are needed for the extraction.
The weighted coral was mixed with 60 µL of Solution P1 in
the 2 mL Bead Solution tubes by slight vortexing. Next, the
tubes were incubated in a water bath at 65ºC for overnight. The
next day, the tubes were homogenized in the FastPrep® for 40
seconds at a speed setting of 6.0 and centrifuged at 10,000 x g
for 30 seconds. The supernatant was transferred to a clean 2
mL Collection Tube. 250 µL of Solution P2 were added and
the mixture was vortexed for 5 seconds and incubated at 4ºC
for 5 min. Then the tubes were centrifuged for 1 min at 10,000
x g. Avoiding the pellet, 500 µL of the supernatant was
transferred to a clean 2 mL Collection Tube and 1 mL of
solution P3 were added (be careful to shake the Solution P3
before use). Vortex 5 seconds to mix the sample with the
solution. Load approximately 650 µL onto the Spin Filter,
centrifuge at 10,000 x g for 30 seconds and discard the flow
through Repeat this step with the remaining volume of sample.
Then 300 µL of Solution P4 was added and the Spin Filters
were centrifuged for 30 seconds at 10,000 x g. The flow
through was discarded and the filters centrifuged again to
remove residual Solution P4. Carefully place the Spin Filter in
a new clean 2 mL Collection and add 50 µL of Solution P5 to
the center of the white filter membrane and centrifuge for 30
seconds. The Spin Filter was discarded and DNA was
preserved.
Detection of the DNA produced
The samples extracted by the four different commercials
kits were evaluated for DNA concentration using the Qubit
fluorometer. The amount, average size and quality of the DNA
were further assessed using conventional electrophoresis in
agarose gels.
PCR-DGGE of 16S and 18S rDNA
Amplification of specific regions of the gene encoding the
Santos, H.F. et al. Microbial DNA from reef corals
performed in a solution containing 1X PCR buffer, 0.2 mM of
dNTP , 2.5 mM of MgCl2, 2.5 U of recombinant Taq DNA polymerase (Promega), 10 ng of total DNA, 200 µmol of each
primer and sterile Milli-Q water for a final volume of 50 µL. The
reaction was performed in a Mastercycler Gradient (Eppendorf,
Hamburg, Germany) under the following conditions: initial
denaturation at 94 ºC for 3 min, 35 cycles at 94 ºC for 1 min, 55 ºC
for 1 min and 72 ºC for 1 min with a final extension at 72 ºC for
10 min.
The DGGE gels (30 to 65% of urea and formamide) were
prepared with a solution of polyacrylamide (6%) in Tris-acetate
(pH 8.3). The run was performed in Tris-acetate-EDTA buffer at
60 ºC at a constant voltage of 75 V for 16 hours. The DGGE gels
were stained with Sybr Green (Molecular Probes) and visualized
using a Storm 860 Imaging System (GE Healthcare).
The amplification of specific fragments of the gene encoding
the 18S ribosome subunit of the microeukaryotes was performed
using the primers Ek7F-GC (3’ ACCTGGTTGATCCTGCCAG +
GC clamp 5’) and EK516R (3’ ACCAGACTTGCCCTCC5’)
[5,21,30] generating a product with about 500 bp. The
amplification was performed in a solution containing 1X PCR
buffer, 0.2 mM of dNTP, 2.0 mM of MgCl2, 0.75 U of
recombinant Taq DNA polymerase (Promega), 10 ng of total
DNA, 5 pmol of each primer and sterile Milli-Q water for a final
volume of 50 µl. The reaction was performed in a Mastercycler
Gradient (Eppendorf, Hamburg, Germany) under the following
conditions: initial denaturation at 94 ºC for 30 sec, 35 cycles at 94
ºC for 30 sec, 56 ºC for 45 sec and 72 ºC for 130 sec with a final
extension at 72 ºC for 7 min.
The amplicons were then separated by denaturing gradient
gel electrophoresis (DGGE). The run was performed as for the 16S
rDNA gene.
RESULTS
Isolation of DNA from coral samples by four different
techniques
We successfully obtained agarose gel-detectable DNA from
the coral samples using all four commercial DNA extraction kits.
Electrophoresis on agarose gels revealed that all DNA was
relatively large in size, estimated to range from 10-40 Kb (data not
shown). Per method, the replicates were consistent in both average
fragment size and quantity of DNA produced (Table 1). Overall,
there was no significant difference in average fragment size
between the different methods applied, which was 10-40 Kb in all
extracts. The concentrations of DNA in the preparations obtained
by the different methods (expressed as ng per g extracted coral
tissue), as measured by Qubit and confirmed by estimates on gel
were as follows: method Z, 3.7 ng/µL (1.1); method F, 1.2 ng/µL
(0.9); method P, 0.9 ng/µL (0.1) and method U, 0.9 ng/µL (1.3)
(Table 1). Furthermore, the triplicates of methods Z and
P showed a similar amount of DNA extracted from all
replicas, revealing consistency in the extraction procedure.
However, this was not seen when using methods U and F. In these
methods, the yields fluctuated more wildly.
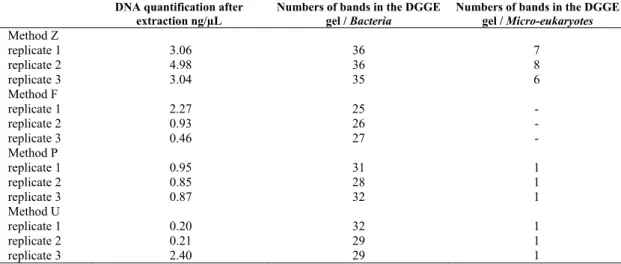
Table 1. DNA quantification after extraction and numbers of bands in the DGGE gel of Bacteria and Eukarya from coral Mussismilia harttii.
DNA quantification after extraction ng/µL
Numbers of bands in the DGGE gel / Bacteria
Numbers of bands in the DGGE gel / Micro-eukaryotes
Method Z
replicate 1 3.06 36 7
replicate 2 4.98 36 8
replicate 3 3.04 35 6
Method F
replicate 1 2.27 25 -
replicate 2 0.93 26 -
replicate 3 0.46 27 -
Method P
replicate 1 0.95 31 1
replicate 2 0.85 28 1
replicate 3 0.87 32 1
Method U
replicate 1 0.20 32 1
replicate 2 0.21 29 1
Concerning the yields, the amount of DNA extracted with
method Z was about three times higher than those with
methods F and P and about four times higher than the yield of
method U. Thus, method Z appears as a suitable method for
further exploration of the coral-associated (micro) biota.
PCR-DGGE analyses
Using both bacterial and micro-eukaryote primers, PCR
amplification was successful with the DNA obtained from all
samples. The amplicons were first checked on agarose gel to
assess their size and quantity. In all cases, we obtained
amplicons of the expected sizes, i.e. about 450 bp, in
considerable amounts. The mixed amplicons were then
separated by denaturing gradient gel electrophoresis (DGGE).
Bacteria: The amplicons generated from the
differently-extracted DNAs yielded diverse banding patterns on DGGE
(Fig. 1). These patterns were highly similar between the
replicates of DNA extracted with the same method, yet there
were clear differences between the patterns of DNA generated
from different methods. Thus, DNA extraction method clearly
affects observed the bacterial diversity in coral samples.
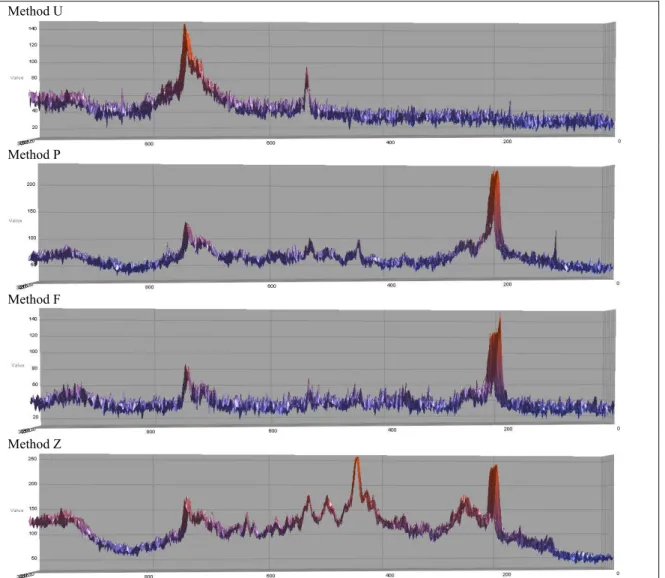
The bacterial PCR-DGGE profiles demonstrated that method
Z, compared to all the other extraction methods that were
tested, revealed a profile with more intense bands (Fig. 2 and
4) as well as a higher number of bands (Tab. 1). The method Z
showed an average of 35.6 bands (1.1), followed by method P
with 30.3 (2.0), method U with 30 (1.7) and method F with 26
(2.0). The number of DGGE bands of samples submitted to
method Z was about 37% higher than in method F. In terms of
evenness, the patterns generated by method P were closest to
those generated by method Z, but the number and intensity of
bands in the DGGE gels were lower (Fig. 2 and 4).
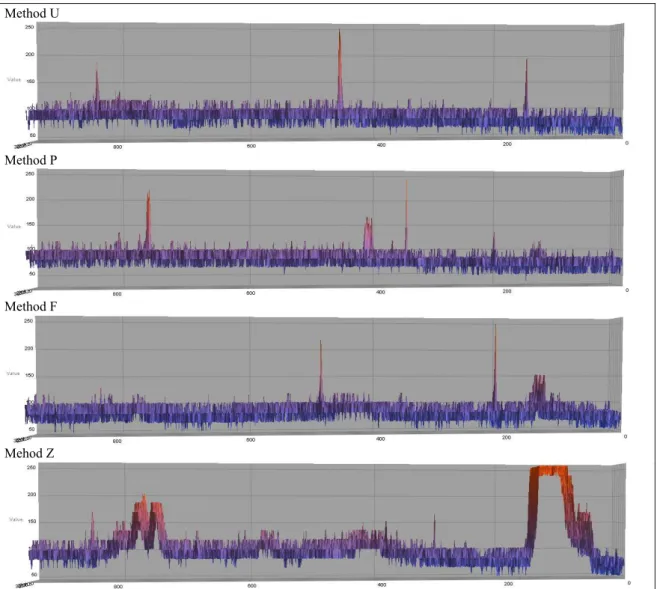
Micro-eukaryotes: The 18S rRNA gene yielded visible
banding patterns in most of the tested methods, except method
F (Fig. 3); in all cases, the replicates were quite consistent,
indicating consistency in the extraction procedure. However,
there were pronounced differences in the DGGE band profiles
between the different methods. As for the DGGE results of the
16S, the 18S profiles gave a higher number of bands and higher
intensities with DNA extracted by method Z compared to the
other methods (Fig. 3). Method Z showed 7, 8 and 6 bands in
the replicates 1, 2 and 3 respectively, while methods U and P
could only reveal one band in all replicates. As said earlier,
method F failed to give any band from all three replicates.
Figure 1. DGGE profiles of PCR-amplified SSU rRNA gene fragments of Bacteria. Triplicate samples were used. Clustering analysis was based
on Pearson’s correlation index and the unweighted pair-group method with arithmetic averages. Method F: FastDNA SPIN Kit for soil. Method
Santos, H.F. et al. Microbial DNA from reef corals
Method U
Method P
Method F
Method Z
Figure 2. Intensity of bands in the DGGE profiles of PCR-amplified SSU rRNA gene fragments of Bacteria evaluated by the program
BioNumerics.
Figure 3. DGGE profiles of PCR-amplified SSU rRNA gene fragments of Eukarya. Triplicate samples are used. Clustering analysis was based
on Pearson’s correlation index and the unweighted pair-group method with arithmetic averages. Method F: FastDNA SPIN Kit for soil. Method
Method U
Method P
Method F
Mehod Z
Figure 4. Intensity of bands in the DGGE profiles of PCR-amplified SSU rRNA gene fragments of Eukarya evaluated by the program
BioNumerics.
DISCUSSION
The use of molecular biology methods for the analysis of
microbial communities in environmental samples requires
efficient and reproducible strategies of DNA extraction. There
are many commercial kits for DNA extraction with different
methodologies (16). This study showed significant differences
in the efficiency of DNA extraction from coral samples with
four commercial kits tested, that have previously been used in
studies of coral microbiology (3, 5, 14, 18, 23, 25).
Different extraction methods may vary in terms of
efficiency, depending on the challenges posed by the physical
and chemical matrix of the sample. Consequently, the analysis
of microbial community diversity or the quantification of
specific genes is influenced by the DNA extraction method,
reflected in its efficiency (1, 15, 16). For instance, (12)
Inceoglu and colleagues (2010) tested four different methods of
DNA extraction from samples from three contrasting
agricultural soils. Molecular analyses (PCR-DGGE and clone
libraries) focusing on different microbial groups were used.
This study revealed that the DNA extraction method strongly
Santos, H.F. et al. Microbial DNA from reef corals
microbial community. Each extraction method tested revealed
differences in bacterial diversity, depending on the soil and the
target group. For example, one of the methods tested was
suitable for the extraction of Actinobacteria, even extracting
DNA of novel groups, which had not been detected by other
methods. Hu et al. 2010 (10), compared four different methods of DNA extraction from soil namely SDS-hyperhaline method
(I), modified SDS-hyperhaline method (II), indirect method
(III), alkaline lysis method (IV), and found that in this case and
in accordance with the approaches tested the method IV
showed better results both quantitatively and qualitatively.
In our study, we investigated the workability of different
DNA extraction methods on coral. Among the four kits tested,
method Z (Zr soil microbe short DNA kit protocol) was the
most efficient with respect to the amount of DNA that was
obtained from the coral. The DNA concentrations obtained in
the final extracts were significantly higher than those obtained
with the other protocols. Also, method Z was a fast protocol.
Methods F (Fast DNA SPIN kit for soil), U (UltraClean plant
DNA isolation kit) and P (PowerSoil DNA isolation kit)
yielded lower concentrations of DNA after extraction. The
advantage of the method Z is that it is designed to efficiently
extract DNA from soil with large amounts of humic matter. For
this reason, the method is based on a more elaborate
purification step, with the goal of eliminating the humic
material. Mahmoudi et al. (2011) (13) tested four commercial soil DNA extraction kits (UltraClean Soil DNA Isolation kit,
PowerSoil DNA Isolation kit, PowerMax Soil DNA Isolation
kit, and FastDNA SPIN kit) in PAH-contaminated soils. They
described that the FastDNA SPIN kit provided significantly
higher DNA yields for all soils; however, it also resulted in the
highest levels of humic acid contamination.
Another advantage of method Z was that it extracted
similar amount of DNA between replicates, in contrast to
methods P and F. This feature is extremely important, because
differential extraction from the same sample can generate false
differences between replicates inducing a bias in the
subsequent analyses.
The results obtained by PCR-DGGE analysis of the
coral-associated bacterial communities showed a clear influence of
the different extraction methods on the apparent bacterial
diversity and community composition. Method F, for example,
which has been used to obtain DNA from different types of
coral samples (3, 18), did not cover the bacterial diversity of
our sample with the same efficiency as methods Z, P and U,
generating a less rich band profile for Bacteria and failing to
detect any band on the DGGE of micro-Eukaryotes. Method Z,
besides having a larger amount of extracted DNA, revealed the
most intense bands in the DGGE gel from bacteria.
Furthermore, this method identified all bands present in other
methods and some bands were only detected by method Z.
Another important feature was related to the grouping of
replicates of the different methods tested. Method Z showed a
close grouping between replicates, which is a critical in studies
of microbial ecology.
The disparity between the kits tested in this study was
clearer when considering the results of the micro-eukaryotic
PCR-DGGE. Method F showed no bands in the DGGE gel
which can lead to an underestimation of the microbiota.
Methods U and P also showed lower efficiencies (fewer bands)
compared to method Z. Diversity and abundance of
microeukaryotes associated with coral might also be
underestimated using these methods.
Choosing the most appropriate method for DNA
extraction is very important, and one should be stimulated to
always pursue the visualization of the greatest diversity of
microorganisms in the sample. In spite of the fact that the Fast
DNA Spin kit for soil has been successfully used for other
samples (4, 8, 21, 22, 25), even when compared with other
strategies (1), it did not appear to be the best tool for the
analysis of coral-associated microbial communities.
Considering the comparative evaluation of the four methods
used in this study, we suggest that the Z method is most
ACKNOWLEDGEMENTS
This work was developed during the microbiology
specialization course of Brazilian Society of Microbiology
attended by researchers from the Biotechnology Section of
Petrobras Research Center, CENPES. Thus, we thank the
Brazilian Society of Microbiology and CENPES for the
financial support and Projeto Coral Vivo for logistical support
to this study, through its sponsorship from Petrobras and
Arraial d’Ajuda Eco Parque. The authors also thank CAPES,
CNPq (fellowships and Project 558372209/6) and FAPERJ for
fellowships and financial support.
REFERENCES
1. Ariefdjohan, M.W.; Savaiano, D.A.; Nakatsu, C.H. (2010). Comparison of DNA extraction kits for PCR-DGGE analysis of human intestinal microbial communities from fecal specimens. Nutr. J. 22, 9-23. 2. Bourne, D.G.; Garren, M.; Work, T.M.; Rosenberg, E.; Smith, G.W.;
Harvell, C.D. (2009). Microbial disease and the coral holobiont. Trends
Microbiol. 17, 554-562.
3. Castro, A.P.; Araújo, S.D.Jr.; Reis, A.M.; Moura, R.L.; Francini-Filh, R.B.; Pappas, G.Jr.; Rodrigues, T.B.; Thompson, F.L.; Krüger, R.H. (2010). Bacterial Community Associated with Healthy and Diseased Reef Coral Mussismilia hispida from Eastern Brazil. Microb. Ecol. 59 (4), 658-67.
4. Cury, J.C.; Araujo, F.V.; Coelho-Souza, S.A.; Peixoto, R.S.; Oliveira, J.A.L.; Santos, H.F.; Da´vila, A.M.R.; Rosado, A.S. (2011). Microbial Diversity of a Brazilian Coastal Region Influenced by an Upwelling System and Anthropogenic Activity. Plos One 6 (1) e16553.
5. Garren, M.; Raymundo, L.; Guest, J.; Harvell, C.D.; Azam, F. (2009). Resilience of Coral-Associated Bacterial Communities Exposed to Fish Farm Effluent. Plos One 4 (10) e7319.
6. Graham, N.A.J.; Nash, K.L.; Kool, J.T. (2011). Coral reef recovery dynamics in a changing world. Coral Reefs 30, 283–294.
7. Handelsman, J.; Tiedje, J.M.; Alvarez-Cohen, L.; Ashburner, M.; Cann, I.K.O.; Delong, E.F.; Doolittle, W.F.; Fraser-Liggett, C.M.; Godzik, A.; Gordon, J.I.; Riley, M.; Schmidt, T.M. (2007). The new science of metagenomics: Revealing the secrets of our microbial planet. Washington, DC: The Nat. Acad. Press.
8. Hardoim, C.C.P.; Costa, R.; Araújo, F.V.; Hajdu, E.; Peixoto, S.P.; Lins, U.; Rosado, A.S.; van Elsas, J.D. (2009). Diversity of Bacteria in the Marine Sponge Aplysina fulva in Brazilian Coastal Waters. Appl.
Environ. Microb. 75 (10), 3331–3343.
9. Heuer, H.; Smalla, K. (1997). Application of denaturing gradient gel electrophoresis (DGGE) and temperature gradient gel electrophoresis (TGGE) for studying soil microbial communities. In: Van Elsas, J.D.; Trevors, J.T.; Wellington, E.M.H. (eds). Modern Soil Microb. Marcel Dekker, Inc.: New York, pp 353–373.
10. Hu, Y.; Liu, Z.; Yan, J.; Qi, X.; Li, J.; Zhong, S.; Yu, J.; Liu, Q. (2010). A developed DNA extraction method for different soil samples. J. Basic Microbiol. 50 (4), 401-7.
11. Hughes, T.P.; Baird, H.A.; Bellwood, D.R.; Cartão, M.; Connolly, S.R.; Folke, C.; Grosberg, R.; Hoegh-Guldberg, O.; Jackson, J.B.C.; Kleypas, J.; Lough, J.M.; Marshall, P.; Nyström, M.; Palumbi, S.R.; Pandolfi, J.M.; Rosen, B.; Roughgarden, J. (2003). Climate Change, Human Impacts, and the Resilience of Coral Reefs. Science 301 (5635), 928-933. 12. Inceoglu, O.; Hoogwout, E.F.; Hill, P.; van Elsas, J.D. (2010). Effect of DNA extraction method on the apparent microbial diversity of soil. Appl.
Environ. Microbiol. 76 (10), 3378-3382.
13. Mahmoudi, N.; Slater, G.F.; Fulthorpe, R.R. (2011). Comparison of commercial DNA extraction kits for isolation and purification of bacterial and eukaryotic DNA from PAH-contaminated soils. Can. J.
Microbiol. 57 (8), 623-628.
14. Meron, D.; Atias, E.; Kruh, L.I.; Elifantz, H.; Minz, D.; Fine, M.; Banin, E. (2011). The impact of reduced pH on the microbial community of the coral Acropora eurystoma. ISME J. 5, 51–60.
15. Moberg, F.; Folke, C. (1999). Ecological goods and services of coral reef ecosystems. Ecol. Eco. 29, 215–233.
16. Park, J.W.; Crowley, D.E. (2005). Normalization of soil DNA extraction for accurate quantification of target genes by real-time PCR and DGGE.
BioTechniques (38), 579-586.
17. Porter, J.W.; Tougas, J.I. (2001). Reef ecosystems: threats to their biodiversity. In: Encyclopedia of Biodiversity, Levin, S.A. (eds.), San Diego: Academic Press, pp. 73-95.
18. Reis, A.M.; Araújo, S.D.Jr.; Moura, R.L.; Francini-Filho, R.B.; Pappas, G.Jr.; Coelho, A.M.; Krüger, R.H.; Thompson, F.L. (2009). Bacterial diversity associated with the Brazilian endemic reef coral Mussismilia braziliensis. J. Appl. Microbiol. 106 (4), 1378-87.
19. Rohwer, F.; Seguritan, V.; Azam, F.; Knowlton, N. (2002). Diversity and distribution of coral-associated bacteria. Mar. Ecol. Prog. Ser. 243, 1–10. 20. Rosenberg, E.; Koren, O.; Reshef, L.; Efrony, R.; Zilber-Rosenberg, I. (2007). The role of microorganisms in coral health, disease and evolution. Nat. Rev. Microbiol. 5, 355-362.
21. Santos, H.F.; Cury, J.C.; Carmo, F.L.; Rosado, A.S.; Peixoto, R.S. (2010). 18S rDNA Sequences from Microeukaryotes Reveal Oil Indicators in Mangrove Sediment. Plos One 5 ( 8) e12437.
Santos, H.F. et al. Microbial DNA from reef corals
Bacterial Proxies for Oil Pollution. Plos One 6 (3) e16943.
23. Sato, Y.; Willis, B.L.; Bourne, D.G. (2010). Successional changes in bacterial communities during the development of black band disease on the reef coral, Montipora hispida. ISME J. 4, 203-214
24. Teixeira, L.C.R.S.; Peixoto, R.S.; Cury, J.C.; Sul, W.J.; Pellizari, V.H.; Tiedje, J.D.; Rosado, A.S. (2010). Bacterial diversity in rhizosphere soil from Antarctic vascular plants of Admiralty Bay, maritime Antarctica.
ISME J. 4, 989-1001.
25. Wegley, L.; Edwards, R.; Rodriguez-Brito, B.; Liu, H.; Rohwer, F. (2007). Metagenomic analysis of the microbial community associated with the coral Porites astreoides. Environ. Microbiol. 9 (11), 2707–2719. 26. Wilkinson, C.; Souter, D. (2008). Status of Caribbean coral reefs after
bleaching and hurricanes in 2005. Global Coral Reef Monitoring
Network, and Reef and Rainforest Research Centre, Townsville.