RESEARCH ARTICLE
Electronic Tagging of Atlantic Bluefin Tuna
(Thunnus thynnus, L.) Reveals Habitat Use
and Behaviors in the Mediterranean Sea
Pablo Cermeño1,2‡
*, Gemma Quílez-Badia2‡, Andrés Ospina-Alvarez2,3, Susana
Sainz-Trápaga2, Andre M. Boustany1,4, Andy C. Seitz5,6, Sergi Tudela2, Barbara A. Block1
1Department of Biology, Stanford University, Hopkins Marine Station, Pacific Grove, California 93950, United States of America,2WWF Mediterranean Programme, Barcelona 08002, Spain,3Center for Marine Conservation & Department of Ecology, Biological sciences Faculty, Pontificia Universidad Católica de Chile, Santiago de Chile 6513677, Chile,4Nicholas School of the Environment, Duke University, Durham, North Carolina 27708, United States of America,5Tuna Research and Conservation Center, Monterey Bay Aquarium, Monterey, California 93940, United States of America,6School of Fisheries and Ocean Sciences, University of Alaska Fairbanks, Fairbanks, Alaska 99775, United States of America
‡These authors contributed equally to this work. *pcerme@gmail.com
Abstract
We analyzed the movements of Atlantic tuna (Thunnus thynnusL.) in the Mediterranean
Sea using data from 2 archival tags and 37 pop-up satellite archival tags (PAT). Bluefin tuna ranging in size from 12 to 248 kg were tagged on board recreational boats in the western Mediterranean and the Adriatic Sea between May and September during two different peri-ods (2000 to 2001 and 2008 to 2012). Although tuna migrations between the Mediterranean Sea and the Atlantic Ocean have been well reported, our results indicate that part of the bluefin tuna population remains in the Mediterranean basin for much of the year, revealing a more complex population structure. In this study we demonstrate links between the western Mediterranean, the Adriatic and the Gulf of Sidra (Libya) using over 4336 recorded days of location and behavior data from tagged bluefin tuna with a maximum track length of 394 days. We described the oceanographic preferences and horizontal behaviors during the spawning season for 4 adult bluefin tuna. We also analyzed the time series data that reveals the vertical behavior of one pop-up satellite tag recovered, which was attached to a 43.9 kg tuna. This fish displayed a unique diving pattern within 16 days of the spawning season, suggesting a use of the thermocline as a thermoregulatory mechanism compatible with spawning. The results obtained hereby confirm that the Mediterranean is clearly an impor-tant habitat for this species, not only as spawning ground, but also as an overwintering foraging ground.
OPEN ACCESS
Citation:Cermeño P, Quílez-Badia G, Ospina-Alvarez A, Sainz-Trápaga S, Boustany AM, Seitz AC, et al. (2015) Electronic Tagging of Atlantic Bluefin Tuna (Thunnus thynnus, L.) Reveals Habitat Use and Behaviors in the Mediterranean Sea. PLoS ONE 10 (2): e0116638. doi:10.1371/journal.pone.0116638
Academic Editor:Yan Ropert-Coudert, Institut Pluridisciplinaire Hubert Curien, FRANCE
Received:May 5, 2014
Accepted:December 11, 2014
Published:February 11, 2015
Copyright:© 2015 Cermeño et al. This is an open access article distributed under the terms of the
Creative Commons Attribution License, which permits unrestricted use, distribution, and reproduction in any medium, provided the original author and source are credited.
Data Availability Statement:All relevant data are within the paper and its Supporting Information files.
Introduction
Atlantic bluefin tuna are the largest members of the family Scombridae, with adult tuna reach-ing lengths of 3.31 m and a mass up to 725 kg [1]. The Atlantic bluefin tuna (Thunnus thynnus) has been a focus of marine fisheries research and a target of fishers since ancient times [2,3]. While sustainable fisheries for bluefin tuna have existed in the Mediterranean Sea for centuries, fishing mortality rates of this large predator escalated in recent decades [4]. This resulted in a sharp decline of the populations in the past four decades [5] and the risk of collapse of breeding populations both within the Gulf of Mexico and the Mediterranean Sea [6,7]. Improving fisher-ies models of Atlantic bluefin tuna population structure, migration patterns and habitat use is necessary, particularly on their spawning grounds where they are heavily exploited. Under-standing habitat utilization is critical for the design of more effective management measures.
The Atlantic bluefin tuna have two known spawning grounds where reproductively active adults and larvae have been consistently found, i.e. the Gulf of Mexico/Caribbean/Straits of Florida (hereafter referred to as Gulf of Mexico) and the Mediterranean Sea [8]. Spawning may occur in other regions in the western Atlantic but to date, larval specimens are few and are re-covered adjacent to known spawning regions [9]. The species has been managed by the Inter-national Commission for the Conservation of Atlantic Tuna (ICCAT) essentially as two populations, the western and the eastern populations with their respective breeding areas (Gulf of Mexico and the Mediterranean Sea), separated by the 45°W meridian [4]. Electronic tagging, otolith and genetic markers have shown that there is an extensive degree of mixing between distinct populations on the North Atlantic foraging grounds [10–14]. Genetic studies suggest there are at least three distinct populations throughout its geographical range [15–17] that most likely represents Gulf of Mexico, western Mediterranean and eastern Mediterranean populations.
Mature bluefin tuna of eastern origin undertake two types of migrations: movements into the Mediterranean Sea to spawn, which occurs during April and May [18], and a post-spawn-ing foragpost-spawn-ing migration to the North Atlantic Ocean, around the end of July and August [19– 21]. Studies based on electronic archival and pop-up satellite archival tags in the past decade have been instrumental in identifying the details of bluefin tuna movement patterns, vertical distributions, temperature preferences and feeding habits. Most of these studies, however, have been carried out in the western Atlantic Ocean [10–13,16,22–29] with over 2000 electronic tags having been deployed since the late 1990s. Interestingly, a significant number of Atlantic bluefin tuna archivally tagged in the western Atlantic, particularly in the coastal waters off North Carolina (eastern North America), displayed site directed fidelity to the western Medi-terranean spawning grounds. This has been hypothesized to indicate eastern origin fish make trans-Atlantic migrations as juveniles but return to Mediterranean oceanic regions for spawn-ing [13]. Only once has an Atlantic bluefin tuna tagged in the western Atlantic had a verified recapture to the east of the Adriatic Sea [12,13,26]. These fish presumably are spawned in the Mediterranean Sea, occupy the West Atlantic Ocean as juveniles presumably foraging on large schools of herring and menhaden, and then move back into the Mediterranean as they mature into spawners. Once spawning occurs electronic tagging has shown site directed fidelity to the western Mediterranean and western Atlantic [13].
Most of the Atlantic bluefin tuna tagging activity in the Mediterranean Sea has been based on conventional tags. These tags provide information on locations of release and recapture [30–33], and to date make up 10% of the more than 57,000 conventional tags on Atlantic blue-fin tuna released between 1940 and 2003 [33]. More recently, several studies involving elec-tronic bluefin tuna tagging have been carried out in the Mediterranean Sea. De Metrioet al. [20,21,34] tagged mature bluefin tuna in fishing traps and tuna farms with single-point pop-up
satellite tags (PST) providing limited results due to some early technical problems with the power output of the Argos satellite transmitters in these first generation tags. A study from ju-venile Atlantic bluefin tuna tagged with archival tags in a tuna farm in Croatia [35] focused on vertical movements of the fish in the central Mediterranean Sea. A more recent study, using early models of the pop up satellite archival tags (PAT), has confirmed the rapid migration of post-spawning adults from the western Mediterranean to the Atlantic [36]. Other studies have also recently highlighted the importance of the Mediterranean Sea habitats not only for spawn-ing but also as an ecological foragspawn-ing area significant durspawn-ing overwinterspawn-ing periods [37–42].
The spawning time for bluefin tuna occurs during June and July in the western and central Mediterranean Sea [18,30,43–47]. Frontal structures and anticyclonic gyres are associated to the spawning strategy of the mature fish in the Catalan Sea [48] and in the Balearic Archipelago [49,50]. In the Balearic Sea, high numbers of bluefin tuna larvae have been collected in tows often associated with waters with an oceanographic signature of Atlantic origin (i.e. Sea Surface Salinity (SSS) up to 37.2) or with areas where Atlantic and Mediterranean waters mix (i.e. SSS between 37.2 and 38); with warm surface waters, mostly ranging from 23.5 to 25°C [49,51,52]; and with geostrophic velocities ranging from 0.0168 to 0.37 m/s [49]. Bluefin tuna showed a preference for deep waters surrounding the Balearic Islands [49], and for Chlorophyll-a (Chl-a) concentrations ranging from 0.08 to 0.15 mg/m3in their Mediterranean spawning habitat [53]. A well-defined thermocline, preferably having a negative gradient of 3°C, has also been hypothesized to be important for spawning [54,55]. Consistent with this location is the arrival and recapture of western tagged bluefin tuna in the Mediterranean Sea in these regions [13].
In the western Atlantic, studies with electronic tags reveal bluefin tuna have a significant preference in the Gulf of Mexico during the spawning season for continental slope waters (i.e. 2800 to 3400 m), moderate sea surface temperatures (SST) around 24–25°C or 26–27°C, sur-face current speeds from 0.126 to 0.316 m/s, and low sursur-face Chl-a concentrations (0.10 to 0.16 mg/m3) [56]. Aggregation behavior is also evident in the tracks (a linearity index of 0.56 SD ± 0.13), and unique oscillatory diving behaviors has been described during the putative breeding phases in the Gulf of Mexico [12,25,56] and more recently, in the Mediterranean [36].
Following the recent studies that suggest extended residential behaviors of Atlantic bluefin tuna in the Mediterranean, the main objective of the present study was to better characterize the pattern for those individuals who remain residential in the Mediterranean even after spawning. To date there has been very little description of the diving behaviors or oceano-graphic preferences of the tuna in the Mediterranean Sea during the spawning period. Data on the migratory behaviors and other ecological features of the eastern Atlantic bluefin tuna tagged in the western and central Mediterranean were thus collected to be able to increase our knowledge on the how bluefin tuna utilize these habitats and the ecology within the Mediterra-nean all year round.
Materials and Methods
Electronic Tagging
analyzed in this study.
Year Pop-up ID Area Deployment position Deployment Date CFL (cm) Weight (kg) Pop-off position Pop-off Days at liberty Dart
2000 00–679 Corsica. France 41º19´N 09º17´E 9/9/2000 161 74.6 41º22´N 09º10´E 4/10/2000 25 Titanium
99–581 Corsica. France 41º19´N 09º18´E 10/9/2000 134 43 41º27´N 08º57´E 3/11/2000 54 Titanium
00–721 Corsica. France 41º18´N 09º18´E 10/9/2000 135 43.9 41º33´N 09º30´E 3/12/2000 84 Titanium
00–735 Corsica. France 41º18´N 09º15´E 14/9/2000 131 40.1 42º40´N 04º40´E 6/12/2000 83 Titanium
99–745 Corsica. France 41º19´N 09º18´E 14/9/2000 167 83.3 41º18´N 09º15´E 4/12/2000 81 Titanium
00–720 Corsica. France 41º19´N 09º18´E 14/9/2000 142 51.1 41º08´N 10º04´E 6/11/2000 53 Titanium
2001 00–699 Corsica. France 41º19´N 09º30´E 12/9/2001 143 52.2 41º18´N 09º15´E 5/5/2002 235 Titanium
00–731 Corsica. France 41º19´N 09º30´E 20/9/2001 152 62.8 41º18´N 09º15´E 5/1/2002 107 Titanium
00–725 Corsica. France 41º18´N 09º25´E 20/9/2001 140 49 41º18´N 09º15´E 18/11/2001 59 Titanium
99–716 Corsica. France 41º18´N 09º25´E 14/9/2000 137 45.9 41º17´N 09º23´E 6/12/2000 83 Titanium
2008 08A0398 Majorca, Spain 40º00´N 03º09´E 16/08/2008 - 100 37º88´N 01º74´E 15/10/2008 60 Umbrella
08A0391 Majorca, Spain 40º00´N 03º09´E 16/08/2008 - 150 35º88´N 00º49´E 19/12/2008 125 Umbrella
08A0393 Majorca, Spain 40º00´N 03 09´E 17/08/2008 - 150 38º96´N 00º21´E 26/10/2008 70 Umbrella
08A0405 Majorca, Spain 40º00´N 03º09´E 17/08/2008 - 50 40º26´N 04º29´E 29/10/2008 73 Umbrella
2009 08A0407 Majorca, Spain 40º01´N 03º01´E 14/08/2009 - 110 39º46´N 02º40´E 23/10/2009 70 Umbrella
08A0390 Majorca, Spain 40º01´N 03º01´E 15/08/2009 - 65 39º58´N 03º37´E 14/09/2009 30 Umbrella
08A0399 Roses, Spain 42º20´N 03º20'E 27/08/2009 160 73.2 38º09´N 14º00´E 7/12/2009 102 Umbrella
08A0385 Adriatic 42º48´N 14º35´E 13/09/2009 - 45 43º46´N 13º42´E 25/12/2009 103 Umbrella
08A0394 Adriatic 42º49´N 14º37´E 14/09/2009 132 41.1 30º38´N 19º02´E 5/3/2010 172 Titanium†
08A0409 Roses, Spain 42º23´N 03º20´E 4/9/2009 - 45 38º58´N 05º19´E 17/12/2009 104 Prince
2010 08A0403 Majorca, Spain 40º02’N 03º10´E 8/8/2010 190 122.8 38º16’N 07º01’E 25/09/2010 48 Titanium†
10P0049 Roses, Spain 42º15´N 03º40´E 1/9/2010 95 15.3 39º52’N 6º20´E 11/11/2010 71 Titanium†
10P0052 Roses, Spain 41º51´N 03º50´E 5/9/2010 96 15.7 37º48’N 9º27´E 2/11/2010 58 Titanium†
08A0390 Adriatic 42º55´N 14º14´E 13/09/2010 143 52.2 41º34’N 15º57’E 18/05/2011 247 Titanium†
08A0396 Adriatic 44º49 N 12º51'E 24/09/2010 153 64 42º34’N 15º49’E 20/03/2011 177 Titanium†
2011 10P0406 Adriatic 43º01'N 14º09'E 26/07/2011 155 66.6 40°55'N 18°05'E 2/9/2011 38 Titanium†
10P0400 Adriatic 43º01'N 14º09'E 26/07/2011 136 44.9 44°05'N 14°57'E 30/09/2011 66 Titanium†
10P0038 Adriatic 42°57’N 14°16’E 6/8/2011 125 34.8 40°40'N 01°16'E 5/4/2012 243 Titanium†
10P0401 Adriatic 42°56’N 14°17’E 6/8/2011 134 43 32°23’N 17°47'E 9/2/2012 187 Titanium†
08A0389 Majorca, Spain 40º03'N 3º08'E 12/8/2011 177 99.2 39°58'N 02°57'E 30/09/2011 49 Titanium†
10P0398* Moraira, Spain 39º06’N 0º29’E 29/05/2011 135 43.9 39°46'N 0°59'E 25/08/2011 88 Titanium†
10P0402* Roses, Spain 42º21'N 3º19'E 31/08/2011 144 53.4 37°48’N 10°36'E 30/06/2012 304 Titanium†
10P0546* Roses, Spain 42º20'N 3º09’E 1/9/2011 135 43.9 35°55'N 13°25'E 30/06/2012 303 Titanium†
10P0547 Roses, Spain 42º20'N 3º20'E 1/9/2011 149 59.1 40°55'N 04°59'E 29/09/2011 28 Umbrellax1
08A0388 Roses, Spain 42º20'N 3º20'E 1/9/2011 240 248.1 41°58'N 03°43'E 3/11/2011 63 Titanium†
09P0412 Llançà, Spain 42º20'N 3º20'E 3/9/2011 199 141.2 37°09'N 04°29'E 26/09/2011 23 Titanium†
2012 10P0648*+ Adriatic 43o03N 14o08'E 12/5/2012 135 43.9 43o17´N 16o4´E 7/11/2012 179 Titanium†
Notes:*Tags remained attached during the spawning season;
two darts were used to anchor the tag;
Habita
tUse
and
Behavio
rof
Tagged
Bluefin
in
the
Mediterranea
ONE
|DOI:10.137
1/journal.p
one.0116638
February
11,
seasons started in the month of May (at the earliest) and ended by September. Tagging times depended on the accessibility of recreational fishers to bluefin tuna.
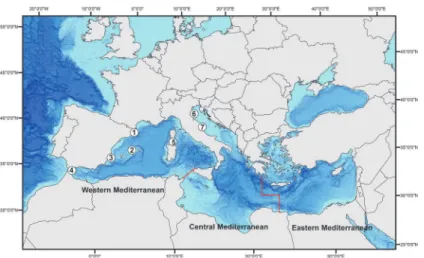
The research presented in this manuscript involved no endangered or protected species and no harm to the animals. The Stanford University Administrative Panel on Laboratory Animal Care research approved the protocol of the tagging operation in Corsica 2000 and 2001 (Proto-col Number: 10786). No special permission was required for the other years in any of the loca-tions as it was not required, however a special permit was granted by the Spanish Ministry "Agricultura, Alimentación y Medio Ambiente" for the 2011 tagging operations in Roses and Llançà (Table 1andFig. 1).
Bluefin tuna were caught using recreational rod and reel fishing. Most bluefin tuna, under 30 kg, were captured by trolling lures, while adults were caught chunking the water with sar-dines to attract them. From 2000 to 2001 and from 2010 to 2012, adult bluefin tuna were brought on-board using a lip hook placed in the most rostral position of the lower jaw and pulled from the water to a wet vinyl mat. In some cases, a plastic landing net was used. In 2008 and 2009 adult bluefin tuna were tagged in the water using an aluminum tagging pole with only one insertion point and tag anchor. Two types of darts were used during the tagging expe-ditions, a titanium dart and an umbrella plastic dart.
Bluefin tuna that were brought on board the vessel and had a soft cloth soaked in a fish slime replacement (PolyAqua, Novalek) placed over their eyes while a seawater hose oxygenat-ed their gills. A clip of the pectoral fin was kept for future genetic analyses, and curvoxygenat-ed fork length (CFL) was measured to the nearest 0.5 cm. CFL was transformed to fork length [57] and then to weight using the formula adopted by ICCAT for Mediterranean tuna (Arena
unpub-lishedcited in [58]). For those tuna tagged in the water a conservative estimation of the weight
was made by the tagging team.
Electronic tagging was conducted with Pop-up Satellite Archival Transmitting tags (PAT MK10 and in the last three years MiniPAT tags built by Wildlife Computers, Redmond Wash-ington). All satellite tags were placed on juveniles and adults in the base of the second dorsal fin. In addition, archival tags (MK9, Wildlife Computers), were surgically deployed in juvenile bluefin tunas considered too small for an external satellite tag.
A total of 92 electronic tags were deployed during the duration of this study: 62 pop-up sat-ellite tags and 30 archival tags. From the 62 pop-up satsat-ellite tags deployed, 37 (25 tags from 33 Fig 1. Numbers represent the different tagging locations (1. Roses/Llançà, 2. Pollença, 3. Moraira,
4. Algeciras, 5. Strait of Bonifacio, 6. San Benedetto del Tronto, and 7. Porto Barricata).Lines indicate the separation between the different Mediterranean basins based on FAO Fishing area criteria.
doi:10.1371/journal.pone.0116638.g001
total deployments of MK10 and 12 tags from 29 MiniPAT deployments) transmitted data and were at liberty for more than 22 days, which was the minimum time that we used to be includ-ed in this work (Table 1). Several dart types were used including titanium, umbrella and
“Prince”nylon darts, All darts were attached to the tag using a similar tether constructed of 130 kg monofilament and shrink-wrap. When bluefin tuna were brought on board the deck, a second attachment loop was used to prevent excessive motion of the pop-up satellite tag (ex-cept in the early 2000 and 2001 expeditions where only 1 dart was used, seeTable 1). This sec-ond anchor point was built with a titanium dart using 81.6 kg monofilament covered with a shrink wrap cover. Pop-up satellite archival tags were programmed to release from the tuna be-tween 150 and 300 days post deployment.
Pop-up satellite tags recorded pressure, light and water temperature every 60 seconds inter-val. In 2000 and 2001, for Corsica pop-up satellite tags, temperature and depth data were grouped in 24-hour binned histograms. Temperature layers were set at 6, 10, 12, 14, 16, 18, 20, 22, 24, 26, 28 and 60°C and depth layers (calculated from pressure) were -1, 5, 10, 50, 100, 150, 200, 250, 300, 500, 700 and over 1000 m. The 2008–2012 pop-up satellite tags were grouped in 6-, 12- or 24-hour binned histograms (for 2012, 2008 to 2010, and 2011 tags, respectively), and temperature layers were set at 3, 6, 9, 12, 15, 18, 21, 24, 27, 30, 33 and 45°C. In 2008 and 2009 depth layers data were set at 0, 10, 20, 50, 100, 150, 200, 300, 400, 500, 600, 700, 800, and over 800 m. From 2010 depth layers were set at 0, 2, 10, 20, 50, 100, 150, 250, 300, 400, 500, 2000 and over 2000 m. Pop-up satellite tag number # 10P0648 was returned by a fisherman, getting access to the 5-second interval archival record.
The 30 MK9 archival tags (i.e. 21 in 2008, 2 in 2009, 2 in 2010 and 5 in 2011) were surgically implanted in the peritoneal cavity of juvenile tuna and programmed to record pressure, light, external temperature and internal temperature every 60 s. To implant the archival tags, a 3–4 cm incision with a sterile surgical blade was carefully made in the ventral musculature of the tuna following the surgery methodology described in Boustanyet al. [59]. Tags were labeled in English, Spanish and Japanese to provide information on the reward for returning the tag. A conventional green external tag (Floy Tags) was also inserted close to the second dorsal fin to inform about the existence of an archival tag inside the tuna.
Bluefin tuna geolocations were estimated from light level and sea surface temperature data recorded by the tags. All tracks were processed by CLS using a tool based in state-space models (SSM). SSM’s constitute a robust statistical approach to refine satellite tracking data by ac-counting for observation errors and stochasticity in animal movement. The algorithm uses sea surface temperature and bottom topography data to better constrain the tracks. An ensemble Kalman filter is applied to solve for the trajectory, thus estimating the state vector and its co-variance from a set of samples rather than the usual deterministic equations [60–63]. The tags from the 2000–2001 expeditions were processed using a similar approach using custom algo-rithms as described in Teoet al. [64] and Blocket al. [65].
FAO’s Major Fishing areas in the Mediterranean were adopted to separate the different ba-sins [66] (Fig. 1).
Potential Spawning Behaviors Recorded by Electronic Tags
To determine the movements of the four tuna, we calculated the linearity index (LI) [67]. LI is the result of the linear distance between the endpoints divided by the path distance for each fish. The LI was calculated grouping the data every 5–6 days.
Time at Depth (TAD, i.e. daily average of the percentage of time spent at different depth bins set up) and Time at Temperature (TAT, i.e. daily average of the percentage of time spent at different temperature bins set up) during the spawning season were only calculated for the pop-up satellite archival tag # 10P0398, while # 10P0402 and # 10P0546 did not transmit this information.
The only pop-up satellite tag recovered from the four tuna showing potential spawning be-havior was from a presumed mature tuna tagged in the Adriatic (# 10P0648). The record pro-vided data in a time series every 5 seconds and was analyzed looking for unique behaviors potentially in association with spawning. Depth records<0 m were assumed to be zero and 12
bins limits, focusing on the first depth layers, were defined by 0, 2, 5, 10, 15, 20, 30, 40, 50, 70, 100, 200 and>200 m using Matlab (Mathwork, v 7.13.0.564). Following the methodology
de-scribed in Jorgensenet al. [68], we calculated a distance matrix based on a hierarchical cluster tree using an un-weighted average distance (UPGMA) linkage algorithm (‘linkage’function in Matlab) to differentiate dive behavior modes through the time at liberty based on the vertical distribution (‘pdist’function). Distance calculations were obtained using the‘City block’ mea-sure, where bin values<0.1 were assigned as zero to avoid outliers or rare events. Then, the
clusters were plotted along with a dendogram using the Matlab‘dendogram’function. Also IGOR Pro 6 (WaveMetrics) was used to show detailed behavior per day. Dive frequency was calculated identifying individual dives per day and grouped by season and cluster. A dive be-gins when the fish starts descending, and each dive includes a descent and an ascent. A dive ends when the fish starts to descent a second time, so every valley between two peaks is consid-ered a dive.
Bluefin tuna fishing operations
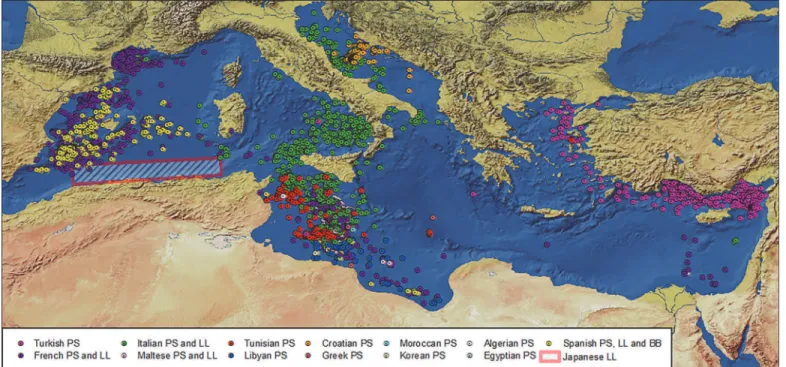
To better understand habitat utilization of the bluefin tuna released in the Mediterranean Sea and for comparison with the electronic tagging data, the precise locations of the bluefin tuna fishing operations that had occurred inside the Mediterranean Sea from 1989 to 2012 were ob-tained (Fishspectrum company), for the period April to August. The dataset included purse seiners, longliners and bait boats from Algeria, Croatia, Egypt, France, Greece, Italy, Korea, Libya, Malta, Morocco, Spain, Tunisia and Turkey. In total, 6031 locations were established. Additionally, we added to these locations the spatial distribution of the Japanese longliners’
total bluefin tuna catches in Algerian waters from 2000 to 2007 [69].
Oceanographic Analyses
Bluefin tuna tracks were analyzed in combination with available satellite oceanographic data, which provided information on the main oceanographic features in the Mediterranean Sea areas. The movement paths of the Atlantic bluefin tuna were overlaid on ocean bathymetry to visualize the association of the movements with the continental shelf and slope using a Global Self-consistent, Hierarchical, High-resolution Shoreline (GSHHS) database version 2.2. (http:// www.ngdc.noaa.gov/mgg/shorelines/data/gshhs) and ETOPO2 2-minute global bathymetry/ topography high-resolution database (http://rda.ucar.edu/datasets/ds759.3/).
The moderate resolution imaging spectroradiometer MODIS AQUA L3 satellite data (in-corporating standard atmospheric corrections) were acquired with a resolution of 1.2 km at high temporal frequency (http://oceancolor.gsfc.nasa.gov/DOCS/MODISA_processing.html). We used the global 8-day mean Nighttime Sea Surface Temperature (NSST) grids from
MODIS that had been validated (ftp://podaac.jpl.nasa.gov, thermal IR SST, 4 km and 0.1°C res-olution). Additionally, we obtained averaged weekly daytime measures of Chl-a concentration from MODIS databases. For each tag location, we extracted a Chl-a value. SSS and Geostrophic Velocity (UV) (zonal and meridional currents) data were downloaded from MyOcean [70]. The NSST, Chl-a, SSS and UV raw data were used as auxiliary environmental data.
Home range and habitat use
A utilization distribution (UD, [71]) was subsequently created from the satellite tracking using the‘adehabitat’package for R [72]. We used the default method for the estimation of the smoothing parameter, which supposes that the UD is bivariate normal. Under the utilization distribution model, we considered that the animals’use of space can be described by a bivariate probability density function, the UD, which gives the probability density to relocate the animal at any place according to the coordinates (x, y) of this place. The home range deduced from the UD as the minimum area on which the probability to relocate the animal is equal to a specified value. For example, the 95% home range corresponds to the smallest area on which the proba-bility to relocate the animal is equal to 0.95. Positions grouped by diving pattern (clusters) were represented using a Kernel density spatial analysis.
Statistical analyses for the oceanographic characteristics and the utilization areas were per-formed with the Statistics Toolbox in Matlab 8.0.0 (MATLAB 2011).
Results
The mean size of the Atlantic bluefin tuna released in the western Mediterranean Sea with pop-up satellite tags was 76.1 kg± 50.1 (SD). The bluefin tuna tagged in waters off eastern Spain and the Balearic Islands were on average 88 kg ± 58.7 (SD) and Corsica fish were 54.6 kg ± 14.4 (SD). In the Adriatic Sea, the size of tagged tuna was lower (49.1 kg ± 10.6 SD). Overall, the mean weight of the satellite tagged bluefin tuna was 69.5 kg ± 45.2 SD, and only 7 of the 37 tagged tuna analyzed during the study were over 100 kg (the average of these 7 large tuna was 146 kg, ± 49 SD).
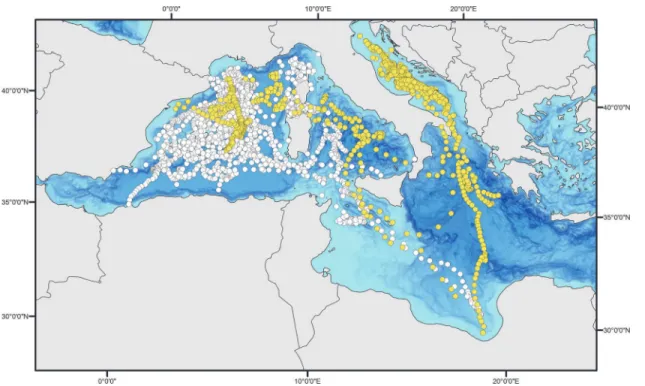
The mean retention time of the pop-up satellite archival tags from fish that reported more than 22 days (Table 1) was 81.5 ± 45.4 (SD) days when using single point attachment methods (N = 20). Bluefin tuna tagged on deck with the addition of a second attachment loop (N = 17) averaged 136.2 ± 96.1 (SD) days. Even though the retention time increased by using a second loop, only two of the pop-up satellite tagged fish with a second loop, remained attached until their programmed release date recording 303 and 304 days of data respectively (Table 1). All of the satellite tagged bluefin tuna remained within the Mediterranean Sea post release and throughout the track duration (Fig. 2). These western and central Mediterranean tagged bluefin tuna primarily resided within the basin they were released in, and none moved into the eastern Mediterranean basin.
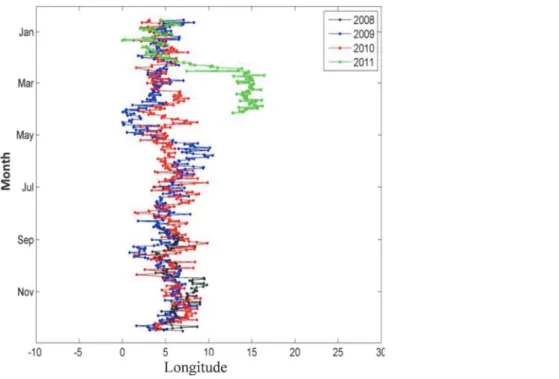
we were able to use the light level longitude record to establish the position and concluded this bluefin tuna did not leave the Mediterranean, nor did it visit the eastern Mediterranean. This bluefin inhabited waters between the 0 and the 18thmeridian east (Fig. 4).
In total, the 38 reporting electronic tags (including internal tag # 0890138) recorded 4336 days of location and behavior data on bluefin tuna behavior and habitat utilization within the Mediterranean Sea. Electronic tags deployed on Atlantic bluefin tuna in waters off eastern Spain (N = 18) recorded a total of 1669 days (average 92.7 ± 81.2 per track) and 391 days for the internally tagged juvenile released in eastern Spain. The Corsica deployments (N = 10, all MK10 pop-up satellite tags) generated 864 days of data (average 86.4 ± 57 days per track), while the tags deployed in the Adriatic Sea (N = 9) recorded 1412 days (average 156.9 ± 73.2 per track). Combining both the satellite and internal tagging data sets (including the internal tag # 0890152) revealed that none of the fish analyzed during the present study left the Medi-terranean Sea during the 23 to 964 days that they carried an electronic tag. The tagged bluefin tuna released in western or central Mediterranean locations stayed within these two basins, in some cases crossing between them, and never ventured into the Alboran Sea (the southwestern most area of the Mediterranean Sea, just before the Strait of Gibraltar) or the eastern
Mediterranean basin.
Fig 2. Daily positions based on estimated geolocation of the 38 tuna analyzed in this study and tagged within the Mediterranean Sea with pop-up satellite and archival tags.White circles represent the positions of the tuna tagged in the western Mediterranean basin (n = 28 pop-up tags + 1 internal tag), while yellow circles represent the positions of the tuna tagged in the Adriatic (n = 9 pop-up tags).
doi:10.1371/journal.pone.0116638.g002
Table 2. Deployment data and recapture information of the implanted internal tags deployed in 2008 in Roses, NE Spain.
Year Tag ID Area Deployment position Deployment date Weight (kg) Recapture Recapture position Days at liberty 2008 890138 Roses. Spain 41º56´N 03º36´E 31/08/2008 12,1 26/09/2009 41° 01´N 02° 45´E 391
2008 890152 Roses. Spain 41º56´N 03º36´E 31/08/2008 13 23/4/2011 37° 30´N 11° 30´E 965
doi:10.1371/journal.pone.0116638.t002
Habitat Use of Electronic Tagged Bluefin in the Mediterranean Sea
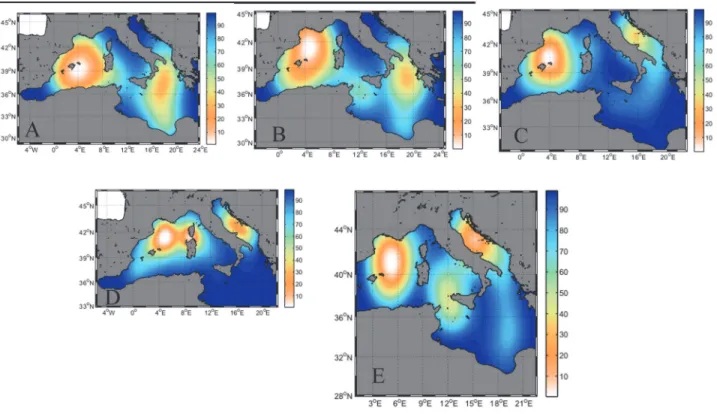
The seasonal analysis of the oceanic habitat use of the 38 tunas included in the analyses (Fig. 5) clearly showed the waters around the Balearic Islands and between the Ionian Sea and Libya are Fig 3. Daily positions for the 38 tuna analyzed in this study.Orange circles represent the internally tagged fish, while the white circles are the positions of the tunas tagged with pop-up satellite tags in both basins.
doi:10.1371/journal.pone.0116638.g003
Fig 4. Longitude for internal tag #0890152 by year.
of high importance. The waters around the southern part of the Balearic archipelago were key waters occupied during the putative spawning period (Fig. 5A). Moreover, the main overwinter-ing/feeding areas were identified as the waters south of the Gulf of Lions (Fig. 5B-5E) and the Adriatic Sea, primarily in this latter region the deeper waters of the Jabuka Pit (Fig. 5C-5E).
The trajectories of all the tagged tuna analyzed here, showed a distinct use of the basins within the Mediterranean (S1–S3Figs).
Adriatic
In total, 800 days of location and behavioral data (diving) were recorded inside the Adriatic Sea from the 9 pop-up satellite tags deployed there, 288 days in the western Mediterranean Sea basin (including the Tyrrhenian Sea), and 150 days in the Ionian Sea as well as in waters close to Libya. Geolocation position data demonstrated that tuna under 60 kg left the Adriatic Sea, while those over 60 kg (N = 2,Table 1) remained in the Adriatic Sea. The trajectories of these Adriatic Sea electronically tagged bluefin tuna show a distinct use of the regional basins within the Mediterranean Sea (S1 Fig.). Tuna tagged and released in the Adriatic Sea displayed an as-sociation with the waters over the bathymetrically deeper areas of this region, particularly the Jabuka Pit/Fossa di Pomo (i.e. mid-Adriatic) and the South Adriatic Pit, during all seasons. These fish showed a strong residency in these deeper bathymetry waters areas of the basin dur-ing all seasons except for sprdur-ing—when most tags had already detached—(Figs.2and5). Only two of these nine bluefin tuna left this central Mediterranean region towards the end of Sep-tember to venture into the western portion of the Mediterranean Sea (ID # 10P0038 and Fig 5. Seasonal Utilization Distributions (UDs) of bluefin tuna.The locations of the tuna were examined for the (A) spawning period (i.e. May 15 to July 15) and the seasonal periods of (B) spring, (C) summer, (D) autumn and (E) winter. UDs were computed using the Kernel method through the ad hoc method (h = Sigma*n^(-1/6), Sigma = 0.5*(sd(x)+sd(y))). The graphs show the UDs cumulative frequencies up to 95% (the color attributed to a given percentage p applies to areas comprised between p and p–1% isopleths).
doi:10.1371/journal.pone.0116638.g005
10P0401,S1.7andS1.8Figs.). These two fish, moved into the northwestern Mediterranean re-gions (in the vicinity of the Gulf of Lions), visiting the waters surrounding Corsica and Sardinia Islands on the way. After spending some time around Corsica and Sardinia and in the Tyrrhe-nian Sea, one of these individuals moved towards Libyan waters at the end of January where its satellite tag popped-off and reported on February 9—before the known spawning season. Two additional tuna tagged in the Adriatic Sea (ID #08A0394 and 08A0390,S1.2andS1.3Figs.) left the deployment area—although they remained within the central Mediterranean basin—and visited the Ionian Sea (between mid-March and beginning of May) and the Gulf of Sidra (from mid-January to the beginning of March) (Figs.3,5Band5E).
From the nine Adriatic tuna, only one was tagged before the spawning season (i.e. # 10P0648,Table 1andS1.9 Fig.). This fish left the Adriatic Sea towards the end of May, spent time in the Ionian Sea and in the waters south of Sicily, and came back to the Adriatic Sea around mid-August.
Western Mediterranean
Western Mediterranean electronic tagged adult tuna showed more fidelity to their deployment basin than the Adriatic ones (S2 Fig.). Even though the average of time at liberty of their de-ployments (i.e. 90.6 ± 72.4 (SD) days) limited the dispersion of the fish and could have biased the general view of their movements, overall, these tuna tended to concentrate in presumed feeding grounds (i.e. in the waters between the Gulf of Lions and the Balearic Islands) all year round (Figs.5Bto5E), and only one individual went through the Strait of Sicily (i.e. # 10P0546,
Table 1), reaching the Gulf of Sidra in June, during the known spawning season (Fig. 5A,S2.14 Fig.). A second tuna (i.e. # 10P0402,Table 1,S2.15 Fig.), was at the entrance of the Strait of Sicily when its tag released on its programmed day.
The two tuna with the longest duration of pop up satellite tag deployments (303 and 304 days, i.e. # 10P0546 and 10P0402, respectively), were deployed in Roses, NE Spain, and both occupied the aforementioned feeding area between the Gulf of Lions and the waters north of the Balearic Islands. This area is similar to that occupied by a bluefin tuna tagged in the Adri-atic Sea (i.e. # 10P0038,Table 1andS1.7Fig.). This regional hot spot occurs from November until March (Figs.2,5andS2.14andS2.15Figs.).
The juvenile Atlantic bluefin tuna tagged with an internal tag (# 0809138,Table 1) also dis-played a different behavior from the larger sub-adult and adult tuna occupying the southern waters of the western Mediterranean basin. From the end of autumn to the beginning of spring this tuna visited the Tyrrhenian Sea and crossed the Strait of Sicily. From there it returned to the Balearic spawning ground and spent the rest of spring and summer in the waters around the Balearic Islands, until it was recaptured at the end of September, after 391 days at liberty (Fig. 3,S2.19 Fig).
Corsican individuals (N = 10), in particular, showed a high fidelity to the Strait of Bonifacio and around the northern area of Corsica (Fig. 5d,S3 Fig.).
Bluefin Tuna Fishing Operations
Comparing the fishing operations’map with the trajectories and habitat use distributions of the 38 tags analyzed in the present study (Figs.3,5andS1–S3Figs.), it can be observed that the fisheries data and the tagging data overlap almost completely; putting aside the Gulf of Naples (Tyrrhenian Sea) and the Levantine Sea, which were never visited by the electronic tagged tunas. Taken together the two data sets provide the likely geographical distribution of the species pre-ferred habitats in the Mediterranean Sea and their potential foraging and reproductive hot spots.
Habitat Use and Behavior During the Spawning Season
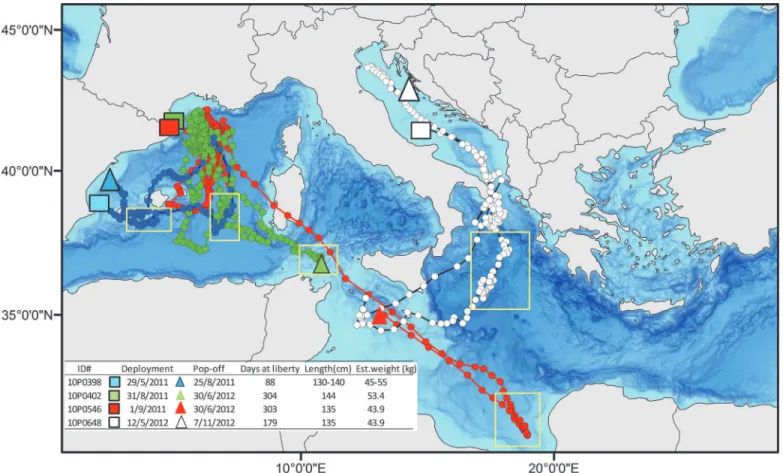
Atlantic bluefin tuna are known to spawn in the Gulf of Mexico and Mediterranean, which provides the first indications of the locations, oceanographic parameters and behavioral pat-terns observed during the spawning period (seeIntroduction). Based on prior electronic tag-ging in the western Atlantic and the Mediterranean, specific patterns, including aggregation behavior in positional data, a period of shallower mean depths from diving records, coupled to a unique oscillatory diving pattern, and warm ambient temperature ranges have been observed during the spawning seasons of both, the Gulf of Mexico and the Mediterranean [25,36,49,56]. Only four of the bluefin tuna in this study, were at liberty with their tags attached during the known Mediterranean spawning season and considered at this time by size to be potentially mature adults (tags # 10P0648, 10P0398, 10P0402 and 10P0546) (Fig. 7). Variance statistics of the daily estimated positions for the trajectories of these four tunas can be found inS1 Table.
This bluefin tuna with tag # 10P0648 (43.9 kg and 135 cm CFL) that potentially could be classified as a Mediterranean spawner, was tagged in the Adriatic Sea on May 12, 2012 (Fig 7). The fish left the Adriatic on the 25thof May, returning to it on September 9 after 107 days at large outside the Adriatic. The pop-up satellite tag was recovered after 179 days close to the coast of Croatia in November 2012. A full archival data record (pressure, temperature and light Fig 6. Locations of bluefin tuna fishing operations between April and August in the Mediterranean Sea from 1989 to 2012 (n = 6031) (different color dots), and spatial distribution of the Japanese longliners’total bluefin tuna catches in Algeria from 2000 to 2007 (based on Abdelhadiet al.,[69])
(red dotted line).PS = Purse seiners, LL = Longliners and BB = Bait boats.
doi:10.1371/journal.pone.0116638.g006
time series) was obtained with an interval of 5 seconds providing a high resolution time series. The linearity index (LI) score showed residency periods along the track in different areas of the Ionian Sea (Fig. 8). The first period of residency occurred from the 26thto the 31stof May just after leaving the Adriatic (LI 0.48 and SST 19.79°C SD ± 0.38), a second period of aggregation occurred from the 11thto the 15thof June (between Zakynthos Island, Greece, and the south-ernmost point of continental Italy), with a Linearity index of 0.51 and SST of 23.63°C (SD ± 0.26), followed by 15 consecutive days of low LI (0.58, 0.36 and 0.41 for the periods 21stto 25th, Fig 7. Tagged bluefin tuna possibly engaging in spawning during the reproductive season.Note: yellow squares indicate periods of time with low linearity values and possible spawning behavior.
doi:10.1371/journal.pone.0116638.g007
Fig 8. Linearity index for the four tags at liberty from mid-May to October.Green #10P0402, red #10P0398, black #10P0546 and blue #10P0648.
26thto 30thof June and 1stto 5thof July, respectively; while SST for the same periods was 25.64°C (SD ± 0.50), 26.19°C (SD ± 0.30) and 27.31°C (SD ± 0.19), respectively). The next resi-dent behavior period occurred in Tunisian waters late in July (LI of 0.23 and SST of 25.44°C (SD ± 0.61) for the 21stto the 25thof July). Average bathymetry for the waters occupied for the period of the 26thto the 31stof May was 1091.29 m (SD ± 126.50), while for the June periods and the first period of July the average was 3511.41 m (SD ± 120.23). The bathymetry shoaled during the residential event of the 21stto the 25thof July (413.28 m, SD ± 425.90).
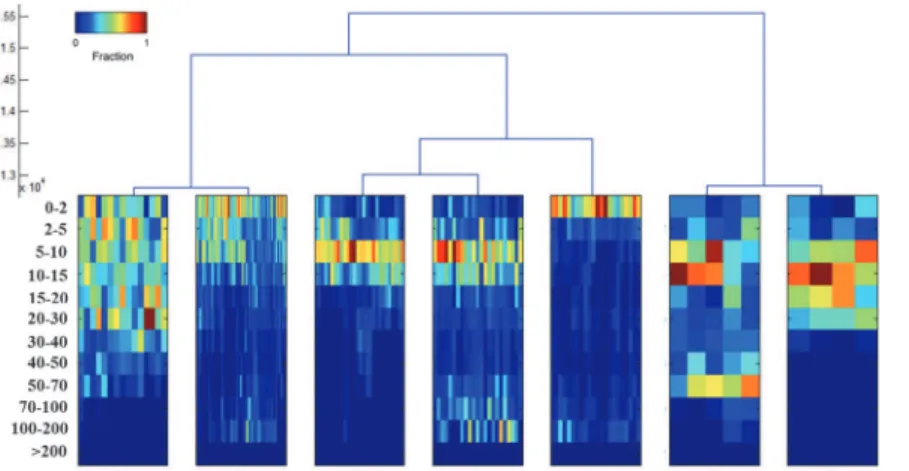
To examine the diving behavior and depth distribution of this fish (# 10P0648) in more de-tail we performed a cluster analysis. This revealed 7 types of diving behavior modes (Figs.9,
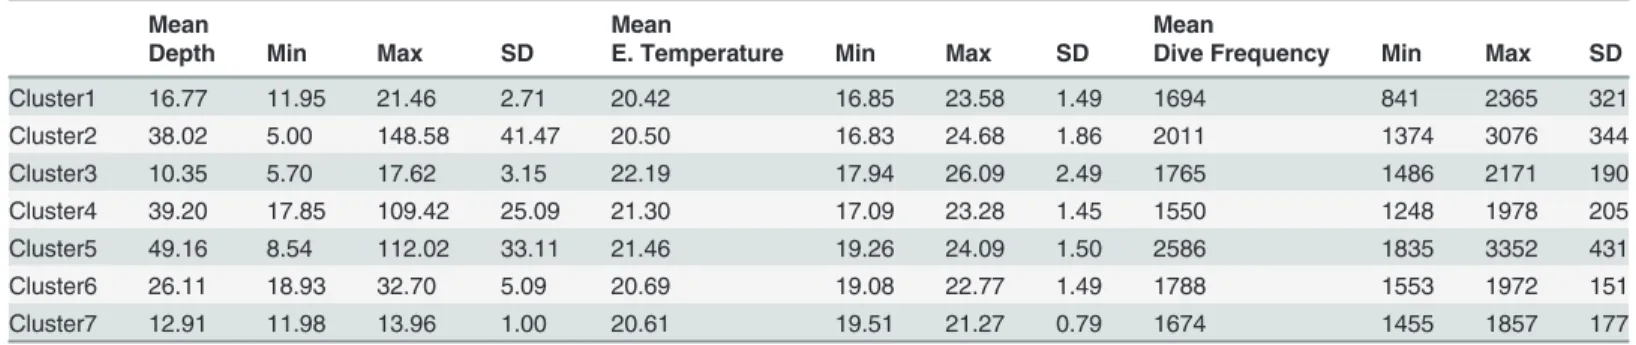
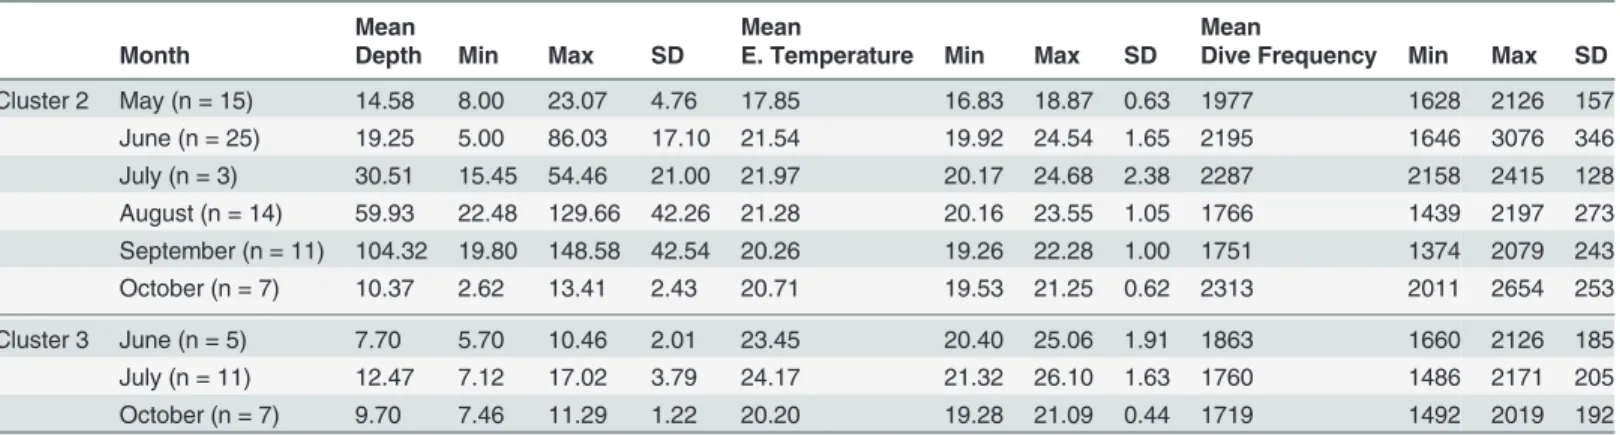
10AandTable 3). All 7 groups are described herein. The depth-bin histogram plot for cluster 2 (43.60% of the track) showed a higher preference of time in the surface waters, higher in use from the surface to 2 m and 5 to 10 m bins during the period from May to June (Fig. 10). Mean depth for cluster 2 for all days at liberty was 38.02 m (SD ± 41.47), while the average external temperature was 20.50°C (SD ± 1.86) and the dive frequency 2011 (SD ± 343). Maximum“U” -shaped dives down up to 300 m were observed in this cluster. The cluster 2 was predominant and mostly concentrated during June (14.53%) followed by May (8.72%), August (8.13%), Sep-tember (6.39%) and October (4.06%). The mean depth varied during the months during the described spawning season. Values ranged from 14.58 m (SD ± 4.76) in May, 19.25 m (SD ± 17.10) in June and 30.51 m (SD ± 21.00) in July, while it continued increasing from August to September (Table 4), where there was no bathymetry limitation, and decreased again from Sep-tember to October when moving through the North Adriatic basin where a shallower bathyme-try was evident. External temperature means recorded by the tag were 17.85°C (SD ± 0.63), in May, 21.54°C (SD ± 1.65), 21.97°C (SD ± 2.38) and 21.28°C (SD ± 1.05) for June, July and Au-gust (Table 3), maximum external temperature (24.68°C) was reached in July.
Cluster 3 pattern from this analyses corresponded to a high utilization of the water column comprised between 5 and 10 m with very few deep dives. Utilization of the surface waters (bins 0–2 m) was scarce. This behavior corresponded to the 16.20% of the entire track and was found in May (1.16%), June (2.9%), July (6.30%) and October (5.81%). Average depth of cluster 3 was 10.35 m (SD ± 3.15), external temperature 22.19°C (SD ± 2.49) and dive frequency 1765 (SD ± 190) (Table 3). June average depth was 7.70 m (SD ± 2.01), July 12.47 m (SD ± 3.79) and 9.70 m (SD ± 1.22) in October where the dive depths were bathymetrically constrained Fig 9. Dendrogram for tag #10P0648 determined from clustering analysis of differences in diving patterns Each column represents a 24-hours depth histogram (n = 175 days) and the color is the fraction of time.The density variable is expressed as a fraction of each day spent in depth bins defined along the y-axis.
doi:10.1371/journal.pone.0116638.g009
(Table 4). Cluster 4 (13.37%) showed a similar diving pattern on the first meters (0 to 15 m) as cluster 3 but showing increased residency between 100 and 200 m (Table 3). Cluster 5 (12.79%) corresponded to a surface behavior (bin 0 to 2 m) with occasional residency between 100–200 m. This behavior was found especially in the month of September around the South Adriatic Pit. Cluster 6 behavior (2.9%) was showed only during 5 days when visiting shallow waters (Table 3).
The last groups, cluster 1 (8.7%) and 7 (2.3%) mainly corresponded to the Adriatic basin (October) or other areas with a limited bathymetry, like the Tunisian basin (July). Here the shelf limits the diving of the tuna. The tuna exploited the entire water column in this region, Fig 10. (A). Positions of the different clusters along the track of the tuna 10P0648 (in Black cluster #1, green cluster #2, red cluster #3, blue cluster #4, yellow cluster #5, violet #6 and in white cluster #7).(B) Kernel distribution of cluster 2 and 3 during May, June and July. Number #1 compiled the period from 25th May to 5thJune, #2 from 7th to 14th June while #3 is for 17th to 30th of June.
doi:10.1371/journal.pone.0116638.g010
Table 3. Mean values, maximums, minimums and standard deviation for the clusters obtained.
Mean Mean Mean
Depth Min Max SD E. Temperature Min Max SD Dive Frequency Min Max SD
Cluster1 16.77 11.95 21.46 2.71 20.42 16.85 23.58 1.49 1694 841 2365 321
Cluster2 38.02 5.00 148.58 41.47 20.50 16.83 24.68 1.86 2011 1374 3076 344
Cluster3 10.35 5.70 17.62 3.15 22.19 17.94 26.09 2.49 1765 1486 2171 190
Cluster4 39.20 17.85 109.42 25.09 21.30 17.09 23.28 1.45 1550 1248 1978 205
Cluster5 49.16 8.54 112.02 33.11 21.46 19.26 24.09 1.50 2586 1835 3352 431
Cluster6 26.11 18.93 32.70 5.09 20.69 19.08 22.77 1.49 1788 1553 1972 151
Cluster7 12.91 11.98 13.96 1.00 20.61 19.51 21.27 0.79 1674 1455 1857 177
but cluster 1 primarily used the upper layers (0–5 m). Maximum depth bins observed were 100 to 200 m for cluster 1 and 30 to 40 m for cluster 7. The mean depth was 16.77 m (SD ± 2.71) and 12.91 m (SD ± 1.00) for clusters 1 and 7, while external temperature and dive frequency were 20.42°C (SD ± 1.49), 20.61°C (SD ± 0.79) and 1694 dives (SD ± 321) and 1674 dives (SD ± 177), respectively.
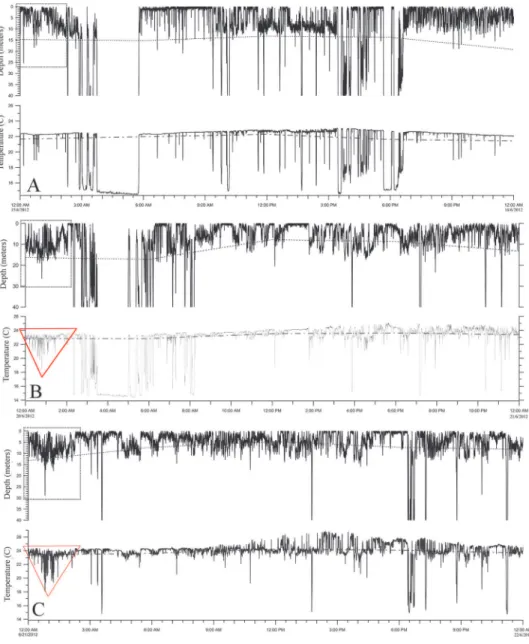
Clusters 2 and 3 for May, June and July were analyzed using Kernel density distribution showing hot-spot areas overlapping with low LI scores (Fig. 10B). These two clusters showed a distinctive diving pattern associated with remarkable use of the thermocline (Fig. 11) that was found only in June. This high oscillation dive patterns, comprised vertical movements between 0 and 30 m, dive signatures crossing the mixed layer are unique to these clusters. Depth in-creased in the middle of the event period and, as a result of these dives, a thermal footprint in the external temperature profile was left (normally as an inverted triangle Figs.11A and B). The thermal difference between the highest and the lowest temperature was between 2 and in some cases 6°C and these were detected only at night, from 11:15 pm to 2:30 am with duration between 60 to 120 min. This night diving behavior started on the 7thof June and lasted till the 3rdof July, but the thermocline was only used as described here in the period from the 11thto the 26thof June. For at least 3 days within this last mentioned period the tuna were not using the combination of high oscillation dives below the mixed layer (Fig. 11A).
The limitation of the data received from the other 3 bluefin tuna forced us to use different approaches to assess their behaviors. The second tuna with tag # 10P0398, which was tagged in Moraira, E Spain on May 29, 2011(43.9 kg and 135 cm) moved to the oceanographic area well known as a region of spawning in the Balearic Islands (Fig. 7). This tuna showed the lowest LI score of all the 4 tuna, indicative of a residency pattern in these waters situated south of Ma-jorca Island, Balearic Islands from the 16thto the 20thof June (LI 0.19). Then the tuna moved eastward and explored a small area between the Balearic Islands and Sardinia, Italy, from the 6thto the 10thof July (LI 0.59,Fig. 8). The mean SST estimated from the tag was 23.15°C (SD ± 0.47) during this June period, while the mean SST estimated in the July period was 24.92°C (SD ± 0.37). Time at temperature for the temperature range 21–24°C was 95.7% (SD ± 2.37) during the June period, and 85.95% (SD ± 14.93) for the temperature range 24–27°C during the July period. This indicates a clear preference for the temperature range 21–27°C, in accordance with what has previously been reported for preferences of tuna presumed spawning in the Bale-aric Sea [49,51,52]. The bathymetric depth estimated for those locations was 2351.91 m (SD ± 316.29) and 2862.92 m (SD ± 5.06), respectively. Time at depth for the depth range between surface and 20 m for those two periods was 80.16% (SD± 15.93) and 88.14% (SD ± 1.89), Table 4. Mean values, maximums, minimums and standard deviation for cluster 2 and 3 for all months when present.
Mean Mean Mean
Month Depth Min Max SD E. Temperature Min Max SD Dive Frequency Min Max SD
Cluster 2 May (n = 15) 14.58 8.00 23.07 4.76 17.85 16.83 18.87 0.63 1977 1628 2126 157
June (n = 25) 19.25 5.00 86.03 17.10 21.54 19.92 24.54 1.65 2195 1646 3076 346
July (n = 3) 30.51 15.45 54.46 21.00 21.97 20.17 24.68 2.38 2287 2158 2415 128
August (n = 14) 59.93 22.48 129.66 42.26 21.28 20.16 23.55 1.05 1766 1439 2197 273 September (n = 11) 104.32 19.80 148.58 42.54 20.26 19.26 22.28 1.00 1751 1374 2079 243
October (n = 7) 10.37 2.62 13.41 2.43 20.71 19.53 21.25 0.62 2313 2011 2654 253
Cluster 3 June (n = 5) 7.70 5.70 10.46 2.01 23.45 20.40 25.06 1.91 1863 1660 2126 185
July (n = 11) 12.47 7.12 17.02 3.79 24.17 21.32 26.10 1.63 1760 1486 2171 205
October (n = 7) 9.70 7.46 11.29 1.22 20.20 19.28 21.09 0.44 1719 1492 2019 192
doi:10.1371/journal.pone.0116638.t004
revealing a significant surface behavior pattern consistent with what is been reported previous-ly for tunas in spawning areas in the Gulf of Mexico [25,56]. The satellite images for these peri-ods show that the fish was in an area of mixing between Atlantic and Mediterranean waters (Fig. 12). Mean salinity for the first and second period was 37.38 ± 0.07 and 37.47 ± 0.03 re-spectively (Table 5).
Additional potential spawning fish were identified as tags numbered # 10P0402 and tag # 10P0546. Both bluefin tuna were tagged and released in Roses, NE Spain on August 31 and September 1 2011, respectively. They remained associated to the Gulf of Lions and N and NE Balearic Islands till early May and beginning of June 2012 when they migrated towards the cen-tral Mediterranean. For these tags the only data received was light levels and SST. Tuna with Fig 11. Depth and temperature profiles #10P0648.Dot line corresponds to mixed layer while a dashed line is the thermocline. (A) Cluster 2, the high oscillatory dives are present but do not break the mixed layer (16 June). (B) Cluster 2, high oscillatory dives going below the thermocline, followed by a“U”-shape dive (21
June). (C) Cluster 3 (consecutive day), same pattern but only a few“V”-shape dives during the rest of the day
(22 June).
Fig 12. Trajectory of tuna with tag ID # 10P0398(A) June 16 to June 20 (pink dot and triangle, respectively) and (B) July 6 to July 10 (pink dot and triangle, respectively) plotted with the mean Sea Surface Salinity (SSS) and the mean geostrophic velocity (UV) for those specific days.
doi:10.1371/journal.pone.0116638.g012
Table 5. Satellite oceanographic parameters for the 4 bluefin tuna (BFT) during the proposed spawning periods of tunas with tag ID # 10P0398, 10P0546, 10P0648 and 10P0402.
CHL-a NSST SSS UV
Tag ID Year Dates Mean STD Min Max Mean STD Min Max Mean STD Min Max Mean STD Min Max
10P0398 2011 16–20/6 0.0798 0.0120 0.0698 0.0929 22.7407 0.2068 22.5148 22.9121 37.3793 0.0711 37.2828 37.4679 0.1397 0.0492 0.0879 0.1982
2011 16–20/6 0.0829 0.0010 0.0816 0.0842 23.4162 0.0396 23.3611 23.4672 37.4702 0.0300 37.4327 37.5036 0.1001 0.0370 0.0580 0.1351
10P0402 2012 11–15/6 0.0407 0.0027 0.0384 0.0448 22.7262 0.1714 22.5851 22.9609 38.4328 0.0154 28.4110 38.4534 0.2613 0.0192 0.2373 0.2864
10P0648 2012 26–31/5 0.0869 0.0045 0.0824 0.0939 18.8995 0.2033 18.5897 19.2129 28.7977 0.0970 28.6009 38.8555 0.0488 0.0272 0.0172 0.0920
2012 11–15/6 0.0687 0.0049 0.0619 0.0751 22.8675 0.0525 22.8031 22.9423 38.9736 0.0236 38.9485 38.9970 0.0995 0.0533 0.0625 0.1914
2012 21/6 5/7 0.0687 0.0072 0.0588 0.0810 25.6082 1.1883 23.8509 27.4232 39.0079 0.0506 38.8468 39.0622 0.0785 0.0559 0.0248 0.2492
10P0546 2012 26–30/6 0.0884 0.0028 0.0857 0.0919 23.4932 0.1847 23.1804 23.6659 37.9308 0.1451 37.7703 38.0898 0.1955 0.1021 0.0943 0.3658
Average (±SD) and range of Chlorophyll-a (Chl-a), Night Sea Surface Temperature (NSST), Sea Surface Salinity (SSS) and Geostrophic Velocity (UV).
doi:10.1371/journal.pone.0116638.t005
Habita
tUse
and
Behavio
rof
Tagged
Bluefin
in
the
Mediterranea
ONE
|DOI:10.137
1/journal.p
one.0116638
February
11,
tag # 10P0402 started moving towards the central Mediterranean on the 2ndof June and popped-off on the programmed date. Towards the end of its trajectory (from the 26thto the 30thof June 2012), its LI score was 0.55 and at that time the fish was off the northern coast of Tunisia, at the entrance of the Strait of Sicily, after a track of c. 753 km in 28 days (Figs.7and
8). The mean SST estimated for this period was 24.02°C (SD ± 0.34), while the estimated mean bathymetry during those days was 369.26 m (SD ± 143.43).
Tag # 10P0546 left the western Mediterranean on the 9thof May and went straight toward the Gulf of Sidra, swimming c.1624 km in 29 days (LI 0.97, SD ± 0.02), where it remained from the 7thto the 20thof June, showing low LI scores from the 11thto 15thand from the 16thto the 20thof June (0.21 and 0.66, respectively (Fig. 8). The mean SST estimated from the tag was 23.35°C (SD ± 0.46) during the first period and 24.22°C (SD ± 0. 45) during the second, with an estimated mean bathymetry of 1048.04 m (SD ± 82.15) and 1199.72 m (SD ± 72.96), respec-tively. On the 21stof June the tuna left the area towards the W Mediterranean in a straight line (LI 0.99 (SD ± 0.00) till the 30thof June, when its tag popped-off, having swum about 610 km in 9 days (Figs.7and8).
Satellite Analyses
Satellite oceanographic observations were obtained (i.e. Chl-a, NSST, SSS and UV) for the loca-tions of the bluefin tunas (for tags # 10P0398, 10P0546, 10P0648 and10P0402) during the pos-sible period for potential spawning activity (Table 5). We found that for bluefin tuna #
10P0398 and # 10P0402 all oceanographic parameters examined were within the range of crite-ria described previously for the Balearic [49,51,52] and Gulf of Mexico [56] spawning grounds. For bluefin tuna # 10P0546 and # 10P0648, whose tracks were in the central Mediterranean, satellite observed values were slightly higher than the theoretical spawning range for Chl-a, NSST and Salinity, described for the western Mediterranean and Gulf of Mexico.
Discussion
Atlantic bluefin tuna are hypothesized to migrate to the Mediterranean Sea from the Atlantic Ocean during the months of April to May [18] to reproduce, and after spawning in the Medi-terranean they have been postulated to immediately initiate a migration out to the Atlantic Ocean to feed [19–21]. Even though this is a well-documented movement pattern in the litera-ture, the results herein reveal residency for long durations and are similar to the recent elec-tronic tagging efforts reported [38,41]. Together the electronic tagging studies indicate that some bluefin tuna are residential within the Mediterranean for much of the year. Of the 39 electronic tags analyzed (including internal tag # 089152), all tagged bluefin tuna remained in the Mediterranean Sea for up to a year post release.
Recent Mediterranean Sea electronic tagging studies, which did not cover the Balearic Sea region, also concluded that after spawning, individuals below 100 kg do not exit the Mediterra-nean, remaining to forage in areas of high primary production in the Mediterranean Sea. To date, from tagging experiments only those individual tunas over 150 kg demonstrate a pattern of migration into the NE Atlantic Ocean, implying a size dependency to a North Atlantic mi-gration [13,21,43,44]. In this study, although some of the tunas, which were tagged in the northern Balearic Islands, were over 150 kg in size these fish also displayed the residential be-haviors typical of the smaller tagged fish. These large bluefin occupied the northern Balearic waters until the thermocline broke down, at which point they started moving away from this region. This residential behavior was also observed for tuna below 100 kg in this study. It has been hypothesized that dispersal movements away from the hot spot region of residency could be related to the drop of water temperatures and the disintegration of the thermocline with
increased wind driven mixing around November [73]. Cooling of the water column and loss of the vertical structure may lead to less concentrated prey aggregations which may underlie the movements away from these areas as a reduction in prey availability may force bluefin tuna to move [74].
Two of the tagged tuna, deployed in waters off Roses (NE Spain), visited the Tyrrhenian Sea (bluefin tag # 08A0399 and 0809138). The first tagged fish had its tag pop off along the north-ern coast of Sicily at the beginning of December, while the second bluefin tuna spent Novem-ber, December and January there before crossing the Strait of Sicily. Our data also revealed a connection between a tuna tagged in the Adriatic Sea and the western Mediterranean Sea. One individual tuna also showed a lesser known connection between the Adriatic Sea and Libyan waters in winter. In addition, a direct link due to movements between the western Mediterra-nean Sea population and the Gulf of Sidra waters (Libya) was observed during the spawning season (bluefin tag # 10P0546). Similar types of directed movements were also found by Fro-mentin & Lopuszanski [41].
Bluefin tunas tagged and released in Corsica, on the other hand, remained highly residential in a reduced area between the waters off Corsica and Sardinia for the entire period of the track-ing time recorded (i.e. between 25 and 235 days), potentially suggestive of a forage aggregation for tunas. Moreover, the Algerian basin was also found to be an important foraging area for ju-venile tuna. Like all bluefin tuna in the present study, these fish did not cross over to the eastern Mediterranean basin. Rodríguez-Roda [75] reported that a 45 kg tuna which was conventional-ly tagged in May in Siciconventional-ly (Itaconventional-ly) appeared off the east Spanish coast in November. Similar re-sults were recently obtained with electronic tagged fish in recently reported work by De la Sernaet al. [38] who described results from 8 pop up satellite and 2 internal tags deployed in the same area and season as the present study. Moreover, Fromentin & Lopuszanski [41] also deployed 39 pop up satellite tags off Marseille (southern France) in autumn months and they reported an individual (>150 kg) that visited the Sidra spawning ground at the end of June—
in a similar fashion to the tuna with tag # 10P0546 in this study. Similarly, another tuna (ap-proximately 50 kg) whose tag popped off in the Tyrrhenian Sea (north of Sicily) in late April displayed similar behaviors to bluefin tuna with tag # 08A0399 in this study. Arandaet al. [36] confirmed the migration of presumably post-spawning adult bluefin tuna from the southern Balearic waters to the Atlantic Ocean after having conducted satellite tagging during the spawning season. Similar to this finding, two individuals (>150 kg) tagged with peritoneal
studies using similar techniques indicate that foraging as well as spawning may be a key driver of retentive behaviors in the Mediterranean for bluefin tuna.
Juvenile bluefin tuna tagged with internal tags that were at large for long durations in the present study (391 and 965 days post release), remained in the western Mediterranean. One in-ternally archival tagged fish displayed a short visit (bluefin tuna tag # 0809138,Fig. 3) to the central Mediterranean basin. Moreover, a long-term aggregation area associated with the Alge-rian Current system, between the Balearic Islands and the AlgeAlge-rian coast was found for at least one of the archival tagged juveniles (tag # 0809138,Fig. 3). Juvenile bluefin tuna tagged in No-vember in the Adriatic Sea displayed a residential behavior in the central Mediterranean, al-though one fish moved to the waters south of France after 7 months at liberty and another one visited the Ionian Sea, the Aegean Sea and Libyan waters [35,76]. These results suggest signifi-cant residency of juvenile bluefin tuna within the central Mediterranean Sea, consistent with the movements observed for the young adult tuna tagged in the same area in the present study.
Electronic tagging, otolith and genetic results have also shown that significant numbers of juvenile bluefin tuna of Mediterranean origin are migrating into the western Atlantic Ocean to forage [3,13,17,77]. Taken together, the electronic tagging data from all studies indicates there are multiple demographic units of bluefin tuna, mixing in the Mediterranean with distinct be-haviors, i.e. some migratory and some resident co- existing together, and mixing within these diverse oceanic regions. The hypothesis that there might be a co-occurrence of residential and migratory bluefin tunas in the Mediterranean has been proposed by many scientists previously (see review in Mather [8]), and even though the demographic relationships between tuna fol-lowing each pattern at a given time remains unknown, it appears as though electronic tagging is validating the overlap of these behaviorally distinct fish. However, caution must be taken due to the short duration of tracks which do not allow significant time for dispersion and demon-strate the need for longer studies, only achievable with internal tags to garner 1–4 year tracks that may shed light on the population structure. Genetic studies have demonstrated population structuring within the Mediterranean Sea [77]. Combining genetics (identification of popula-tion structure with fin clips) and archival tagging would be a way to move forward with resolv-ing the distinctive populations and their migratory trajectories.
Taking into account the weight distribution of bluefin tuna found (approximately 95% of large fish>100 kg) in the Strait of Gibraltar and Moroccan tuna traps during the spawning
mi-gration [42,78,79], and the fact that most of the captures outside the spawning season in differ-ent areas of the Mediterranean Sea are small to medium tuna—i.e. eastern Mediterranean [80], Tyrrhenian and Messina Strait [81], South Balearic Islands [82], Strait of Gibraltar [19] and Tunisia [83]-, and the experimental tagging results from various authors [13,26,36,84], we can postulate that part of the Mediterranean highly migratory population comes in as others have suggested from foraging grounds in the north Atlantic. These bluefin tunas, spawned in the Mediterranean Sea, migrate to the North Atlantic to spend their juvenile life phase in the At-lantic Ocean, and after reaching a minimum size of at least 200 cm CFL (i.e.>140 kg), migrate
back into the Mediterranean Sea to spawn. In addition, as demonstrated by Blocket al. [13], these North Atlantic foragers that spawn in the western Mediterranean, show multiple-year spawning fidelity after they return to the western Mediterranean, with multi-year entrances and exits for up to 4 consecutive years have been recorded on archival tags before their recap-ture. Blocket al. [13] documented that, when entering the Mediterranean, these types of Atlan-tic bluefin tuna are large in body size in comparison to reports of early maturing population of eastern Mediterranean spawners, used in ICCAT assessments [4]. This hypothesis of a highly migratory later maturing bluefin entering the western Mediterranean for spawning is sup-ported by the fact that the documented Mediterranean catches of larger tuna (>150 kg) only
data taken together indicate that both, residential populations of bluefin, and migratory popu-lations, overlap in the Mediterranean Sea. This should also be of importance to models of blue-fin that only use a single age to maturity for Mediterranean blueblue-fin given more than one population exists with distinctly different behaviors. Five of the 39 analyzed tunas in the pres-ent study were large fish (>100 kg), which obviously raises the question about where do they
fit in this Mediterranean Sea mosaic. Do these large residential tuna eventually become Atlantic migrants? Or do they always stay part of the resident population? Genetics and long duration tracks from archival or pop up satellite archival tags that are recovered will help establishing which population these particular tagged fish were from. Thus in the future, it is necessary to report a track with a genetic ID so that models incorporating such data know which population of fish they are assigning foraging locations and spawning areas to when modeling what these fish do [5].
Kernel density estimators were successfully used in several tracking studies to describe habi-tat use and to identify high use areas for marine animals [13,24,26,86,87]. The utilization distri-butions produced in the present study from the tracking data (Fig. 5) identified overwintering/ feeding areas in the waters south of the Gulf of Lions and the Adriatic Sea, primarily the deeper waters of the Jabuka Pit. The Gulf of Lions is known as one of the most productive areas of the Mediterranean Sea due to hydrographic features such as a wide shelf, strong vertical mixing in winter, coastal upwelling and river runoff [88]. The latest sardine and anchovy biomass assess-ments performed by the General Fisheries Commission for the Mediterranean Sea (GFCM) found that their combined biomass was nearly 1 million tons in the northern Adriatic area [89], accounting as one of the most productive regions in the Mediterranean Sea [90–92]. De la Sernaet al. [93] analyzed the stomach contents of bluefin tuna in the western Mediterranean and found that the main ingested species were sardine and anchovy (apart from a number of unidentified fish species, i.e. Teleostei spp.). Additionally, and supporting our results, Druon
et al. [53] detected the Gulf of Lions as potential feeding habitat in a model developed to map
potential Atlantic bluefin tuna feeding and spawning habitats in the Mediterranean Sea; while recently, Fromentin & Lopuszanski [41] suggested an overwintering area for adult tuna south of Marseille (France).
Moreover, our results have been found to be in good agreement with the map presenting the overall bluefin tuna fishing operations in the Mediterranean Sea from 1989 to 2012 (Fig. 6). The map provides a comprehensive set of data for fishing locations for the species, thus, it can be considered a robust proxy for tuna aggregations in the Mediterranean, particularly from April to August. Important aggregation areas in the Tyrrhenian Sea and in the eastern Mediter-ranean, which are evident from the map with the bluefin tuna fishing operation locations (Fig. 6), and are well-known [81,94–98] and references therein, for the Tyrrhenian Sea; and Karakulak and Oray [99] for the eastern Mediterranean—were not visited by the tuna tagged in this study during the spawning season (Fig. 2). No tags were deployed in these two regions, which could have led to these two gaps. Regarding the eastern Mediterranean, Karakulak and Oray [99] stated that a sub-population of bluefin tuna exists in the northern Levantine Sea, which is supported by tagging studies conducted in the eastern Mediterranean where tuna showed a tendency to remain in the Levantine Sea up to 36 days, the furthest one arriving to the Gulf of Laconia (Peloponnese, Greece) after 39 days, and the only fish in the study to visit the central Mediterranean [34].