Phenotypic- and Genotypic-Resistance
Detection for Adaptive Resistance
Management in
Tetranychus urticae
Koch
Deok Ho Kwon1*, Taek-Jun Kang2, Young Ho Kim1¤, Si Hyeock Lee1,3*
1Research Institute of Agriculture and Life Sciences, Seoul National University, Seoul 151–921, Republic of Korea,2Department of Horticultural Crop Research, National Institute of Horticultural and Herbal Science, RDA, Jeonju 565–852, Republic of Korea,3Department of Agricultural Biotechnology, Seoul National University, Seoul 151–921, Republic of Korea
¤ Current address: Department of Entomology, Kansas State University, Manhattan, Kansas, United States of America
*[email protected](DHK);[email protected](SHL)
Abstract
Rapid resistance detection is necessary for the adaptive management of acaricide-resistant populations ofTetranychus urticae. Detection of phenotypic and genotypic resistance was conducted by employing residual contact vial bioassay (RCV) and quantitative sequencing (QS) methods, respectively. RCV was useful for detecting the acaricide resistance levels of T.urticae, particularly for on-site resistance detection; however, it was only applicable for rapid-acting acaricides (12 out of 19 tested acaricides). QS was effective for determining the frequencies of resistance alleles on a population basis, which corresponded to 12 nonsynonymous point mutations associated with target-site resistance to five types of acari-cides [organophosphates (monocrotophos, pirimiphos-methyl, dimethoate and chlorpyri-fos), pyrethroids (fenpropathrin and bifenthrin), abamectin, bifenazate and etoxazole]. Most field-collected mites exhibited high levels of multiple resistance, as determined by RCV and QS data, suggesting the seriousness of their current acaricide resistance status in rose cul-tivation areas in Korea. The correlation analyses revealed moderate to high levels of posi-tive relationships between the resistance allele frequencies and the actual resistance levels in only five of the acaricides evaluated, which limits the general application of allele fre-quency as a direct indicator for estimating actual resistance levels. Nevertheless, the resis-tance allele frequency data alone allowed for the evaluation of the genetic resisresis-tance potential and background of test mite populations. The combined use of RCV and QS pro-vides basic information on resistance levels, which is essential for choosing appropriate acaricides for the management of resistantT.urticae.
OPEN ACCESS
Citation:Kwon DH, Kang T-J, Kim YH, Lee SH (2015) Phenotypic- and Genotypic-Resistance Detection for Adaptive Resistance Management in Tetranychus urticaeKoch. PLoS ONE 10(11): e0139934. doi:10.1371/journal.pone.0139934
Editor:John Vontas, University of Crete, GREECE
Received:June 8, 2015
Accepted:September 18, 2015
Published:November 6, 2015
Copyright:© 2015 Kwon et al. This is an open access article distributed under the terms of the Creative Commons Attribution License, which permits unrestricted use, distribution, and reproduction in any medium, provided the original author and source are credited.
Data Availability Statement:The raw data about RCV, validation between RCV with spray methods, and QS data can be downloaded from Figshare at http://dx.doi.org/10.6084/m9.figshare.1552038.
Funding:This work was supported by a grant from the Rural Development Administration (grant no. PJ009365) (http://www.rda.go.kr/). The funders had no role in study design, data collection and analysis, decision to publish, or preparation of the manuscript.
Introduction
Over 100 acaricides, classified into 14 groups based on their modes of action, have been devel-oped and registered for commercial use in the control of two-spotted spider mites,Tetranychus
urticae, on horticulture and agricultural crops worldwide [1]. However, theT.urticae
popula-tion has developed resistance to nearly all acaricides due to the mite’s short life cycle, high biotic potential and arrhenotokous reproduction [2].
In Korea, approximately 52 acaricides have been commercialized and intensively used to controlT.urticaeon various crops for 50 years, resulting in the rapid development of acaricide resistance in field populations [3]. Resistance management has mainly relied on the use of new acaricides with novel modes of action to control resistant populations. With the introduction of new acaricides, resistant mite populations were temporarily controlled. Soon after their con-tinuous use, however, mites developed additive resistance, resulting in populations having mul-tiple resistance mechanisms to different types of acaricides. Thus, a more systematic resistance management, based on the discrete selection and appropriate use of new acaricides, is urgently required to alleviate the serious resistance problems inT.urticae.
Generally, two strategies have been suggested for resistance management: preventative and adaptive management. Preventative resistance management includes several tactics, such as rotation, refuge and high-dose applications based on theoretical predictions [4], but these tac-tics are not employable in populations with high levels of multiple resistance. In the adaptive resistance management strategy, management actions are decided based on detailed informa-tion on the actual frequencies of resistance alleles [4]. In addition, this strategy requires addi-tional information on the heredity and fitness of resistance alleles [5]. Adaptive management enables the estimation of resistance levels for each pesticide and this is used to determine the most practical plan of count measure for resistant pest management. However, adaptive resis-tance management can only be realized after the establishment of sensitive monitoring and diagnostic tools to determine resistance levels or resistance allele frequencies.
Various resistance monitoring methods, such as the slide dip method [6], leaf dip method [6], whole-plant-residual bioassay [7], a practitioner-assessable bioassay [8], spray method [9,
10], and residual contact vial bioassay (RCV) [11], have been designed and are widely used to determine resistance levels. Among these, RCV was developed as a less technique-dependent bioassay that can be conveniently used by practitioners or farmers in the field for monitoring acaricide resistance [12]. In the initial report by Kwon et al. [11], it was demonstrated that RCV could discriminate the presence of resistance to abamectin and tebufenpyrad in field pop-ulations in 8 h. However, because the pre-determination of the diagnostic dose of each acari-cide is a prerequisite for the use of RCV, extended estimations of diagnostic doses for major acaricides currently used in the field are essential for the wider application of RCV in resistance monitoring.
As an alternative to the evaluation of phenotypic resistance levels based on traditional bioas-says, various molecular markers for resistance detection have been identified through extensive resistance mechanism studies. The recent completion ofT.urticaegenome analysis has greatly accelerated the identification of several genetic markers conferring resistance to new acaricides [13,14]. At present, several qualitative markers (nonsynonymous mutations) resulting in amino acid changes in the acaricide target proteins have been identified in the acetylcholines-terase (Tuace), voltage sensitive sodium channel (Tuvssc), glutamate-gated chloride channel
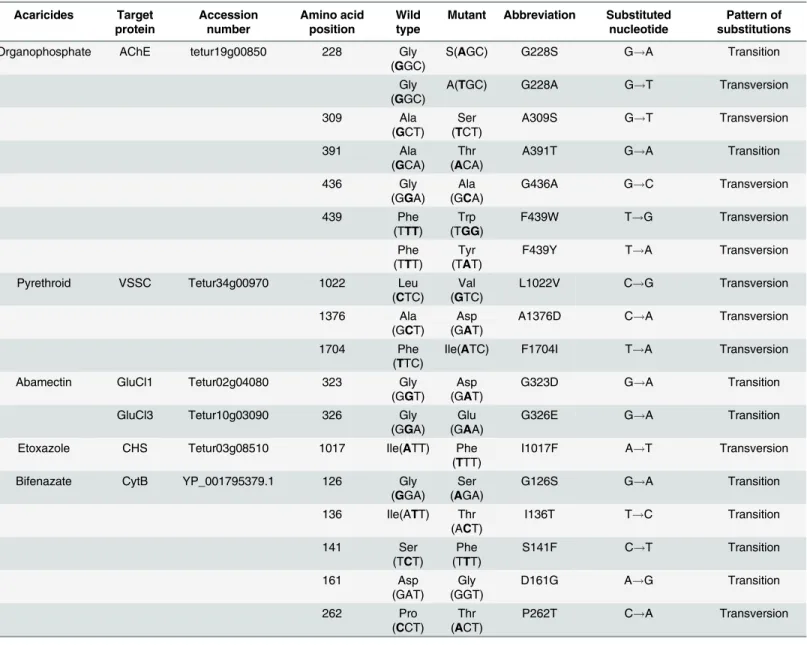
(TuGluCl), chitin synthase 1 (TuCHS) and cytochrome b (TuCytB) genes (Table 1) [15,16].
21]. Two point mutations (G323D and G326E) in two different types of glutamate-gated chlo-ride channels (GluCl1 and GluCl3, respectively) were identified to confer abamectin resistance [22,23]. A point mutation (I1017F) associated with etoxazole resistance was identified in
TuCHS[24]. Five point mutations (G126S, I136T, S141F, D161G and P262T) associated with
bifenazate resistance were found inTuCytB[25,26]. The role of each mutation in resistance has been suggested either by toxicity analysis or by crossing with susceptible strains.
Various PCR-based molecular detection techniques, including PASA (PCR Amplification of Specific Alleles) [27], bi-PASA [28], rt-PASA [29], real time PCR with allele specific TaqMan Probes [30], and Quantitative Sequencing (QS) [31] have been developed for the simple, rapid and accurate allele frequency estimation of point mutations conferring pesticide resistance in individual and population samples of pesticide-resistant mites and insects [32–36]. Among these, the quantitative sequencing (QS) method was determined to be efficient and cost-effective in
Table 1. Transition and transversion of point mutation associated acaricides resistance inTetranychus urticae. Acaricides Target protein Accession number Amino acid position Wild type
Mutant Abbreviation Substituted nucleotide
Pattern of substitutions
Organophosphate AChE tetur19g00850 228 Gly
(GGC)
S(AGC) G228S G!A Transition
Gly (GGC)
A(TGC) G228A G!T Transversion
309 Ala
(GCT) Ser (TCT)
A309S G!T Transversion
391 Ala
(GCA)
Thr (ACA)
A391T G!A Transition
436 Gly
(GGA) Ala (GCA)
G436A G!C Transversion
439 Phe
(TTT)
Trp (TGG)
F439W T!G Transversion
Phe (TTT)
Tyr (TAT)
F439Y T!A Transversion
Pyrethroid VSSC Tetur34g00970 1022 Leu
(CTC)
Val (GTC)
L1022V C!G Transversion
1376 Ala
(GCT)
Asp (GAT)
A1376D C!A Transversion
1704 Phe
(TTC)
Ile(ATC) F1704I T!A Transversion
Abamectin GluCl1 Tetur02g04080 323 Gly
(GGT)
Asp (GAT)
G323D G!A Transition
GluCl3 Tetur10g03090 326 Gly
(GGA) Glu (GAA)
G326E G!A Transition
Etoxazole CHS Tetur03g08510 1017 Ile(ATT) Phe
(TTT)
I1017F A!T Transversion
Bifenazate CytB YP_001795379.1 126 Gly
(GGA) Ser (AGA)
G126S G!A Transition
136 Ile(ATT) Thr (ACT)
I136T T!C Transition
141 Ser
(TCT)
Phe (TTT)
S141F C!T Transition
161 Asp
(GAT)
Gly (GGT)
D161G A!G Transition
262 Pro
(CCT)
Thr (ACT)
P262T C!A Transversion
simultaneously estimating the resistance allele frequencies in a large number of pooled genomic DNA samples ofT.urticae[25,37].
In this study, using basic resistance diagnostic tools for the implementation of an adaptive management system, we tested the performances of the RCV and QS methods in determining resistance levels and corresponding resistance allele frequencies, respectively, in 12 strains ofT.
urticae. The diagnostic doses for 12 acaricides were estimated for RCV. In addition, equations
for the frequency prediction of 12 point mutations associated with resistance to five different acaricide groups were established for QS. To determine how the bioassay data obtained by RCV and the resistance allele frequency data obtained by QS are related, thereby evaluating the applicability of each mutation allele as a resistance marker, we conducted correlation analyses for the data obtained from 12 strains ofT.urticae.
Materials and Methods
Acaricides
All acaricides were technical grade and were obtained from the following sources: fenothiocarb (99.8%, Sigma Aldrich, Saint Louis, Mo) monocrotophos (99.5%, Chem Service, West Chester, PA), omethoate (97.0%, Sigma Aldrich), endosulfan (99.4%, Sigma Aldrich), bifenthrin (99.0%, Sigma Aldrich), fenpropathrin (99.5%, Chem Service, West Chester, PA), Abamectin (97.6%, Sigma Aldrich), etoxazole (98.5%, Sigma Aldrich), fenbutatin oxide (97.7%, Sigma Aldrich), chlorfenapyr (99.6%, Sigma Aldrich), flufenoxuron (98.4%, Sigma Aldrich), amitraz (96.8%, Sigma Aldrich), pyridaben (99.7%, Sigma Aldrich), tebufenpyrad (99.8%, Sigma Aldrich), spiromesifen (99.8%, Sigma Aldrich), (EZ)-cyenopyrafen (97.3%, Sigma Aldrich), cyflumetofen (96.0%, Wako Pure Chemical Industries, Ltd., Japan), bifenazate (99.9%, Sigma Aldrich) and dicofol (97.2%, Sigma Aldrich).
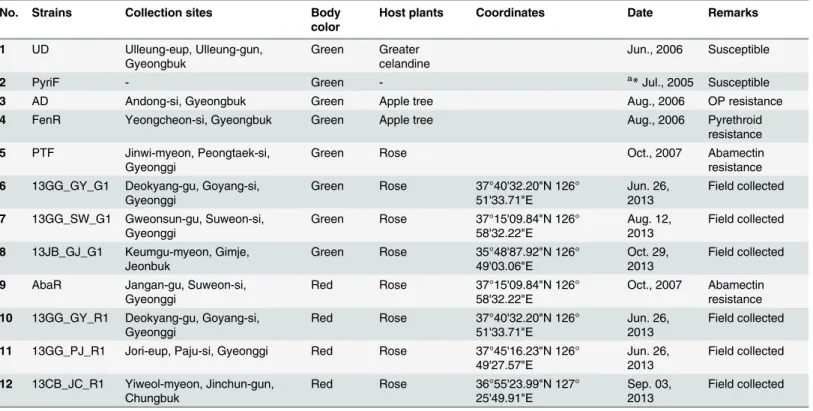
Mite strains and rearing conditions
A total of 12 strains were used in this study. Six strains (UD, PyriF, AD, FenR and AbaR) were maintained in an insectary for over eight years. The remaining six strains were initially col-lected as one of regular survey for pest monitoring on rose cultivation area supported by Rural Developmental Administration after getting owner’s permission in Korea in 2013 (Table 2). All mites were reared on kidney bean plants (2-wk old,Phaseolus vulgarisvarietyhumilis). All mite strains were maintained at 55±5% relative humidity (RH), a photoperiod of 16:8 (L:D) h and 25±1°C, except for the AbaR strain that was reared at 28±1°C.
Genomic DNA extraction
The genomic DNA was extracted from 50–100 females using the Qiagen DNeasy1
Blood & Tissue kit (Qiagen, GmBH, Germany) following the manufacturer’s instructions. Briefly, the mites were homogenized using pairs of disposable 1.5-ml polypropylene tubes and pestles (Bel-Art Scienceware, Wayne, NJ) with 100μl lysis buffer. The homogenate was incubated
with 100μg of proteinase K at 56°C for 1 h for lysis. The lysate was transferred to DNA binding
columns was centrifuged for 1 min and washed with 500μl washing buffer. The genomic DNA
in the DNA binding column was eluted with nuclease free water and stored at -20°C until use.
Species identification and construction of the phylogenetic tree
fragment (ca. 804-bp) and sequencing were conducted according to the methods of Kwon et al. [38]. A total of 63 partial mtCOI nucleotide sequences (598-bp) were aligned by CLUSTALW [39] and the empty block was completely removed using GBLOCK [40]. The best model was chosen as GTR+G+I using MEGA5.0 [41]. The fixed value of discrete Gamma distribution (+G) was 0.85 with 5 rate categories and the evolutionarily invariable (+I) was 0.48. The assumed values of transition/transversion bias were 2.05. The phylogenetic tree was con-structed with Maximum likelihood methods using PhyML 3.0 with the approximate likelihood ratio test method [42].
Determination of toxicity parameters and diagnostic doses for RCV and
leaf dipping
The toxicity parameters [median lethal dose (LD50) and LD90] were determined by RCV for 19
acaricides, based on the methods of Kwon et al. [11]. Briefly, 100μl aliquots of acaricide
solu-tions were dissolved in acetone at various concentrasolu-tions (0.3 ~ 1,000 ppm of stock solution converted to 1.8 × 10⁻³~ 6.1
μg-1cm2in 5-ml glass vials) and used to coat the inside walls of
5-ml glass vials (Taeshin Bio Science, Seoul, Korea) using a rolling wave rotator (Eberbach, Ann Arbor, MI) for 1 h under a fume hood. Mites (15–18) were placed in each vial and mortal-ity was determined at 8 h post-treatment with three replications. Any mites that were unable to move their bodies in 2–3 sec were considered dead. The LD50and LD90values were determined
by probit analysis using IBM SPSS statistics ver. 20.0 (IBM Corp., NY). The diagnostic dose (D/D) was arbitrarily designated as the two-fold dose of the LD90.
Table 2. Tetranychus urticaecollection sites.
No. Strains Collection sites Body color
Host plants Coordinates Date Remarks
1 UD Ulleung-eup, Ulleung-gun, Gyeongbuk
Green Greater celandine
Jun., 2006 Susceptible
2 PyriF - Green - a*Jul., 2005 Susceptible
3 AD Andong-si, Gyeongbuk Green Apple tree Aug., 2006 OP resistance
4 FenR Yeongcheon-si, Gyeongbuk Green Apple tree Aug., 2006 Pyrethroid
resistance 5 PTF Jinwi-myeon, Peongtaek-si,
Gyeonggi
Green Rose Oct., 2007 Abamectin
resistance 6 13GG_GY_G1 Deokyang-gu, Goyang-si,
Gyeonggi
Green Rose 37°40'32.20"N 126° 51'33.71"E
Jun. 26, 2013
Field collected
7 13GG_SW_G1 Gweonsun-gu, Suweon-si, Gyeonggi
Green Rose 37°15'09.84"N 126° 58'32.22"E
Aug. 12, 2013
Field collected
8 13JB_GJ_G1 Keumgu-myeon, Gimje, Jeonbuk
Green Rose 35°48'87.92"N 126° 49'03.06"E
Oct. 29, 2013
Field collected
9 AbaR Jangan-gu, Suweon-si, Gyeonggi
Red Rose 37°15'09.84"N 126° 58'32.22"E
Oct., 2007 Abamectin resistance 10 13GG_GY_R1 Deokyang-gu, Goyang-si,
Gyeonggi
Red Rose 37°40'32.20"N 126° 51'33.71"E
Jun. 26, 2013
Field collected
11 13GG_PJ_R1 Jori-eup, Paju-si, Gyeonggi Red Rose 37°45'16.23"N 126° 49'27.57"E
Jun. 26, 2013
Field collected
12 13CB_JC_R1 Yiweol-myeon, Jinchun-gun, Chungbuk
Red Rose 36°55'23.99"N 127° 25'49.91"E
Sep. 03, 2013
Field collected
a
Asterisk represents the date of acquisition from research institutions.
For etoxazole, the toxicity parameters and diagnostic dose were determined using the leaf dipping method of Lee et al. [43] with a slight modification. Briefly, a soybean leaf disc (30-mm diameter) was placed on a water-soaked cotton pad and 40–70 females were allowed to oviposit eggs on the leaf disc for 5 h at 28°C. The working solution of etoxazole was prepared by dissolv-ing technical grade etoxazole (98.5%, Sigma Aldrich) and further dilutdissolv-ing with water contain-ing 0.01% Triton 100 (0.003 ~ 0.05 ppm final). For control treatment, the 0.01% Triton X-100 solution without etoxazole was used. After removing the females, the leaf disc with eggs was soaked in the etoxazole solution for 10 sec and dried under a fume hood for 1 h. The etoxa-zole-treated leaf was incubated at 24°C on the water-soaked cotton. The mortality was deter-mined at 6~7 days post-treatment and any eggs not hatched were considered dead. The determination of the LC50, LC90and diagnostic concentration (D/C) was based on the same
method described above.
Spray bioassay with recommended concentrations and comparison of
their toxicity with those of RCV
For the spray bioassay, six laboratory strains (UD, PyriF, AD, FenR, PTF and AbaR) were inde-pendently treated with recommended concentrations of six commercial acaricides (monocro-tophos—240 ppm, Dongbu Farm Hannong, Korea; fenpropathrin—50 ppm, Dongbangagro, Korea; abamectin—6.03 ppm, Syngenta, Korea; tebufenpyrad—25 ppm, Syngenta, Korea; cyflumetofen—100 ppm, Dongbangagro, Korea; and bifenazate—120 ppm, Syngenta, Korea). Each acaricide was diluted with water to the recommended concentration following manufac-turer’s instruction. The spray was conducted according to the previous method with slight modifications [44]. The leaf disc (2.5-cm diameter) was placed on the top of water-soaked cot-ton pad and 9–22 female adults (17.5 females on average) were infested. Each acaricide solution was sprayed 30 times to the leaf disc with mites using a mini spray (Dongbang Plastic, Seoul, South Korea) apart from 40–50 cm. The residual acaricide solution was completely dried under a fume hood for 30–60 min. The mite that did not move the distance of its body size after prod-ding was considered as dead. Each experiment was conducted with three replications and mor-tality was determined at 24 h after treatment. The resulting mortalities from six mite strains were correlated with those obtained by RCV with the diagnostic doses.
Establishment of QS protocols
Four QS linear regressions (G228S and F439W inTuace, L1022V inTuvssc, and G323D in
TuGluCl1), to determine the organophosphate, pyrethroid and abamectin acaricide resistance
allele frequencies, were established in previous studies [35,45]. Additional QS regression equa-tions were established to predict the frequencies of various mutaequa-tions (A1376D and F1704I in
Tuvssc; G326E inTuGluCl3; I1017F inTuCHS1; and G126S and P262T inTuCytB). Briefly, the
partial genomic fragment (390 ~ 1200-bp) of a target gene fragment containing either the sus-ceptible or resistant allele was amplified with 250μM dNTPs, 5μM primers (S2 Table), 5μl
gDNA template and 1 unit of GenAll Taq DNA polymerase (GeneAll Biotechnology Co., Ltd., Korea) in a 20μl reaction following a thermal cycler program of 35 cycles of 94°C/30 s,
0:10, 1:9, 3:7, 5:5, 7:3, 9:1, and 0:10 (resistant allele: susceptible allele at each mutation site). All other procedures for the construction of the QS protocol were the same as those reported previ-ously [35,45]. The sequences of the resulting PCR products were analyzed by nested primers listed inS2 Table.
Statistical analysis
The correlation analysis between the RCV mortality data vs. spray mortality data and the RCV mortality data vs. QS resistance allele frequency data were determined by Spearman correlation using IBM SPSS Statistics software (SPSS, Inc., Chicago, IL). A heat map and correlation matrix were drawn using R [46].
Results
Haplotype composition of the Korean population of
T
.
urticae
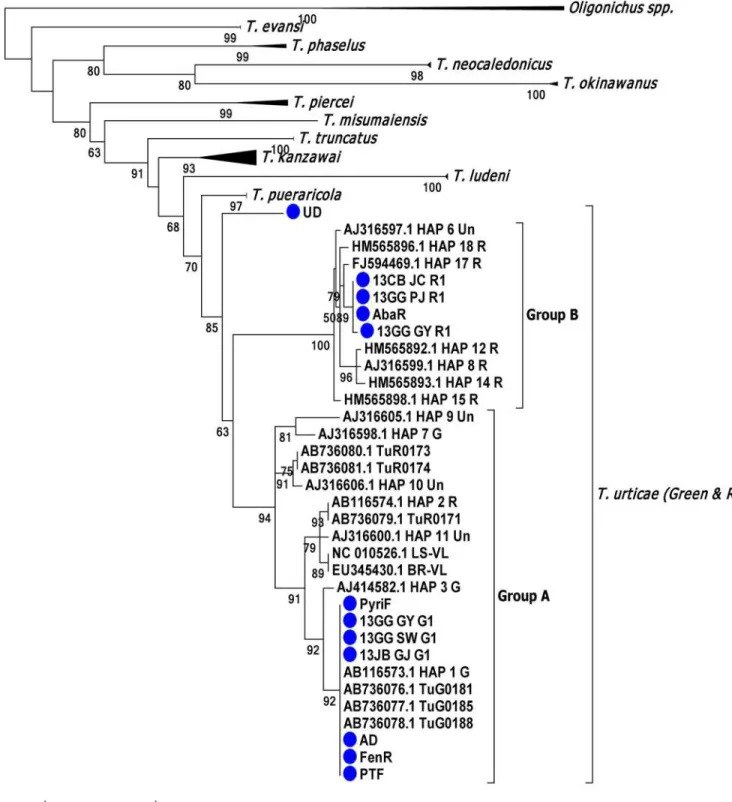
The phylogenetic relationships of 12 Korean strains were analyzed along with other several Tetranychidae species (S1 Table). The testedT.urticaestrains were largely divided into two groups (groups A and B, comprising red- and green-type mites) (Fig 1). Group A was com-monly composed of both red- (AB736079.1 TuR0171, AB736080.1 TuR0173, AB736081.1 TuR0174 and AB116574.1 HAP 2R) and green-type mites, whereas Group B was only com-posed of red-type mites. Among the 12 Korean strains tested, seven strains (PyriF, AD, FenR, PTF, 13GG_GY_G1, 13GG_SW_G1 and 13JB_GJ_G1) were clustered within‘haplotype 1’
(previously defined by [47]) as group A, known as the major green-type mites (Fig 1). Four strains (13CB_JC_R1, 13GG_PJ_R1, 13GG_GY_R1 and AbaR) were closely clustered with haplotype 17 (previously defined by [47]) as group B, known as red-type mites (Fig 1). As a result, both the green-type mites belonging to haplotype 1 and the red-type mites closely related with haplotype 17 were mainly distributed in the greenhouse rose cultivation areas in Korea.
Determination of the diagnostic dose for RCV
The toxicity parameters for 18 acaricides belonging to 14 representative groups were deter-mined using the RCV method with PyriF as a reference acaricide-susceptible strain. Although the UD strain exhibited higher susceptibility to all tested acaricides, it was not used as a refer-ence susceptible strain because of its distant genetic background as evidrefer-enced from the phylo-genetic analysis (Fig 1) [38]. The LD50values of the PyriF strain for the 18 acaricides ranged
from 2 × 10⁻³to over 6.1
μg-1cm2at 8 h post-treatment (Table 3). Both abamectin and
chlorfe-napyr showed the highest efficacy according to their LD50values (approximately 2 × 10⁻³
μg-1cm2). In contrast, the chitin synthase inhibitors, etoxazole and flufenoxuron, showed the
lowest efficacy with LD50values over 6.1μg-1cm2. In general, the acaricides with neurotoxic
modes of action showed a rapid contact toxicity even at relatively low doses, while acaricides with growth regulator activity (i.e., as chitin synthase inhibitors working on immature stages) or metabolic toxicity revealed a relatively slow toxicity (Table 3).
The LC98 or 99or LD98 or 99value has been suggested as a diagnostic dose that can kill all or
nearly all susceptible individuals but few or no resistant individuals [48,49]. However, as it is sometimes estimated by extrapolation of log-dose probit lines, such a value is prone to predic-tion error [48]. With this in mind, the diagnostic dose was arbitrarily set as a value two-fold greater than the LD90, which exhibited a significantly narrower range of the 95% confidence
interval than LD99(data not shown). The diagnostic doses for the 18 tested acaricides ranged
Fig 1. Phylogenetic tree ofTetranychusmites based on mtCOI partial sequences.TwoOligonychus spp. were used as outgroups. A maximum likelihood test was conducted and a bootstrap value over 50% is shown. The Korean populations are designated with blue circles.
toxicity were chosen for evaluating their efficacy against the 12 mite populations (Table 3). In the case of etoxazole, the resulting diagnostic dose was too high (over 3.05μg-1cm2,
corre-sponding 500 ppm in 100μl) to form a viscous film over the inner surface of the treated vial,
which trapped the infested mites. Therefore, RCV could not be employed and the efficacy of etoxazole was determined using the leaf-dipping method.
Evaluation of acaricide susceptibility using RCV and the selection of
appropriate acaricides
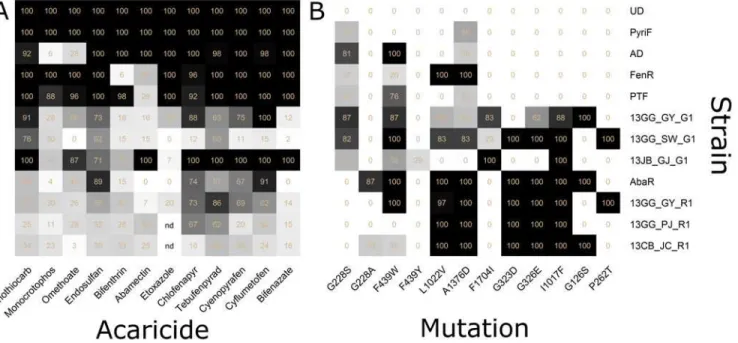
Mortalities of 12 mite populations were determined using diagnostic doses of 12 acaricides. The UD and PyriF strains showed a 100% mortality to all tested acaricides at 8 h post-treat-ment (Fig 2AandS3 Table).
Using the diagnostic dose of fenothiocarb, seven strains (AD, FenR, PTF, 13GG_GY_G1, 13GG_SW_G1, 13JB_GJ_G1 and 13GG_GY_R1) exhibited mortality rates of 50 ~ 100%, whereas three strains (AbaR, 13GG_PJ_R1 and 13CB_JC_R1) showed 24.8 ~ 49.2% mortality rates. For monocrotophos, the FenR and PTF strains exhibited over 80% mortality, whereas the remaining 10 strains showed less than 40% mortality. Treatment with omethoate caused an 86.7 ~ 100% mortality rate in FenR, PTF and 13JB_GJ_G1 strains, whereas it resulted in a 0 ~ 56.3% mortality rate in the remaining seven strains. The monocrotophos-resistant AD strain exhibited the lowest mortality rates to organophosphate acaricides (5.9% and a 27.7% mortality rate to monocrotophos and omethoate, respectively) (Fig 2AandS3 Table). The diagnostic
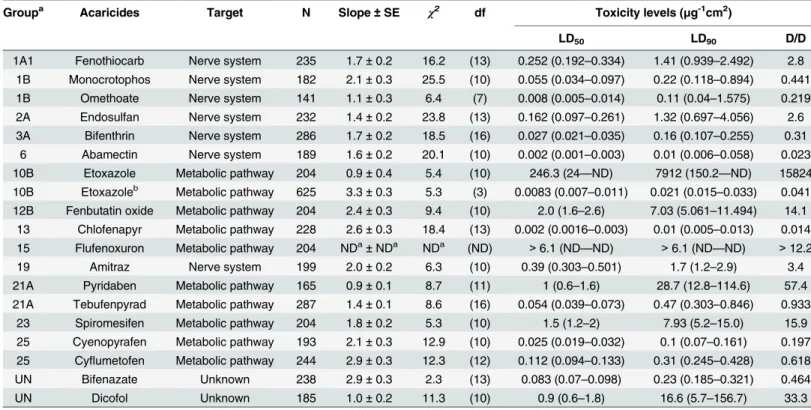
Table 3. Toxicity parameter by residual contact vial bioassay to PyriF strains inTetranychus urticae.
Groupa Acaricides Target N Slope±SE χ2 df Toxicity levels (μg-1cm2)
LD50 LD90 D/D
1A1 Fenothiocarb Nerve system 235 1.7±0.2 16.2 (13) 0.252 (0.192–0.334) 1.41 (0.939–2.492) 2.8 1B Monocrotophos Nerve system 182 2.1±0.3 25.5 (10) 0.055 (0.034–0.097) 0.22 (0.118–0.894) 0.441 1B Omethoate Nerve system 141 1.1±0.3 6.4 (7) 0.008 (0.005–0.014) 0.11 (0.04–1.575) 0.219 2A Endosulfan Nerve system 232 1.4±0.2 23.8 (13) 0.162 (0.097–0.261) 1.32 (0.697–4.056) 2.6 3A Bifenthrin Nerve system 286 1.7±0.2 18.5 (16) 0.027 (0.021–0.035) 0.16 (0.107–0.255) 0.31
6 Abamectin Nerve system 189 1.6±0.2 20.1 (10) 0.002 (0.001–0.003) 0.01 (0.006–0.058) 0.023 10B Etoxazole Metabolic pathway 204 0.9±0.4 5.4 (10) 246.3 (24—ND) 7912 (150.2—ND) 15824 10B Etoxazoleb Metabolic pathway 625 3.3±0.3 5.3 (3) 0.0083 (0.007–0.011) 0.021 (0.015–0.033) 0.041 12B Fenbutatin oxide Metabolic pathway 204 2.4±0.3 9.4 (10) 2.0 (1.6–2.6) 7.03 (5.061–11.494) 14.1
13 Chlofenapyr Metabolic pathway 228 2.6±0.3 18.4 (13) 0.002 (0.0016–0.003) 0.01 (0.005–0.013) 0.014 15 Flufenoxuron Metabolic pathway 204 NDa±NDa NDa (ND) >6.1 (ND—ND) >6.1 (ND—ND) >12.2
19 Amitraz Nerve system 199 2.0±0.2 6.3 (10) 0.39 (0.303–0.501) 1.7 (1.2–2.9) 3.4
21A Pyridaben Metabolic pathway 165 0.9±0.1 8.7 (11) 1 (0.6–1.6) 28.7 (12.8–114.6) 57.4 21A Tebufenpyrad Metabolic pathway 287 1.4±0.1 8.6 (16) 0.054 (0.039–0.073) 0.47 (0.303–0.846) 0.933
23 Spiromesifen Metabolic pathway 204 1.8±0.2 5.3 (10) 1.5 (1.2–2) 7.93 (5.2–15.0) 15.9 25 Cyenopyrafen Metabolic pathway 193 2.1±0.3 12.9 (10) 0.025 (0.019–0.032) 0.1 (0.07–0.161) 0.197 25 Cyflumetofen Metabolic pathway 244 2.9±0.3 12.3 (12) 0.112 (0.094–0.133) 0.31 (0.245–0.428) 0.618 UN Bifenazate Unknown 238 2.9±0.3 2.3 (13) 0.083 (0.07–0.098) 0.23 (0.185–0.321) 0.464
UN Dicofol Unknown 185 1.0±0.2 11.3 (10) 0.9 (0.6–1.8) 16.6 (5.7–156.7) 33.3
aThe grouping was based on the mode of action classification by Insecticide Resistance Action Committee (IRAC) (http://www.irac-online.org/documents/ moa-structures-poster-english/?ext=pdf)
b
ND represents‘not determined’
cDetermined by leaf dipping methods based on emergence rate. The unit of toxicity levels were ppm.
dose of endosulfan, an organochlorine acaricide, caused more than 60% mortality in seven mite populations but less than 60% mortality in three of the red-type mite populations. In the treatment with bifenthrin, a pyrethroid acaricide, all test populations, except for the AD and PTF strains, exhibited low mortality responses of less than 55%. The pyrethroid-resistant FenR strain showed the lowest mortality rate (6.3%) (Fig 2AandS3 Table). With the diagnostic dose of abamectin, only the AD and 13JB_GJ_G1 strains showed 100% mortality rate, whereas the remaining eight strains exhibited less than 50% mortality. The PTF and AbaR strains, known to be resistant to abamectin, exhibited mortality rates of 26.5% and 0%, respectively (Fig 2A
andS3 Table). When treated with the diagnostic dose of etoxazole by the leaf dipping method, the AD, FenR and PyriF strains displayed 100% mortality, but the remaining five strains showed less than 50% mortality (Fig 2AandS3 Table). Chlorfenapyr treatment resulted in over 60% mortality in eight strains, whereas less than 15.6% mortality was observed in the remaining strains (13GG_SW_G1 and 13CB_JC_R1). Tebufenpyrad generally caused high mortalities (>60%) in eight strains, whereas the AbaR and 13CB_JC_R1 strains exhibited rela-tively lower mortality rates. Cyenopyrafen and cyflumetofen, belonging to group 25, caused over 60% mortality in seven strains, but less than 50% mortality in the 13GG_SW_G1, 13GG_PJ_R1 and 13CB_JC_R1 populations. Treatment of the diagnostic dose of bifenazate resulted in high mortalities in four strains but low mortalities (of less than 20%) in six strains.
In a summary, each mite population exhibited a varied mortality response when treated with diagnostic doses of the different acaricides by RCV, which indicates that the overall sus-ceptibility profiles of a test mite population to different acaricides can be determined by RCV, once diagnostic doses are established. The susceptible reference strains (UD and PyriF) exhib-ited 100% mortalities, whereas the known acaricide-resistant strains (AD, FenR and PTF and AbaR) exhibited reduced mortality rates in response to the diagnostic doses of corresponding acaricides, confirming the potential of RCV in discriminating the reduced susceptibility levels
Fig 2. Heat maps of the mortalities and allele frequencies in 12 strains ofT.urticae.(A) Heat map of the mortalities obtained by the diagnostic doses of RCV. (B) Heat map of the allele frequencies of 12 target site mutations determined by QS. The figure in each cell represents the actual value of color intensity and‘nd’in the empty cells represents a‘not-determined value’. The actual values calculated by regression equation were listed inS6 Table.
in mite populations. In addition, a mite strain resistant to one acaricide also showed reduced mortalities to other acaricides, suggesting the possibility of cross-resistance and further imply-ing that multiple resistance to different groups of acaricides is widespread in most mite popula-tions. Diagnostic doses of six acaricides (fenothiocarb, endosulfan, chlorfenapyr, tebufenpyrad, cyenopyrafen and cyflumetofen) resulted in a 68.0~71.8% mortality rate (on average) in the test mite populations, whereas the remaining six acaricides (monocrotophos, omethoate, bifen-thrin, abamectin, etoxazole and bifenazate) caused slightly reduced mortality rates (on average 36.5~59.3%).
Validation of the reliability of resistance detection based on RCV
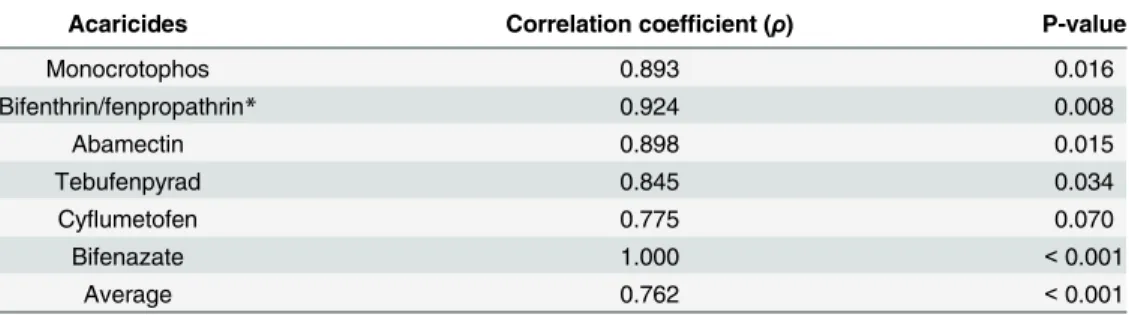
To verify the reliability of resistance detection based on RCV, a correlation analysis was con-ducted by comparing the mortalities of representative strains obtained by RCV with the diag-nostic doses and those by spray with recommend doses. The average correlation coefficient was 0.762 (p<0.001) (Table 4). However, if excluding cyflumetofen, a relatively slow-acting metabolic inhibitor, all tested acaricides revealed high degrees of correlation (ρ>0.845) between the mortalities determined by RCV and spray methods, suggesting the reliability of RCV method in resistance detection (Table 4andS4 Table).
Establishment of QS regressions for the prediction of allele frequencies
Several equations for the allele frequency predictions have been previously established for the mutations inTuace(G228S and F439W),Tuvssc(L1022V) andTuGluCl1(G323D) [37]. Along with these, additive QS equations were newly established for the frequency prediction of six point mutations inTuvssc(A1376D and F1704I),TuGluCl3(G326E),TuCHS(I1017F) andTuCytB(G126S and P262T). Although five mutations (G126S, I136T, S141F, D161G and
P262T) inTuCytBhave been reported to be associated with bifenazate resistance, the QS proto-col was established for only G126S and P262T mutations as the representative markers for bife-nazate resistance because the other three mutations (I136T, S141F, and D161G) have not been identified in the mite populations tested in this study. High correlation coefficients (r2= 0.982 ~ 0.999) were obtained in all regression equations generated by plotting the resistant nucleotide signal ratios of each mutation and the corresponding resistance allele frequencies (S5 Table). The lower and higher detection limits ranged from 4.5~21.9% (12.8±5.7%) and 89.1~97.5% (91.8±3.1%) at the 95% confidence level, respectively.
Table 4. Correlation coefficients between the mortalities obtained by RCV with diagnostic doses and those obtained by spray with recommended doses of six representative acaricides.
Acaricides Correlation coefficient (ρ) P-value
Monocrotophos 0.893 0.016
Bifenthrin/fenpropathrin* 0.924 0.008
Abamectin 0.898 0.015
Tebufenpyrad 0.845 0.034
Cyflumetofen 0.775 0.070
Bifenazate 1.000 <0.001
Average 0.762 <0.001
*The mortalities by RCV with bifenthrin were compared with those by spray with fenpropathrin, another pyrethroid acaricide.
Determination of resistance allele frequencies in mite populations by QS
QS was employed to determine the frequencies of resistance alleles corresponding to the 12 point mutations that have been reported to date (Fig 2B). The frequencies of all mutations examined were close to 0% in the susceptible reference strains (UD and PyriF). The frequencies of the G228S and F439W mutations inTuace, associated with organophosphate resistance [19], were generally high in most populations including the AD strain. In addition, the G228A and F439Y mutations, other alleles of the G228S and F439W mutations, respectively, were also found in some populations. In the AbaR and 13CB_JC_R1 populations, the G228A mutation was present in higher frequencies than the G228S mutation. The F439Y mutation was only found in the 13JB_GJ_G1 population, which has also been reported in several resistant popula-tions in the Netherlands [50].Among the three point mutations (L1022V, A1376D and F1704I) that have been reported to be associated with pyrethroid resistance [20,21]; the L1022V and A1376D mutations were found in similar frequencies in several populations including the FenR strain, suggesting a close linkage between these two loci. In contrast, the F1704I mutation allele was observed in high frequencies only in a few field populations (13GG_GY_G1, 13GG_SW_G1 and 13JB_GJ_G1), which indicates that it has not widespread yet in Korea. Four red-type mites showed 100% frequency of the A1376D mutation. The number of histidine residues in the intracellular loop of the voltage-sensitive sodium channel, which was different between the sus-ceptible and resistant strains [20], varied among different mite strains, suggesting the likeli-hood of a simple polymorphism without association with pyrethroid resistance inT.urticae
(S6 Table).
Both the G323D and G326E point mutations associated with abamectin resistance, which have been found inTuGluCl1andTuGluCl3, respectively [22,23], were found together and sat-urated (100%) in all red-type mite populations (Fig 2BandS6 Table). Interestingly, one popu-lation of green-type mites, 13_GG_GY_G1, was determined to possess only the G326E mutation inTuGluCl3without the G323D mutation inTuGluCl1, suggesting that these two resistance mutations have been independently selected.
The I1017F mutation inTuChS1, which is associated with etoxazole resistance [24] and cross-resistance to several mite growth inhibitors such as hexythiazox and clofentezine [51], was found to be saturated in all red-type mites examined. Three field-collected green-type mite populations (13GG_GY_G1, 13GG_SW_G1 and 23JB_GJ_G1) also possessed allele frequen-cies of over 80% (Fig 2BandS6 Table). Laboratory strains of green-type mites and
13JB_GJ_G1 did not possess the I1017F mutation.
Out of the two mutations (G126S and P262T) on mitochondrialTuCytBreported to be involved in bifenazate resistance, the G126S mutation was found in 13GG_GY_G1, AbaR, and 13CB_JC_R1, whereas the P262T mutation was found in 13GG_SW_G1 and 13GG_GY_R1 (Fig 2BandS6 Table).
Correlation analysis between RCV immortality and QS resistant allele
frequency
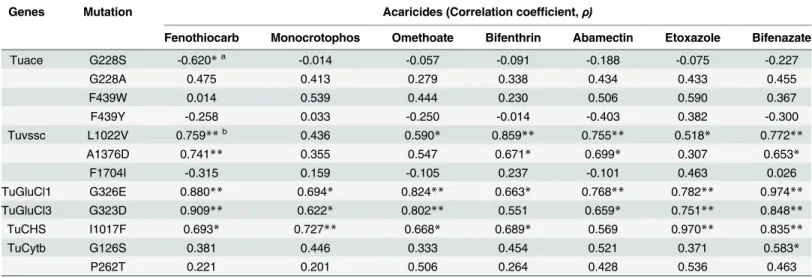
Correlation analyses were conducted to investigate the relationships between the actual resis-tance levels determined by RCV and the resisresis-tance allele frequencies obtained by QS. Allele fre-quencies of the G228S, G228A and F439Y mutations onTuacerevealed low correlations (ρ=
-0.620 ~ 0.475) with the mortality rates of the organophosphate and carbamate acaricides (Table 5). However, the F439W mutation frequencies revealed an increased correlation (ρ=
(p<0.01) andρ= 0.671 (p<0.05), respectively] (Table 5), and tightly linked (ρ= 0.930, p<0.01) (S1 Fig). However, theTuvsscF1704I mutation frequencies revealed a low correlation with L1022V and A1376D (ρ= -0.4 and -0.24, respectively) (S1 Fig). The G323D and G326E
mutation frequencies were highly correlated with the mortality rate by abamectin (ρ= 0.659
and 0.768, respectively) (Table 5). Frequencies of both mutations also revealed a high correla-tion to each other (ρ= 0.953, p<0.01) (S1 Fig). Frequencies of theTuChS1I1017F revealed the highest correlation (ρ= 0.970, p<0.01) with the mortality rate by etoxazole (Table 5). Fre-quencies of theTuCytBG126S and P262T mutations revealed low correlations with the mortal-ity rate by bifenazate (ρ= 0.583 and 0.463, respectively). Nevertheless, all strains
(13GG_SW_G1 and 13GG_GY_R1) that have the P262T mutation are highly resistant to bife-nazate, suggesting that it is a main causative mutation for bifenazate resistance. In case of a strain with neither the G126S nor P262T mutation (13GG_PJ_R1) but exhibiting some level of bifenazate resistance, other metabolic or toxicokinetic resistance mechanisms are likely to be involved.
Interestingly, the frequencies ofTuGluClmutation showed high correlations (ρ>~0.7, P<0.01) not only with abamectin but with other acaricides acting on completely different tar-get, such as bifenazate, fenothiocarb and etoxazole (Table 5).
Discussion
Through biochemical and molecular biological approaches to understand pesticide resistance, many types of resistance-evoking factors, mainly governed by target site mutations, have been elucidated [15,52]. The resistance-associated mutations have been employed as genetic mark-ers to determine the resistance levels in pest populations in conjunction with high-throughput screening strategies for massive samples with decreasing cost that can replace the traditional phenotypic resistance monitoring [53–57]. However, it is important to evaluate the accuracy and representativeness of resistance genetic markers in determining resistance levels in field pest populations showing multiple resistance traits.
Table 5. Correlation coefficient between allele frequency of mutation and mortality determined by RCV from 12 strains.
Genes Mutation Acaricides (Correlation coefficient,ρ)
Fenothiocarb Monocrotophos Omethoate Bifenthrin Abamectin Etoxazole Bifenazate
Tuace G228S -0.620*a -0.014 -0.057 -0.091 -0.188 -0.075 -0.227
G228A 0.475 0.413 0.279 0.338 0.434 0.433 0.455
F439W 0.014 0.539 0.444 0.230 0.506 0.590 0.367
F439Y -0.258 0.033 -0.250 -0.014 -0.403 0.382 -0.300
Tuvssc L1022V 0.759**b 0.436 0.590* 0.859** 0.755** 0.518* 0.772**
A1376D 0.741** 0.355 0.547 0.671* 0.699* 0.307 0.653*
F1704I -0.315 0.159 -0.105 0.237 -0.101 0.463 0.026
TuGluCl1 G326E 0.880** 0.694* 0.824** 0.663* 0.768** 0.782** 0.974**
TuGluCl3 G323D 0.909** 0.622* 0.802** 0.551 0.659* 0.751** 0.848**
TuCHS I1017F 0.693* 0.727** 0.668* 0.689* 0.569 0.970** 0.835**
TuCytb G126S 0.381 0.446 0.333 0.454 0.521 0.371 0.583*
P262T 0.221 0.201 0.506 0.264 0.428 0.536 0.463
a
*P<0.05 b
**P<0.01
To this end, we evaluated the performance of RCV and QS methods as complimentary tools for the detection of acaricide resistance in several field populations ofT.urticae. The reliability of RCV as a resistance monitoring tool was confirmed by comparing the RCV toxicity data with the toxicity data obtained by spray bioassay. In addition, we also assessed the correlation between the RCV vs. spray data and RCV vs. QS data to determine whether allele frequency data generated from QS could be employed as an alternative index to quantify resistance levels. Finally, we examined whether and how different resistance profiles are related each other.
Diagnostic doses for a more inclusive set of fast-acting acaricides were established and employed to determine the resistance levels in several populations ofT.urticaebased on RCV. For acaricides with low contact toxicity or slow-acting mite growth regulators, such as etoxa-zole, fenbutatin oxide, flufenoxuron, spiromesifen (Table 3), RCV was impractical for estab-lishing diagnostic doses and the traditional leaf dipping method was used. When treated with the diagnostic doses using RCV, all reference acaricide-susceptible and -resistant strains showed expected mortality responses, demonstrating the discrimination capacity of the diag-nostic doses.
Many field-collected mites showed high levels of resistance to most tested acaricides with RCV, indicating the widespread nature of multiple resistance in these populations and the necessity for immediate action by resistance management. In general, the red-type mites col-lected from the greenhouse rose cultivation areas exhibited relatively higher resistance levels compared with the green-type mites, suggesting their potential genetic differences in resistance development. The red-type mites clustered with Hap_17 (corresponding lineage I to Hinomoto et al., 2001 [58]) and similar red-type mites have been reported in European and Israeli popula-tions [38], suggesting their recent invasion into the greenhouse rose cultivation areas of Korea. Rapid and comprehensive profiling of resistance (or susceptibility) status by RCV would enable a more efficient selection of optimum alternative acaricides for rotation and would facilitate an understanding of the pattern of resistance development in these invasive, difficult-to-control populations ofT.urticae.
In our previous studies, we established the QS protocol for the determination of resistance allele frequencies associated with resistances to OP, pyrethroid and abamectin inT.urticae
[37]. In this study, we established additional QS protocols for the prediction of the recently identified 12 nonsynonymous point mutations putatively associated with acaricide resistance (S5 Table). QS analysis revealed that the susceptible reference strains (UD and PyriF) exhibited 0% frequency in all the resistance alleles examined, whereas the laboratory acaricide-resistant strains showed 100% or near 100% frequencies in the alleles corresponding to respective resis-tance traits. These results demonstrate the accuracy of QS in predicting resisresis-tance allele fre-quency. As determined by QS,T.urticaecollected from various rose cultivation greenhouses exhibited high frequencies in nearly all resistance alleles examined, indicating the widespread distribution of multiple resistance in these field populations and further suggesting that they have been extensively selected by a wide variety of acaricides.
Recently, a worldwide distribution of target site mutations associated with acaricide resis-tance inT.urticaewas also surveyed by sequencing the relevant gene fragments of five target genes [59]. This sequencing analysis for determining the presence or absence of point muta-tions can provide qualitative information on the distribution and occurrence of resistance alleles in mite populations of different geographical regions but not quantitative information on the resistance allele frequency. With this in mind, QS could be employed as a cost-effective genotyping tool to predict and quantify resistance allele frequencies in multiple numbers of mite populations in the initial stage of resistance monitoring.
correlated with the mortality responses to the diagnostic doses of those acaricides (ρ=
0.655~0.785, 0.723~0.816 and 0.968, respectively). In these cases, the resistance allele frequency can represent the actual resistance level and can be used as an alternative index for resistance monitoring. In the case of the other acaricides examined, however, target site resistance allele frequencies exhibited only low correlations with mortality responses, limiting the use of allele frequency as a direct indicator for estimating actual resistance levels. This low level of correla-tion is likely, at least in part, due to the fact that the frequencies of the target site resistance alleles are almost saturated in most of the test populations, except for the susceptible reference strains. It is also possible that the other target site resistance factors play more determining roles in resistance. In the case of theTuacemutations,Tuacegene amplification functions as an additive factor to resistance and complicates the interpretation of phenotypic resistance lev-els contributed by the target site mutations [9,18]. Since metabolic resistance mechanisms (i.e., esterase and cytochrome P450) have been well documented for bifenthrin and ababmectin resistance [60,61], the presence of metabolic resistance factors in some mite populations likely causes the reduction of correlation. Nevertheless, the resistance allele frequency data alone allowed for the evaluation of the genetic resistance potential and background of test mite popu-lations. In addition, the routine assessment of resistance allele frequencies could provide funda-mental information for understanding the temporal and spatial dynamics of resistance alleles. The information on theT.urticaegenome would greatly facilitate the identification of a wide array of novel resistance markers on a genome scale [13], which, in turn, would greatly expand the applicability of QS-based molecular resistance monitoring.
Interestingly, when different resistance traits in the mites collected from rose-cultivating green houses were compared on the bases of resistance allele frequencies on various acaricide target sites, resistance levels to certain acaricides were highly correlated with the mutation allele frequencies that are associated with resistance to other groups of acaricides with completely different modes of action (i.e., fenothiocarb, abamectin and bifenazte vs.TuvsscL1022V muta-tion; fenothiocarb, omethoate, etoxazole and bifenazate vsTuGluClmutations; monocrotophos and bifenazate vs.TuCHSI1017F mutation; P<0.01) (Table 5). These non-specific correlations do not necessarily indicate the presence of a cross-resistance mechanism between such differ-ent groups of acaricides, but rather reflect the simultaneous developmdiffer-ent of resistance due to a common use history of the acaricides clustered together. Considering that various acaricides are used together with high selection pressures for mite control and the introgression of suscep-tible alleles is extremely limited in a closed greenhouse environment, the rapid and concurrent accumulation of multiple resistance alleles in the acaricide-selected mites would be natural in the greenhouse environment.
Conclusions
Rapid resistance monitoring is the utmost prerequisite for the proper management of acari-cide-resistant populations ofT.urticae. RCV can be employed as a rapid tool for the on-site monitoring of resistance levels to fast-acting acaricides. However, to maximize the applicability of RCV, the determination of diagnostic doses for a wider array of acaricides is necessary. As a tool for the genotyping of resistance alleles on a population basis, QS protocols were estab-lished, and their potential as a molecular resistance monitoring tool was evaluated. The resis-tance allele frequencies estimated by QS showed high levels of correlation with actual
resistance alleles. With this in mind, a genome-wide search for a more inclusive repertoire of molecular resistance markers that can be used for QS is required for the wider application of QS in resistance detection. In conjunction with the RCV bioassay, the complementary use of QS will greatly contribute to the management ofT.urticaeacaricide resistance.
Supporting Information
S1 Fig. Spearman correlation analysis to determine the correlation between allele frequen-cies inT.urticaestrains.The circle size is proportional to the value of Spearman's rank corre-lation coefficient. The‘X’denotes a p-value higher than 0.05 in the confidence interval. (DOCX)
S1 Table. GenBank ID used for the construction of phylogenetic tree based on mtCOI. (DOCX)
S2 Table. Oligonucleotide primers used in this study.Bold characterized primers were used for sequencing.
(DOCX)
S3 Table. Mortalities of 12 strains ofT.urticaeto 12 acaricides when treated with the diag-nostic doses via RCV.
(DOCX)
S4 Table. Comparison of mortalities between RCV and spray methods. (DOCX)
S5 Table. Regression and prediction equations for the estimation of resistance allele fre-quencies.
(DOCX)
S6 Table. Allele frequencies associated with acaricide resistance inT.urticaestrains deter-mined by QS.
(DOCX)
Acknowledgments
This work was supported by a grant from the Rural Development Administration (grant no. PJ009365). The funders had no role in study design, data collection and analysis, decision to publish, or preparation of the manuscript. We also thank PAA, KSJ, and KKM for the prepara-tion of genomic DNA extracprepara-tion and sampling of field populaprepara-tions. Addiprepara-tionally, a special thanks to Mr. KMS for her devotion to maintaining the local mite populations.
Author Contributions
Conceived and designed the experiments: DHK SHL. Performed the experiments: DHK TJK YHK. Analyzed the data: DHK YHK TJK. Contributed reagents/materials/analysis tools: DHK TJK SHL. Wrote the paper: DHK SHL.
References
1. Arthropods Resistant to Pesticides Database (ARPD) [Internet]. 2014. Available: http://www.irac-online.org/.
4. Andow DA, Alstad DN, Pang YH, Bolin PC, Hutchison WD. Using an F2screen to search for resistance alleles toBacillus thuringiensistoxin in European corn borer (Lepidoptera: Crambidae). J Econ Ento-mol. 1998; 91(3):579–84.
5. Alstad DN, Andow DA. Implementing management of insect resistance to transgenic crops. AgBiotech News and Information. 1996; 8:177–81.
6. Dittrich V. A comparative study of toxicological test methods on a population of the two-spotted spider mite,Tetranychus urticae. J Econ Entomol. 1962; 55:644–8.
7. Dennehy TJ, Granett J, Leigh TF. Relevance of slide-dip and residual bioassay comparisons to detec-tion of resistance in spider mites. J Econ Entomol. 1983; 76:1225–30.
8. Dennehy TJ, Grafton-Cardwell EE, Granett J, Barbour K. Practitioner-assessable bioassay for detec-tion of dicofol resistance in spider mites (Acari: Tetranychidae). J Econ Entomol. 1987; 80:998–1003. 9. Khajehali J, Van Leeuwen T, Grispou M, Morou E, Alout H, Weill M, et al. Acetylcholinesterase point
mutations in European strains ofTetranychus urticae(Acari: Tetranychidae) resistant to organophos-phates. Pest Manag Sci. 2010; 66(2):220–8. doi:10.1002/ps.1884PMID:19894225
10. Koh S-H, Ahn J, Im J-S, Jung C, Lee SH, Lee J-H. Monitoring of acaricide resistance ofTetranychus urticae(Acari: Tetranychidae) from Korean apple orchards. J Asia Pac Entomol. 2009; 12(1):15–21. 11. Kwon DH, Song DY, Kang S, Ahn JJ, Lee J- H, Choi BR, et al. Residual contact vial bioassay for the on-site detection of acaricide resistance in the two-spotted spider mite. J Asia Pac Entomol. 2010; 13 (4):333–7. doi:http://dx.doi.org/10.1016/j.aspen.2010.05.005
12. Kwon DH, Seong GM, Kang TJ, Lee SH. Multiple resistance mechanisms to abamectin in the two-spot-ted spider mite. J Asia Pac Entomol. 2010; 13(3):229–32. doi:http://dx.doi.org/10.1016/j.aspen.2010. 02.002
13. GrbićM, Van Leeuwen T, Clark RM, Rombauts S, Rouzé P, GrbićV, et al. The genome of Tetranychus urticae reveals herbivorous pest adaptations. Nature. 2011; 479(7374):487–92. doi:10.1038/ nature10640PMID:22113690
14. Van Leeuwen T, Dermauw W, Grbic M, Tirry L, Feyereisen R. Spider mite control and resistance man-agement: does a genome help? Pest Manag Sci. 2013; 69(2):156–9. doi:10.1002/ps.3335PMID: 22696491
15. Feyereisen R, Dermauw W, Van Leeuwen T. Genotype to phenotype, the molecular and physiological dimensions of resistance in arthropods. Pestic Biochem Phys. 2015; 121:61–77. doi:http://dx.doi.org/ 10.1016/j.pestbp.2015.01.004
16. Van Leeuwen T, Tirry L, Yamamoto A, Nauen R, Dermauw W. The economic importance of acaricides in the control of phytophagous mites and an update on recent acaricide mode of action research. Pestic Biochem Phys. 2015; 121:12–21. doi:http://dx.doi.org/10.1016/j.pestbp.2014.12.009
17. Anazawa Y, Tomita T, Aiki Y, Kozaki T, Kono Y. Sequence of a cDNA encoding acetylcholinesterase from susceptible and resistant two-spotted spider mite,Tetranychus urticae. Insect Biochem Mol Biol. 2003; 33(5):509–14. doi:http://dx.doi.org/10.1016/S0965-1748(03)00025-0PMID:12706630 18. Kwon DH, Choi JY, Je YH, Lee SH. The overexpression of acetylcholinesterase compensates for the
reduced catalytic activity caused by resistance-conferring mutations inTetranychus urticae. Insect Bio-chem Mol Biol. 2012; 42(3):212–9. doi:http://dx.doi.org/10.1016/j.ibmb.2011.12.003PMID:22198354 19. Kwon DH, Im JS, Ahn JJ, Lee JH, Clark JM, Lee SH. Acetylcholinesterase point mutations putatively
associated with monocrotophos resistance in the two-spotted spider mite. Pestic Biochem Phys. 2010; 96(1):36–42. doi:10.1016/j.pestbp.2009.08.013PMID:ISI:000273647100006.
20. Kwon DH, Clark JM, Lee SH. Cloning of a sodium channel gene and identification of mutations puta-tively associated with fenpropathrin resistance inTetranychus urticae. Pestic Biochem Phys. 2010; 97 (2):93–100. doi:http://dx.doi.org/10.1016/j.pestbp.2009.07.009
21. Tsagkarakou A, Van Leeuwen T, Khajehali J, Ilias A, Grispou M, Williamson MS, et al. Identification of pyrethroid resistance associated mutations in the para sodium channel of the two-spotted spider mite Tetranychus urticae(Acari: Tetranychidae). Insect Mol Biol. 2009; 18(5):583–93. doi: 10.1111/j.1365-2583.2009.00900.xPMID:19754737
22. Dermauw W, Ilias A, Riga M, Tsagkarakou A, GrbićM, Tirry L, et al. The cys-loop ligand-gated ion
channel gene family ofTetranychus urticae: Implications for acaricide toxicology and a novel mutation associated with abamectin resistance. Insect Biochem Mol Biol. 2012; 42(7):455–65. doi:http://dx.doi. org/10.1016/j.ibmb.2012.03.002PMID:22465149
23. Kwon DH, Yoon KS, Clark JM, Lee SH. A point mutation in a glutamate-gated chloride channel confers abamectin resistance in the two-spotted spider mite,Tetranychus urticaeKoch. Insect Mol Biol. 2010; 19(4):583–91. doi:10.1111/j.1365-2583.2010.01017.xPMID:20522121
in arthropods. Proc Natl Acad Sci U S A. 2012; 109(12):4407–12. doi:10.1073/pnas.1200068109 PMID:22393009
25. Van Leeuwen T, Vanholme B, Van Pottelberge S, Van Nieuwenhuyse P, Nauen R, Tirry L, et al. Mito-chondrial heteroplasmy and the evolution of insecticide resistance: Non-Mendelian inheritance in action. Proc Natl Acad Sci U S A. 2008; 105(16):5980–5. doi:10.1073/pnas.0802224105PMID: 18408150
26. Van Nieuwenhuyse P, Van Leeuwen T, Khajehali J, Vanholme B, Tirry L. Mutations in the mitochondrial cytochrome b ofTetranychus urticaeKoch (Acari: Tetranychidae) confer cross-resistance between bifenazate and acequinocyl. Pest Manag Sci. 2009; 65(4):404–12. doi:10.1002/ps.1705PMID: 19165831
27. Sommer SS, Cassady JD, Sobell JL, Bottema CDK. A novel method for detecting point mutations or polymorphisms and its application to population screening for carriers of phenylketonuria. Mayo Clin Proc. 1989; 64(11):1361–72. doi:http://dx.doi.org/10.1016/S0025-6196(12)65378-6PMID:2687596 28. Liu Q, Thorland EC, Heit JA, Sommer SS. Overlapping PCR for bidirectional PCR amplification of
spe-cific alleles: A rapid one-tube method for simultaneously differentiating homozygotes and heterozy-gotes. Genome Res. 1997; 7(4):389–98. doi:10.1101/gr.7.4.389PMID:9110178
29. Germer S, Holland MJ, Higuchi R. High-throughput SNP allele-frequency determination in pooled DNA samples by kinetic PCR. Genome Res. 2000; 10:258–66. PMID:10673283
30. Livak KJ. Allelic discrimination using fluorogenic probes and the 5' nuclease assay. Genet Anal. 1999; 14:143–9. PMID:10084106
31. Wilkening S, Hemminki K, Thirumaran RK, Bermejo JL, Bonn S, Forsti A, et al. Determination of allele frequency in pooled DNA: comparison of three PCR-based methods. Biotechniques. 2005; 39:853–8. PMID:16382903
32. Clark JM, Lee SH, Kim HJ, Yoon KS, Zhang A. DNA-based genotyping techniques for the detection of point mutations associated with insecticide resistance in Colorado potato beetleLeptinotarsa decemli-neata. Pest Manag Sci. 2001; 57(10):968–74. doi:10.1002/ps.369PMID:11695191
33. Kwon DH, Choi BR, Park HM, Lee SH, Miyata T, Clark JM, et al. Knockdown resistance allele fre-quency in field populations ofPlutella xylostellain Korea. Pestic Biochem Physiol. 2004; 80(1):21–30. 34. Jamroz RC, Guerrero FD, Kammlah DM, Kunz SE. Role of thekdrandsuper-kdrsodium channel
muta-tions in pyrethroid resistance: correlation of allelic frequency to resistance level in wild and laboratory populations of horn flies (Haematobia irritans). Insect Biochem Mol Biol. 1998; 28(12):1031–7. Epub 1999/01/15. doi: S0965174898000940 [pii]. PMID:9887519.
35. Kwon DH, Yoon KS, Strycharz JP, Clark JM, Lee SH. Determination of permethrin resistance allele fre-quency of human head louse populations by quantitative sequencing. J Med Entomol. 2008; 45 (5):912–20. doi:10.1603/0022-2585(2008)45[912:dopraf]2.0.co;2PMID:18826035
36. Seong KM, Lee D-Y, Yoon KS, Kwon DH, Kim HC, Klein TA, et al. Establishment of quantitative sequencing and filter contact vial bioassay for monitoring pyrethroid resistance in the common bed bug, Cimex lectularius. J Med Entomol. 2010; 47(4):592–9. doi:10.1603/me09274PMID:20695274 37. Kwon DH, Lee SW, Ahn JJ, Lee SH. Determination of acaricide resistance allele frequencies in field
populations ofTetranychus urticaeusing quantitative sequencing. J Asia Pac Entomol. 2014; 17(1):99– 103. doi:http://dx.doi.org/10.1016/j.aspen.2013.11.001
38. Kwon DH, Kim H, Oh JH, Lee S, Lee SH. Establishment of an acaricide-susceptibleTetranychus urti-caestrain and its species confirmation based on morphological and molecular characters. J Asia Pac Entomol. 2011; 14(4):379–85. doi:http://dx.doi.org/10.1016/j.aspen.2011.05.001
39. Larkin MA, Blackshields G, Brown NP, Chenna R, McGettigan PA, McWilliam H, et al. Clustal W and Clustal X version 2.0. Bioinformatics. 2007; 23(21):2947–8. doi:10.1093/bioinformatics/btm404PMID: 17846036
40. Talavera G, Castresana J. Improvement of phylogenies after removing divergent and ambiguously aligned blocks from protein sequence alignments. System Biol. 2007; 56(4):564–77. doi:10.1080/ 10635150701472164
41. Tamura K, Peterson D, Peterson N, Stecher G, Nei M, Kumar S. MEGA5: Molecular evolutionary genet-ics analysis using maximum likelihood, evolutionary distance, and maximum parsimony methods. Mol Biol Evol. 2011; 28(10):2731–9. doi:10.1093/molbev/msr121PMID:21546353
42. Dereeper A, Guignon V, Blanc G, Audic S, Buffet S, Chevenet F, et al. Phylogeny.fr: robust phyloge-netic analysis for the non-specialist. Nucleic Acids Res. 2008; 36(suppl 2):W465–W9. doi:10.1093/nar/ gkn180
44. Kwon DH, Im JS, Ahn JJ, Lee J- H, Clark JM, Lee SH. Acetylcholinesterase point mutations putatively associated with monocrotophos resistance in the two-spotted spider mite. Pestic Biochem Phys. 2010; 96(1):36–42.
45. Kwon DH, Im JS, Ahn JJ, Lee J- H, Marshall Clark J, Lee SH. Acetylcholinesterase point mutations putatively associated with monocrotophos resistance in the two-spotted spider mite. Pestic Biochem Physiol. 2010; 96(1):36–42. doi:10.1016/j.pestbp.2009.08.013
46. R Development Core Team. R: A Language and Environment for Statistical Computing. R Foundation for Statistical Computing, Vienna, Austria; 2015.
47. de Mendonça R, Navia D, Diniz I, Auger P, Navajas M. A critical review on some closely related species ofTetranychussensu stricto (Acari: Tetranychidae) in the public DNA sequences databases. Exp Appl Acarol. 2011; 55(1):1–23. doi:10.1007/s10493-011-9453-5PMID:21468751
48. WHO. Test procedures for insecticide resistance monitoring in malaria vectors, bio-efficacy and persis-tence of insecticides on treated surfaces (archived). Geneva, World Health Organization. 1998. 49. Tabashnik BE, Mota-Sanchez D, Whalon ME, Hollingworth RM, Carrière Y. Defining terms for proactive
management of resistance to Bt crops and pesticides. J Econ Entomol. 2014; 107(2):496–507. doi:10. 1603/EC13458PMID:24772527
50. Khajehali J, Van Nieuwenhuyse P, Demaeght P, Tirry L, Van Leeuwen T. Acaricide resistance and resistance mechanisms inTetranychus urticaepopulations from rose greenhouses in the Netherlands. Pest Manag Sci. 2011; 67(11):1424–33. doi:10.1002/ps.2191PMID:21548003
51. Demaeght P, Osborne EJ, Odman-Naresh J, GrbićM, Nauen R, Merzendorfer H, et al. High resolution genetic mapping uncovers chitin synthase-1 as the target-site of the structurally diverse mite growth inhibitors clofentezine, hexythiazox and etoxazole inTetranychus urticae. Insect Biochem Mol Biol. 2014; 51:52–61. doi:http://dx.doi.org/10.1016/j.ibmb.2014.05.004PMID:24859419
52. Liu N. Insecticide resistance in mosquitoes: impact, mechanisms, and research directions. Annu Rev Entomol. 2015; 60:537–59. doi:10.1146/annurev-ento-010814-020828PMID:25564745
53. Clark JM. Determination, mechanism and monitoring of knockdown resistance in permethrin-resistant human head lice,Pediculus humanus capitis. J Asia Pac Entomol. 2009; 12(1):1–7. doi:http://dx.doi. org/10.1016/j.aspen.2008.10.007PMID:20161186
54. Clark JM, Lee SH, Kim HJ, Yoon KS, Zhang A. DNA-based genotyping techniques for the detection of point mutations associated with insecticide resistance in Colorado potato beetleLeptinotarsa decemli-neata. Pest Manag Sci. 2001; 57(10):968–74. Epub 2001/11/07. doi:10.1002/ps.369PMID:11695191. 55. Devonshire AL, Devine GJ, Moores GD. Comparison of microplate esterase assays and immunoassay
for identifying insecticide resistant variants ofMyzus persicae(Homoptera: Aphididae). Bull Entomol Res. 1992; 82(04):459–63.
56. Brogdon WG. Biochemical resistance detection: an alternative to bioassay. Parasitol today. 1989; 5 (2):56–60. PMID:15463180
57. Brown TM, Brogdon WG. Improved detection of insecticide resistance through conventional and molec-ular techniques. Annu Rev Entomol. 1987; 32:145–62. Epub 1987/01/01. doi:10.1146/annurev.en.32. 010187.001045PMID:3545054.
58. Hinomoto N, Osakabe M, Gotoh T, Takafuji A. Phylogenetic analysis of green and red forms of the two-spotted spider mite,Tetranychus urticaeKoch (Acari: Tetranychidae), in Japan, based on mitochondrial cytochrome oxidase subunit I sequences. Appl Entomol Zool. 2001; 36(4):459–64.
59. Ilias A, Vontas J, Tsagkarakou A. Global distribution and origin of target site insecticide resistance mutations inTetranychus urticae. Insect Biochem Mol Biol. 2014; 48(0):17–28. doi:http://dx.doi.org/10. 1016/j.ibmb.2014.02.006
60. Riga M, Tsakireli D, Ilias A, Morou E, Myridakis A, Stephanou EG, et al. Abamectin is metabolized by CYP392A16, a cytochrome P450 associated with high levels of acaricide resistance inTetranychus urticae. Insect Biochem Mol Biol. 2014; 46:43–53. doi:http://dx.doi.org/10.1016/j.ibmb.2014.01.006 PMID:24463358