Left Ventricular Global Longitudinal Strain
(GLS) Is a Superior Predictor of All-Cause and
Cardiovascular Mortality When Compared to
Ejection Fraction in Advanced Chronic Kidney
Disease
Rathika Krishnasamy1,2*, Nicole M. Isbel1,2, Carmel M. Hawley1,2, Elaine M. Pascoe2, Matthew Burrage3, Rodel Leano3, Brian A. Haluska3, Thomas H. Marwick4, Tony Stanton3
1Department of Renal Medicine, The University of Queensland at Princess Alexandra Hospital, Brisbane, Australia,2School of Medicine, The University of Queensland, Brisbane Australia,3Cardiovascular Imaging Research Centre, The University of Queensland at Princess Alexandra Hospital, Brisbane, Australia,4Menzies Research Institute, University of Tasmania, Hobart, Australia
Abstract
Background
Echocardiographic global longitudinal strain (GLS) is increasingly recognised as a more ef-fective technique than conventional ejection fraction (EF) in detecting subtle changes in left ventricular (LV) function. This study investigated the prognostic value of GLS over EF in pa-tients with advanced Chronic Kidney Disease (CKD).
Methods
The study included 183 patients (57% male, 63% on dialysis) with CKD stage 4, 5 and 5Di-alysis (D). 112 (61%) of patients died in a follow up of 7.8±4.4 years and 41% of deaths were due to cardiovascular (CV) disease. GLS was calculated using 2-dimensional speckle tracking and EF was measured using Simpson’s biplane method. Cox proportional hazard models were used to assess the association of measures of LV function and all- cause and CV mortality.
Results
The mean GLS at baseline was -13.6±4.3% and EF was 45±11%. GLS was a significant predictor of all-cause [Hazard Ratio (HR) 1.09 95%; Confidence Interval (CI) 1.02–1.16; p = 0.01] and CV mortality (HR 1.16 95%; CI 1.04–1.30; p = 0.008) following adjustment for rele-vant clinical variables including LV mass index (LVMI) and EF. GLS also had greater predic-tive power for both all- cause and CV mortality compared to EF. Impaired GLS (>-16%) was associated with a 5.6-fold increased unadjusted risk of CV mortality in patients with pre-served EF.
OPEN ACCESS
Citation:Krishnasamy R, Isbel NM, Hawley CM, Pascoe EM, Burrage M, Leano R, et al. (2015) Left Ventricular Global Longitudinal Strain (GLS) Is a Superior Predictor of All-Cause and Cardiovascular Mortality When Compared to Ejection Fraction in Advanced Chronic Kidney Disease. PLoS ONE 10(5): e0127044. doi:10.1371/journal.pone.0127044
Academic Editor:Gianpaolo Reboldi, University of Perugia, ITALY
Received:July 17, 2014
Accepted:April 11, 2015
Published:May 15, 2015
Copyright:© 2015 Krishnasamy et al. This is an open access article distributed under the terms of the
Creative Commons Attribution License, which permits unrestricted use, distribution, and reproduction in any medium, provided the original author and source are credited.
Data Availability Statement:All relevant data are within the paper.
Funding:This study was supported in part by a grant from the National Health and Medical Research Council of Australia. There are no additional funding sources for this study.
Conclusions
In this cohort of patients with advanced CKD, GLS is a more sensitive predictor of overall and CV mortality compared to EF. Studies of larger populations in CKD are required to con-firm that GLS provides additive prognostic value in patients with preserved EF.
Introduction
Left ventricular (LV) systolic dysfunction, most commonly assessed by echocardiographic ejec-tion fracejec-tion (EF) is an established predictor of outcome. It is most widely used as a prognostic marker in patients with heart failure and determines eligibility for cardiac interventions. Obser-vational studies in chronic kidney disease (CKD) have demonstrated an association between impaired EF with a greater risk of cardiovascular (CV) and all-cause mortality[1–3]. Despite a high prevalence of CV insults and progressive symptoms of heart failure, EF remains preserved in the majority of patients with CKD [4–6]. In addition, several studies have identified less than a third of patients with end-stage kidney disease (ESKD) to have detectable systolic dys-function[1,7,8]. Whilst this discrepancy is related to the complex pathophysiology of CV dis-ease in CKD, technical limitations of EF measurement may also be a contributing factor. Standard echocardiographic EF measurement requires accurate tracing of endocardial border and is operator, volume and load dependent [9] resulting in a limited reproducibility [10]. There is a growing interest in the current literature for other non-invasive and more objective assessment of LV function. This is of particular relevance to the CKD cohort who undergo pro-gressive cardiac remodelling.
Global Longitudinal Strain (GLS) assessed using automated speckle-tracking echocardiogra-phy (STE) is an emerging technique for detecting and quantifying subtle disturbances in LV systolic function. GLS reflects the longitudinal contraction of the myocardium and its accuracy has been validated against tagged magnetic resonance imaging (MRI)[11]. This method is op-erator independent, more reproducible than EF, easily measured and integrated to standard echocardiogram method[12]. In the general population and patients with heart failure, GLS was shown to be a superior predictor of cardiac events and all-cause mortality compared to EF [13,14]. More recently, GLS was found to be a robust prognostic marker following myocardial infarction[15] and cardiac surgery[16], and in patients with cardiomyopathy[17] and aortic stenosis[18].
There is limited data relating to the utility and prognostic importance of strain in comparison to EF in CKD. We reported GLS provided an incremental prognostic power over relevant clinical and echocardiographic measurements in predicting overall survival in patients with mild to mod-erate CKD[19]. More recently, Kramann et al demonstrated strain parameters were independent risk factors for CV and all-cause mortality in 171 dialysis patients with 2.5 years of follow-up[20]. This current long-term study aimed to assess the prognostic value of GLS over conventional EF on both CV and all-cause mortality in patients with stage 4, 5 and 5D CKD. The study hypothe-sized that reduced GLS at baseline echocardiography may be associated with increased risk of all-cause and cardiovascular mortality in patients with advanced CKD.
Materials and Methods
This was a cardiac imaging sub-study of a larger randomized controlled trial, Longitudinal As-sessment of Numerous Discrete Modifications of Atherosclerotic Risk factors in Kidney disease Associate Professor Isbel has received research
(LANDMARK) 1 study powered for vascular structure and function end-points. LANDMARK 1 evaluated the efficacy of a nurse-driven multiple risk factor intervention over conventional care in reducing atheroma burden and endothelial dysfunction in patients with stage 4,5 and 5D CKD[21]. From 1999 to 2001, 200 patients were recruited in a single centre study involving detailed assessment of cardiac imaging in patients with CKD. The inclusion criteria were patients>18 years of age, stage 4 and 5 CKD with a calculated glomerular filtration rate
(GFR) of30mL/min using the Cockcroft–Gault equation[22] or on maintenance dialysis therapy (hemodialysis or peritoneal dialysis for at least 3 months). Patients with pre-existing conditions which were expected to limit their life expectancy to<6 months were excluded.
The study protocol was approved by Human Ethics Committee of the University of Queens-land and Princess Alexandra Hospital. All participants gave written, informed consent to par-ticipate in the study. Following 2 years of intervention, the LANDMARK 1 study did not achieve the primary outcome of regression of carotid intima media thickness (c-IMT) or im-provement in brachial artery reactivity (BAR)[21]. 183 patients with follow-up data on CV and all-cause mortality were included in this cardiac imaging sub-study.
Clinical Assessment
Demographic data, including an assessment of risk factor status and history of cardiovascular disease were recorded; cardiovascular medications were documented and a 12-lead electrocar-diogram was reviewed. Blood pressure, averaged from 3 seated measurements taken after a 5-minute rest, was measured pre dialysis on a short (2-day) break in all hemodialysis partici-pants. Hypertension and hypercholesterolemia were defined by the use of antihypertensive or lipid-lowering therapy, respectively. Diabetes was defined by a history of this diagnosis or use of oral hypoglycemic agents or insulin. Previous cardiovascular event was defined as a history of documented myocardial infarction, coronary artery bypass surgery, percutaneous coronary intervention, or hospital admission with acute coronary syndrome (ischemic chest pain and/or electrocardiographic [ECG] changes suggestive of ischemia with no elevation in cardiac en-zymes), peripheral vascular disease including peripheral revascularization procedure or ampu-tation due to ischemia.
Biochemical assessment
Blood for biochemical analyses was obtained from fasting venous samples and taken at base-line. Serum total cholesterol, triglycerides, albumin, phosphate, parathyroid hormone (PTH), corrected calcium, creatinine, and hemoglobin concentration were measured using standard laboratory techniques.
Echocardiography
All echocardiographic parameters were measured offline in batches by two experienced observ-ers blinded to clinical and outcome data. Timing of echocardiogram for hemodialysis partici-pants were standardised and performed immediately prior to dialysis on a short (2-day) break. Intra- and inter-observer variation were assessed by intra-class correlation co-efficient (ICC) and compared using Z-scores and Bland Altman plots and have been published elsewhere [19].
4- and 2-chamber views[23]. Preserved left ventricular EF was defined as50%[24,25]. LV mass was calculated with the formula: LV mass = 0.8 × {1.04[([LV internal dimension + septal wall thickness + posterior wall thickness]3−LV internal dimension3)] + 0.6 g. Left ventricular
mass was indexed to height2.7and left ventricular hypertrophy (LVH) was defined as51 g/m2.7 for both sexes[26]. LVH measurement was not available for 20 patients. The effect of afterload and preload on GLS was evaluated using LV wall stress and LV end diastolic volume (LVEDV). LV meridional wall stress was assessed using validated formula: LV wall stress = [0.334 x systolic BP x LV end diastolic diameter]/ [LV wall thickness in end diastole x (1 +LV wall thickness in end diastole /LV end diastolic diameter)] dynes/cm2x 1000[27].
b) 2D Speckle- Strain. The endocardial borders were traced in the end-systolic frame of the 2D images from the 3 apical views. Speckles were tracked frame by-frame throughout the LV wall during the cardiac cycle and basal, mid, and apical regions of interest were created. Segments that failed to track were manually adjusted by the operator. GLS was calculated as the mean strain of 18 segments. Index beat technique was used to measure GLS in 10 patients with atrial fibrillation (AF). This method has been validated and well described by Kusunose et al[28] and Su et al[29] as a reliable way to assess GLS in patients with AF. Previous studies have demonstrated that healthy individuals have GLS ranging from -16 to -19% [30,31]. A cut off at -16% has been shown to provide important risk stratification and prognostic value[16]. Therefore, in our study we defined impaired GLS as>-16%(a less negative value reflects a more
impaired GLS).
Follow-up
Follow-up was obtained by clinic review, or for patients living remotely, by telephone contact and Australia and New Zealand Dialysis and Transplant (ANZDATA) Registry review. Record was made of those patients who had undergone renal transplantation and those who remained on renal dialysis. All-cause mortality was defined as death from any cause. Average length of follow up was 7.8± 4.4 years. Deceased patients were identified from the medical records at Princess Alexandra Hospital, Brisbane, Australia and ANZDATA registry and were matched according to first name, last name, identification number and date of birth. Individuals with in-complete data were contacted through general practitioners or telephone interview with their families and were excluded if data was missing (17 patients). One hundred and twelve deceased patients were identified. All other patients were considered to be alive at the end of the follow-up period. Cause of cardiac death was reported by the patient’s attending nephrologist accord-ing to the followaccord-ing categories: myocardial ischemia (presumed), myocardial ischemia/infarc-tion, cardiac failure, cerebrovascular accident and sudden cardiac death [including arrhythmia and cardiac arrest (cause uncertain, whether in or out of hospital)]. Forty six cardiac deaths were identified.
Statistical analysis
Baseline characteristics at the entry of the study were expressed as frequencies and percentages for categorical variables, mean±standard deviation (SD) for continuous, normally distributed variables and median [interquartile range] for continuous, non-normally distributed variables. The relationship between GLS and variables of interest were assessed using Pearson correlation coefficients for continuous normally distributed variables and Spearman’s correlation for cate-gorical or non–normally distributed data.
baseline demographic, biochemical, echocardiographic parameters and the clinical outcomes of CV and all-cause mortality. Cox proportionate hazard models were used to determine signif-icant predictors of all-cause and CV mortality. Multivariate regression analysis included all univariate variables with p<0.1 and with adjustment for systolic BP as a lockterm. Systolic BP
has been shown to be a relevant source of variation to GLS readings[32]. Treatment allocation for the LANDMARK 1 study was included in this analysis.
To further compare the predictive value of EF and GLS, nested cox models with separate ad-dition of EF and GLS to a baseline model containing significant demographic and biochemical co-variates were constructed. The independence and incremental value of each measure of LV function over baseline was assessed using likelihood-ratio tests. Model discrimination was fur-ther assessed using Harrell’s C-statistic[33]. Interaction terms were examined for GLS and other significant predictors of mortality. Proportional hazards assumptions were assessed graphically and by formal tests including Schoenfeld’s test. Data were analyzed using Stata (version 12; StataCorp LP, College Station, Tx). P values less than 0.05 were considered statisti-cally significant for all described analyses.
Sensitivity analyses
Competing-risks regression was performed to adjust for renal transplantation during follow-up as a competing risk in the survival analyses. As the definition of preserved EF has been vari-ably classified as either>45% or>50%[34], mortality rates and survival estimates were also
calculated using an EF cut-off of 45%.
Results
Clinical and echocardiographic characteristics
183 patients were followed up for an average length of 7.8 ± 4.4 years. The clinical and echocar-diographic characteristics of patients are presented inTable 1. Participants were predominantly male with a mean age of 55±15 years and had a high prevalence of hypertension, hypercholes-terolemia and history of smoking. At baseline, 40% were receiving hemodialysis and 23% were receiving peritoneal dialysis and 37% of patients had not yet commenced renal replacement therapy. During the follow-up period, 38% of the total study population received a renal trans-plant and 75% of patients with stage 4/5 CKD at baseline commenced dialysis. The median du-ration on dialysis during follow-up was 1.8 years (Interquartile Range of 0.5–4.0). In this cohort, mean EF was 45 ± 11% and mean GLS was -13.6 ± 4.3%. There were no differences in GLS value between patients with stage 4/5 CKD (mean GLS-13.9 ± 4.3) compared to those es-tablished on dialysis (mean GLS -13.4 ± 4.3, p = 0.4). Left ventricular hypertrophy (LVH) was identified in 53% of the study population. GLS was significantly correlated with EF (r = -0.6, p<0.001) and LVMI (r = 0.3, p<0.001) at baseline.
Association of GLS and EF with all-cause and CV mortality
Table 1. Baseline characteristics of 183 participants.
Variable Mean (±SD) or number (%)
Age (years) 55±15
Male 105(57%)
Diabetes mellitus 52(28%)
Hypertension 165(90%)
Smoking (current or former) 92(51%)
Hypercholesterolemia 98(54%)
Previous cardiovascular events 82(45%)
Body mass index (BMI) (kg/m2) 27±5
Blood Pressure (BP)
Systolic BP (mmHg) 145±22
Diastolic BP (mmHg) 82±13
Causes of renal disease
Diabetic nephropathy 41(22%)
Chronic GN 44(24%)
Renovascular /hypertensive nephrosclerosis 15(8%)
Reflux nephropathy 12(7%)
Adult Polycystic Kidney Disease (ADPKD) 18(10%)
Others 34(19%)
Unknown 19(10%)
Renal factors
Stage 4/5 CKD (GFR<30ml/min) 68(37%)
Hemodialysis 73(40%)
Peritoneal Dialysis 42(23%)
Duration of dialysis (y)(median and IQR) 1.8(0.5–4.0)
Received Renal Transplant 70(38%)
Biochemistry
Corrected Calcium (mmol/L) 2.4±0.2
Phosphate (mmol/L) 1.8±0.5
Parathyroid Hormone (pmol/L) (median and IQR) 30(14.5–59)
Albumin(g/L) 38±5.2
Hemoglobin(g/L) 109±15
Medication
ACE inhibitor 73(40%)
Β—Blocker 60(33%)
Calcium channel blocker 85(46%)
Cholesterol lowering agent 102(56%)
Echocardiographic characteristics
LV end diastolic volume (mm) 140±48
LV end systolic volume (mm) 79±37
LV mass index (g/m2.7) 55±17
LV hypertrophy (LVMI>51 g/m2.7) 87(53%)
LV meridional systolic wall stress (dynes/cm2x1000) 149.8±48.5
Ejection Fraction (%) 45±11
Global Longitudinal Strain (%) -13.6±4.3
SD = standard deviation; CKD = chronic kidney disease; LV = left ventricular; LVMI = left ventricular mass index; GN = glomerulonephritis; ACE = angiotensin converting enzyme
according to GLS (-16% and>-16%) and EF (50% and<50%) respectively are reported in
Figs1and2. Importantly, impaired GLS (>-16%) was associated with increased all-cause [log
rankχ2= 4.6, Hazard Ratio (HR) 1.60 95% Confidence Interval (CI) 1.04–2.47), p = 0.03] and CV mortality (log rankχ2= 7.0, HR 2.83 95% CI 1.26–6.32 p = 0.01) compared with preserved GLS. In contrast, EF was not predictive of all-cause or CV deaths.
Predictors of all-cause and CV mortality
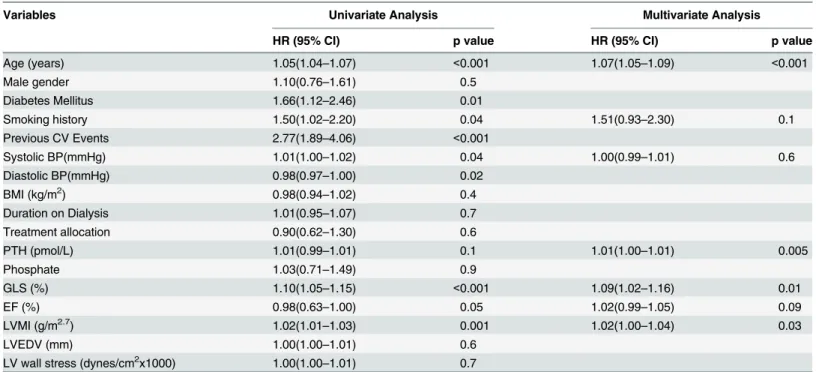
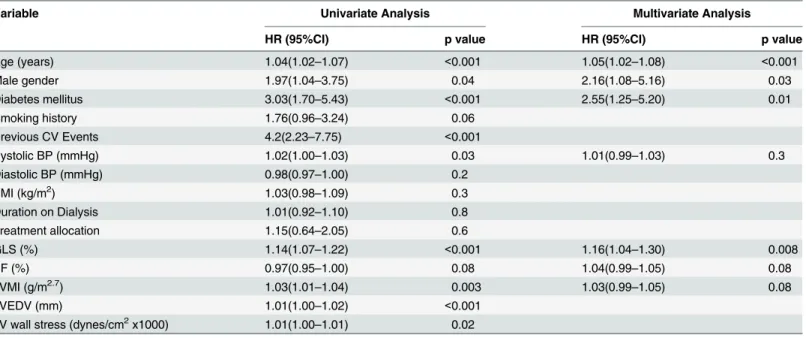
The univariate predictors of all–cause mortality were age, diabetes mellitus, smoking history, previous cardiovascular events, systolic and diastolic blood pressure (BP), GLS and LV mass index (LVMI) (Table 3). CV deaths were associated with age, male gender, diabetes mellitus, previous cardiovascular events, systolic BP, LV wall stress, LVEDV, LVMI and GLS (Table 4). Following adjustment with multivariable analysis, worsening GLS remained a significant pre-dictor of all-cause mortality (HR 1.09 95% CI 1.02–1.16 p = 0.01) and CV mortality (HR 1.16 95% CI 1.04–1.30, p = 0.008). In these analyses, preload and afterload indices of LVEDV and LV wall stress were included to further elucidate loading effects on GLS.
The predictive power of GLS and EF was also assessed in separate nested Cox models to ob-tain additional prognostic information on each measure of LV function. Models adding EF or GLS to baseline models with relevant demographic and biochemical variables were compared (Figs3and4). Addition of EF resulted in a very modest increase in predictive power [All-cause mortality modelχ270.7 to 71.6 (p = 0.3); CV mortality modelχ237.5 to 38.7 (p = 0.3)]. In con-trast, addition of GLS resulted in a significantly greater increase in predictive power for both all-cause (modelχ270.7 to 80.5 p = 0.002) (Fig 3) and CV mortality (modelχ237.5 to 47.4,
Table 2. CV and all-cause mortality rates according to LV function.
Event Rate per 100 Person-Years (95%CI)
Preserved GLS Impaired GLS IRR, p value PreservedEF Impaired EF IRR, p Value
All-cause mortality 5.6(3.8–8.1) 9.0(7.3–11.2) 1.6(1.0–2.6),0.01 7.4(5.3–10.3) 8.1(6.5–10.1) 1.0(0.7–1.7),0.3 CV mortality 1.4(0.7–3.0) 4.1(3.0–5.7) 2.9(1.3–7.6),0.003 2.7(1.5–4.6) 3.5(2.5–4.9) 0.2(0.7–2.7),0.2
CV = cardiovascular; GLS = global longitudinal strain; EF = ejection fraction; IRR = incidence rate ratio
doi:10.1371/journal.pone.0127044.t002
Fig 1. (a +b).Kaplan Meier all-cause survival estimates according to GLS (a) and EF (b).
p = 0.002)(Fig 4). Similarly, discriminatory analysis with c-statistics showed the addition of GLS to baseline models improved risk prediction of all-cause mortality [0.727(95% CI 0.674–
0.780) to 0.736 (95% CI 0.684–0.789)] and CV mortality [0.760 (95% CI 0.693–0.827) to 0.790 (95% CI 0.727–0.853)].
Prognostic value of GLS in patients with preserved EF
A total of 62 patients (34%) had EF50% (mean age 56± 15 years and 61% men). 51% of pa-tients in this subgroup had impaired GLS (mean GLS -15.8± 3.8%). In univariate analysis, GLS
Fig 2. (a +b).Kaplan Meier CV survival estimates according to GLS (a) and EF (b).
doi:10.1371/journal.pone.0127044.g002
Table 3. Cox univariate and multivariate regression analyses for predictors of all-cause mortality.
Variables Univariate Analysis Multivariate Analysis
HR (95% CI) p value HR (95% CI) p value
Age (years) 1.05(1.04–1.07) <0.001 1.07(1.05–1.09) <0.001
Male gender 1.10(0.76–1.61) 0.5
Diabetes Mellitus 1.66(1.12–2.46) 0.01
Smoking history 1.50(1.02–2.20) 0.04 1.51(0.93–2.30) 0.1
Previous CV Events 2.77(1.89–4.06) <0.001
Systolic BP(mmHg) 1.01(1.00–1.02) 0.04 1.00(0.99–1.01) 0.6
Diastolic BP(mmHg) 0.98(0.97–1.00) 0.02
BMI (kg/m2) 0.98(0.94–1.02) 0.4
Duration on Dialysis 1.01(0.95–1.07) 0.7
Treatment allocation 0.90(0.62–1.30) 0.6
PTH (pmol/L) 1.01(0.99–1.01) 0.1 1.01(1.00–1.01) 0.005
Phosphate 1.03(0.71–1.49) 0.9
GLS (%) 1.10(1.05–1.15) <0.001 1.09(1.02–1.16) 0.01
EF (%) 0.98(0.63–1.00) 0.05 1.02(0.99–1.05) 0.09
LVMI (g/m2.7) 1.02(1.01
–1.03) 0.001 1.02(1.00–1.04) 0.03
LVEDV (mm) 1.00(1.00–1.01) 0.6
LV wall stress (dynes/cm2x1000) 1.00(1.00
–1.01) 0.7
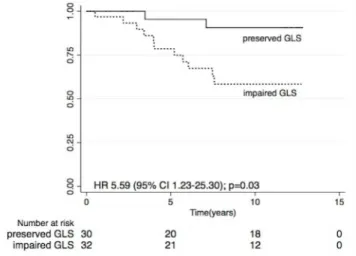
was associated with increased cardiac death (HR 1.24 95% CI 1.04–1.49, p = 0.02) and impaired GLS was associated with a 5.6 fold increase in CV mortality (HR 5.59 95% CI 1.23–25.30, p = 0.03) in participants with preserved EF (Fig 5). However, there was no association between GLS and overall mortality in this subgroup. Due to the limited number of patients and events, we did not proceed to evaluate the independent association of GLS and CV mortality with mul-tiple regression models.
Table 4. Cox univariate and multivariate regression analyses for predictors of cardiovascular mortality.
Variable Univariate Analysis Multivariate Analysis
HR (95%CI) p value HR (95%CI) p value
Age (years) 1.04(1.02–1.07) <0.001 1.05(1.02–1.08) <0.001
Male gender 1.97(1.04–3.75) 0.04 2.16(1.08–5.16) 0.03
Diabetes mellitus 3.03(1.70–5.43) <0.001 2.55(1.25–5.20) 0.01
Smoking history 1.76(0.96–3.24) 0.06
Previous CV Events 4.2(2.23–7.75) <0.001
Systolic BP (mmHg) 1.02(1.00–1.03) 0.03 1.01(0.99–1.03) 0.3
Diastolic BP (mmHg) 0.98(0.97–1.00) 0.2
BMI (kg/m2) 1.03(0.98–1.09) 0.3
Duration on Dialysis 1.01(0.92–1.10) 0.8
Treatment allocation 1.15(0.64–2.05) 0.6
GLS (%) 1.14(1.07–1.22) <0.001 1.16(1.04–1.30) 0.008
EF (%) 0.97(0.95–1.00) 0.08 1.04(0.99–1.05) 0.08
LVMI (g/m2.7) 1.03(1.01
–1.04) 0.003 1.03(0.99–1.05) 0.08
LVEDV (mm) 1.01(1.00–1.02) <0.001
LV wall stress (dynes/cm2x1000) 1.01(1.00
–1.01) 0.02
Abbreviations as explained above
doi:10.1371/journal.pone.0127044.t004
Fig 3. All-cause mortality: Comparing incremental value of EF and GLS to relevant demographic and biochemical variables (baseline model: age, diabetes mellitus, previous cardiovascular event, smoking history, systolic BP, diastolic BP, PTH).
Sensitivity analyses
Sensitivity analysis using a competing risk regression model was used to delineate the con-founding effect of renal transplantation on the outcomes. The association between GLS and all-cause and CV mortality remained after accounting for renal transplantation as a competing risk [all-cause mortality; GLS HR: 1.10 (95% CI 1.05–1.15) p<0.0001, CV mortality; HR: 1.14
(95% CI 1.05–1.24) p<0.01]. Mortality rates, incident rate ratios and survival estimates were
also repeated with an EF cut-off value of 45%. There was no difference in overall and CV sur-vival outcomes if patients had EF<45% versus EF45%.
Discussion
The present study demonstrated that worsening GLS was independently associated with a higher all-cause and CV mortality in patients with Stage 4, 5 and 5D CKD. The predictive
Fig 4. CV mortality: Comparing incremental value of EF and GLS to relevant demographic and biochemical variables (baseline model: age, gender, diabetes mellitus, smoking history, previous cardiovascular events, systolic BP).
doi:10.1371/journal.pone.0127044.g004
Fig 5. Kaplan Meier CV survival estimates according to GLS in patients with preserved EF.
value of GLS for survival was superior to other established CV risk factors and without con-founding effects of receiving renal transplant. Our study also identified an association between impaired GLS (>-16%) and adverse CV outcome in patients with preserved left ventricular EF.
Few studies have assessed the prognostic value of myocardial strain assessment in CKD. We previously reported the relationship between GLS with renal impairment and all-cause mortali-ty and found that GLS was a sensitive discriminator over significant clinical risk factors in pre-dicting all-cause mortality[19]. In a cohort of 88 stable hemodialysis patients with preserved EF and a mean follow-up of 25.6 ± 9.9 months, Liu et al found an independent association be-tween impaired GLS and all-cause mortality[35]. More recently, Kramann et al demonstrated the ability of strain parameters to identify uremic cardiomyopathy and predict CV mortality in dialysis patients[20]. The current study had a more inclusive cohort encompassing stable he-modialysis, peritoneal dialysis and pre-dialysis stage 4 and 5 CKD patients and involved a much longer duration of follow-up. This study not only confirmed the independent relation-ship between GLS with CV and all-cause mortality in patients with CKD but also highlights the effect of GLS on survival is independent and additive to established prognostic parameters such as EF and LVMI. Several observational and prospective studies in unselected populations with heart failure, myocardial infarction and cardiomyopathy[13–15,17,36] have identified prognostic value and superior risk stratification of GLS compared to EF [37]. In a recent study by Ersboll et al who assessed 548 patients with acute myocardial infarction (MI) within 48 hours of admission, GLS outperformed EF and biochemical measurement of N-terminal pro-brain natriuretic peptide, in predicting in-hospital heart failure[36]. In addition, these investi-gators have emphasized the independent prognostic value of GLS in predicting CV death and HF in patients with preserved EF[15,36]. In a high-risk population with advanced CKD, our study found that impaired GLS was associated with an unadjusted 5.6-fold increased risk for CV mortality in patients with preserved EF. This intriguing finding warrants further evaluation as our observation was limited by a small number of participants in this subgroup. Further-more, as HF is a common cause of CV death in patients with HF with preserved EF[38,39], the ability to risk stratify these patients and compare GLS with other parameters of LV function re-quires further investigation with larger studies.
Another interesting finding of the current study is that 51% of patients with normal EF had impaired strain. Emerging evidence from general population studies has identified similar sys-tolic abnormalities in patients with preserved EF. Ternacle et al found 40% of patients with pre-served EF (defined as50%) had an abnormal GLS (defined as>-16%)[16] in patients
undergoing pre-operative assessment for cardiac surgery. Similarly, patients with heart failure and preserved ejection fraction (HFpEF) were shown to have significantly lower GLS compared to a control population[40]. Although GLS and EF are highly correlated, they measure different aspects of the myocardial deformation. EF predominantly quantifies radial contraction and GLS represents the function of subendocardial longitudinal myocardial fibres that are more sensitive to reduced coronary perfusion and increased wall stress.[41,42]. GLS not only pro-vides quantitative assessment of myocardial function but also reflects changes in the myocardi-al interstitium including extent of myocardimyocardi-al fibrosis[20,43]. CKD is a unique risk factor for cardiac remodelling; animal models have demonstrated that early subendocardial changes are significantly worse in CKD compared to non-CKD rats following similar cardiac insults[44]. CKD specific disturbances such as hyperuricemia, abnormal bone mineral metabolism, pres-sure and volume overload have been shown to drive these mechanistic changes[45,46].
study, we adjusted for potential confounding effects of loading on strain by including LVEDV, LV wall stress and systolic BP. Variation in GLS measurements due to loading conditions among dialysis patients should be further examined. Nevertheless, GLS may yield greater de-tection of early LV dysfunction in patients with CKD.
This study has a number of strengths. It represents the largest study involving stable patients with advanced CKD (CKD 4/5, hemodialysis and peritoneal dialysis) to evaluate the prognostic significance of GLS and the study had a long follow-up of 7.8 ± 4.4 years. However the results of this study warrant careful interpretation due to some limitations: 1) we were unable to con-duct a subgroup analysis according to stages of CKD or dialysis modality due to the relative small sample sizes in each group; 2) previous studies have shown relationship between EF and clinical outcomes[1], however in this study there was no differences in mortality between sub-jects with preserved and impaired EF. This discrepancy could be due to our sample size; 3) pre-vious studies have also shown that diastolic dysfunction occurs in early stages of CKD and can predict adverse outcome[49,50]; however in this study we did not have measures of diastolic function in majority of patients to directly compare prognostic relevance of systolic and dia-stolic function.; 4) we only conducted univariate analysis in patients with preserved EF due to the small number of events in this subset. Additional studies are required to identify the prog-nostic utility of GLS in CKD patients with diastolic dysfunction and in patients with preserved EF; 5) even though we adjusted for a large number of patient characteristics, the possibility of residual confounding also cannot be excluded; 6) we used resting echocardiogram and were unable to identify inducible ischemia as one of the predictors of mortality; 7) inter-vendor vari-ability can affect GLS measurements, thus the prognostic value of GLS shown here may be lim-ited to the equipment used in this study.
In conclusion, the present study demonstrated that GLS is associated with all-cause and car-diovascular mortality among patients with advanced CKD. Studies of larger populations in CKD are required to confirm that GLS provides additive prognostic value in patients with pre-served EF.
Author Contributions
Conceived and designed the experiments: RK NI CH TS TM BH. Performed the experiments: NI TS RL BH MB. Analyzed the data: RK NI CH EP TS. Contributed reagents/materials/analy-sis tools: RK NI CH EP TS RL BH MB TM. Wrote the paper: RK NI CH EP TS RL BH MB TM.
References
1. Yamada S, Ishii H, Takahashi H, Aoyama T, Morita Y, Kasuga H, et al. Prognostic value of reduced left ventricular ejection fraction at start of hemodialysis therapy on cardiovascular and all-cause mortality in end-stage renal disease patients. Clin J Am Soc Nephrol. 2010; 5(10):1793–8. Epub 2010/07/03. doi:
10.2215/CJN.00050110CJN.00050110 [pii]. PMID:20595691; PubMed Central PMCID: PMC2974379.
2. Payne J, Sharma S, De Leon D, Lu JL, Alemu F, Balogun RA, et al. Association of echocardiographic abnormalities with mortality in men with non-dialysis-dependent chronic kidney disease. Nephrol Dial Transplant. 2012; 27(2):694–700. Epub 2011/05/27. doi:10.1093/ndt/gfr282gfr282 [pii]. PMID:
21613387; PubMed Central PMCID: PMC3350343.
3. Stallworthy EJ, Pilmore HL, Webster MW, Sidhu KK, Curry EM, Brown P, et al. Do Echocardiographic Parameters Predict Mortality in Patients With End-Stage Renal Disease? Transplantation. 2013. Epub 2013/04/02. doi:10.1097/TP.0b013e31828dbbbePMID:23542473.
4. Edwards NC, Hirth A, Ferro CJ, Townend JN, Steeds RP. Subclinical abnormalities of left ventricular myocardial deformation in early-stage chronic kidney disease: the precursor of uremic cardiomyopa-thy? J Am Soc Echocardiogr. 2008; 21(12):1293–8. Epub 2008/12/02. doi:10.1016/j.echo.2008.09. 013S0894-7317(08)00545-2 [pii]. PMID:19041571.
Transplant. 2006; 21(1):125–32. Epub 2005/10/14. doi: gfi075 [pii] doi:10.1093/ndt/gfi075PMID:
16221719.
6. Park M, Hsu CY, Li Y, Mishra RK, Keane M, Rosas SE, et al. Associations between kidney function and subclinical cardiac abnormalities in CKD. Journal of the American Society of Nephrology: JASN. 2012; 23(10):1725–34. Epub 2012/09/01. doi:10.1681/ASN.2012020145PMID:22935481; PubMed Central PMCID: PMC3458463.
7. Foley RN, Parfrey PS, Harnett JD, Kent GM, Martin CJ, Murray DC, et al. Clinical and echocardiograph-ic disease in patients starting end-stage renal disease therapy. Kidney Int. 1995; 47(1):186–92. Epub 1995/01/01. PMID:7731145.
8. Wang AY, Lam CW, Chan IH, Wang M, Lui SF, Sanderson JE. Sudden cardiac death in end-stage renal disease patients: a 5-year prospective analysis. Hypertension. 2010; 56(2):210–6. Epub 2010/07/ 08. doi:10.1161/HYPERTENSIONAHA.110.151167HYPERTENSIONAHA.110.151167 [pii]. PMID:
20606110.
9. Jenkins C, Bricknell K, Chan J, Hanekom L, Marwick TH. Comparison of two- and three-dimensional echocardiography with sequential magnetic resonance imaging for evaluating left ventricular volume and ejection fraction over time in patients with healed myocardial infarction. Am J Cardiol. 2007; 99 (3):300–6. Epub 2007/01/31. doi: S0002-9149(06)02051-0 [pii] doi:10.1016/j.amjcard.2006.08.026
PMID:17261386.
10. Otterstad JE, Froeland G, St John Sutton M, Holme I. Accuracy and reproducibility of biplane two-di-mensional echocardiographic measurements of left ventricular dimensions and function. European heart journal. 1997; 18(3):507–13. Epub 1997/03/01. PMID:9076390.
11. Amundsen BH, Helle-Valle T, Edvardsen T, Torp H, Crosby J, Lyseggen E, et al. Noninvasive myocar-dial strain measurement by speckle tracking echocardiography: validation against sonomicrometry and tagged magnetic resonance imaging. J Am Coll Cardiol. 2006; 47(4):789–93. Epub 2006/02/21. doi: S0735-1097(05)02750-6 [pii] doi:10.1016/j.jacc.2005.10.040PMID:16487846.
12. Belghitia H, Brette S, Lafitte S, Reant P, Picard F, Serri K, et al. Automated function imaging: a new op-erator-independent strain method for assessing left ventricular function. Archives of cardiovascular dis-eases. 2008; 101(3):163–9. Epub 2008/05/15. PMID:18477943.
13. Cho GY, Marwick TH, Kim HS, Kim MK, Hong KS, Oh DJ. Global 2-dimensional strain as a new prog-nosticator in patients with heart failure. J Am Coll Cardiol. 2009; 54(7):618–24. Epub 2009/08/08. doi: S0735-1097(09)01742-2 [pii] doi:10.1016/j.jacc.2009.04.061PMID:19660692.
14. Stanton T, Leano R, Marwick TH. Prediction of all-cause mortality from global longitudinal speckle strain: comparison with ejection fraction and wall motion scoring. Circ Cardiovasc Imaging. 2009; 2 (5):356–64. Epub 2009/10/08. doi: CIRCIMAGING.109.862334 [pii] doi:10.1161/CIRCIMAGING.109. 862334PMID:19808623.
15. Ersboll M, Valeur N, Mogensen UM, Andersen MJ, Moller JE, Velazquez EJ, et al. Prediction of all-cause mortality and heart failure admissions from global left ventricular longitudinal strain in patients with acute myocardial infarction and preserved left ventricular ejection fraction. J Am Coll Cardiol. 2013; 61(23):2365–73. doi:10.1016/j.jacc.2013.02.061PMID:23563128.
16. Ternacle J, Berry M, Alonso E, Kloeckner M, Couetil JP, Rande JL, et al. Incremental value of global longitudinal strain for predicting early outcome after cardiac surgery. Eur Heart J Cardiovasc Imaging. 2013; 14(1):77–84. Epub 2012/08/16. doi:10.1093/ehjci/jes156jes156 [pii]. PMID:22893712.
17. Saito M, Okayama H, Yoshii T, Higashi H, Morioka H, Hiasa G, et al. Clinical significance of global two-dimensional strain as a surrogate parameter of myocardial fibrosis and cardiac events in patients with hypertrophic cardiomyopathy. Eur Heart J Cardiovasc Imaging. 2012; 13(7):617–23. Epub 2012/01/25. doi:10.1093/ejechocard/jer318jer318 [pii]. PMID:22271116.
18. Bartko PE, Heinze G, Graf S, Clavel MA, Khorsand A, Bergler-Klein J, et al. Two-dimensional strain for the assessment of left ventricular function in low flow-low gradient aortic stenosis, relationship to hemo-dynamics, and outcome: a substudy of the multicenter TOPAS study. Circ Cardiovasc Imaging. 2013; 6 (2):268–76. doi:10.1161/CIRCIMAGING.112.980201PMID:23275349.
19. Krishnasamy R, Isbel NM, Hawley CM, Pascoe EM, Leano R, Haluska BA, et al. The association be-tween left ventricular global longitudinal strain, renal impairment and all-cause mortality. Nephrol Dial Transplant. 2014. Epub 2014/02/12. doi:10.1093/ndt/gfu004PMID:24516227.
20. Kramann R, Erpenbeck J, Schneider RK, Rohl AB, Hein M, Brandenburg VM, et al. Speckle Tracking Echocardiography Detects Uremic Cardiomyopathy Early and Predicts Cardiovascular Mortality in ESRD. Journal of the American Society of Nephrology: JASN. 2014. doi:10.1681/ASN.2013070734
PMID:24700873.
cardiovascular function. American heart journal. 2006; 151(3):745–53. Epub 2006/03/01. doi:10.1016/ j.ahj.2005.06.017PMID:16504645.
22. Cockcroft DW, Gault MH. Prediction of creatinine clearance from serum creatinine. Nephron. 1976; 16 (1):31–41. PMID:1244564.
23. Lang RM, Bierig M, Devereux RB, Flachskampf FA, Foster E, Pellikka PA, et al. Recommendations for chamber quantification: a report from the American Society of Echocardiography's Guidelines and Standards Committee and the Chamber Quantification Writing Group, developed in conjunction with the European Association of Echocardiography, a branch of the European Society of Cardiology. J Am Soc Echocardiogr. 2005; 18(12):1440–63. Epub 2005/12/27. doi: S0894-7317(05)00983-1 [pii] doi:10. 1016/j.echo.2005.10.005PMID:16376782.
24. Swedberg K, Cleland J, Dargie H, Drexler H, Follath F, Komajda M, et al. Guidelines for the diagnosis and treatment of chronic heart failure: executive summary (update 2005): The Task Force for the Diag-nosis and Treatment of Chronic Heart Failure of the European Society of Cardiology. European heart journal. 2005; 26(11):1115–40. Epub 2005/05/20. doi: ehi204 [pii] doi:10.1093/eurheartj/ehi204PMID:
15901669.
25. McMurray JJ, Adamopoulos S, Anker SD, Auricchio A, Bohm M, Dickstein K, et al. ESC Guidelines for the diagnosis and treatment of acute and chronic heart failure 2012: The Task Force for the Diagnosis and Treatment of Acute and Chronic Heart Failure 2012 of the European Society of Cardiology. Devel-oped in collaboration with the Heart Failure Association (HFA) of the ESC. European heart journal. 2012; 33(14):1787–847. Epub 2012/05/23. doi:10.1093/eurheartj/ehs104PMID:22611136.
26. de Simone G, Daniels SR, Devereux RB, Meyer RA, Roman MJ, de Divitiis O, et al. Left ventricular mass and body size in normotensive children and adults: assessment of allometric relations and impact of overweight. J Am Coll Cardiol. 1992; 20(5):1251–60. Epub 1992/11/01. doi: 0735-1097(92)90385-Z [pii]. PMID:1401629.
27. Wilson JR, Reichek N, Hirshfeld J. Noninvasive assessment of load reduction in patients with asymp-tomatic aortic regurgitation. The American journal of medicine. 1980; 68(5):664–74. PMID:6769329.
28. Kusunose K, Yamada H, Nishio S, Tomita N, Hotchi J, Bando M, et al. Index-beat assessment of left ventricular systolic and diastolic function during atrial fibrillation using myocardial strain and strain rate. Journal of the American Society of Echocardiography: official publication of the American Society of Echocardiography. 2012; 25(9):953–9. doi:10.1016/j.echo.2012.06.009PMID:22763085.
29. Su HM, Lin TH, Hsu PC, Lee WH, Chu CY, Lee CS, et al. Global left ventricular longitudinal systolic strain as a major predictor of cardiovascular events in patients with atrial fibrillation. Heart. 2013; 99 (21):1588–96. doi:10.1136/heartjnl-2013-304561PMID:24014280.
30. Marwick TH, Leano RL, Brown J, Sun JP, Hoffmann R, Lysyansky P, et al. Myocardial strain measure-ment with 2-dimensional speckle-tracking echocardiography: definition of normal range. JACC Cardio-vasc Imaging. 2009; 2(1):80–4. Epub 2009/04/10. doi:10.1016/j.jcmg.2007.12.007S1936-878X(08) 00412-9 [pii]. PMID:19356538.
31. Bussadori C, Moreo A, Di Donato M, De Chiara B, Negura D, Dall'Aglio E, et al. A new 2D-based meth-od for myocardial velocity strain and strain rate quantification in a normal adult and paediatric popula-tion: assessment of reference values. Cardiovascular ultrasound. 2009; 7:8. doi: 10.1186/1476-7120-7-8PMID:19216782; PubMed Central PMCID: PMC2657114.
32. Yingchoncharoen T, Agarwal S, Popovic ZB, Marwick TH. Normal ranges of left ventricular strain: a meta-analysis. J Am Soc Echocardiogr. 2013; 26(2):185–91. Epub 2012/12/12. doi:10.1016/j.echo. 2012.10.008PMID:23218891.
33. R N. Comparing the predictive power of survival models using Harrell's C or Somer's D. Stata J. 2010; 10:339–58.
34. Heart Failure Society of A, Lindenfeld J, Albert NM, Boehmer JP, Collins SP, Ezekowitz JA, et al. HFSA 2010 Comprehensive Heart Failure Practice Guideline. Journal of cardiac failure. 2010; 16(6):e1–194. Epub 2010/07/09. doi:10.1016/j.cardfail.2010.04.004PMID:20610207.
35. Liu YW, Su CT, Sung JM, Wang SP, Su YR, Yang CS, et al. Association of Left Ventricular Longitudinal Strain with Mortality among Stable Hemodialysis Patients with Preserved Left Ventricular Ejection Frac-tion. Clin J Am Soc Nephrol. 2013. doi:10.2215/CJN.10671012PMID:23704303.
36. Ersboll M, Valeur N, Mogensen UM, Andersen MJ, Moller JE, Hassager C, et al. Relationship between left ventricular longitudinal deformation and clinical heart failure during admission for acute myocardial infarction: a two-dimensional speckle-tracking study. J Am Soc Echocardiogr. 2012; 25(12):1280–9. Epub 2012/10/18. doi:10.1016/j.echo.2012.09.006PMID:23072712.
37. Kalam K, Otahal P, Marwick TH. Prognostic implications of global LV dysfunction: a systematic review and meta-analysis of global longitudinal strain and ejection fraction. Heart. 2014; 100(21):1673–80. doi:
38. Solomon SD, Wang D, Finn P, Skali H, Zornoff L, McMurray JJ, et al. Effect of candesartan on cause-specific mortality in heart failure patients: the Candesartan in Heart failure Assessment of Reduction in Mortality and morbidity (CHARM) program. Circulation. 2004; 110(15):2180–3. doi:10.1161/01.CIR. 0000144474.65922.AAPMID:15466644.
39. Zile MR, Gaasch WH, Anand IS, Haass M, Little WC, Miller AB, et al. Mode of death in patients with heart failure and a preserved ejection fraction: results from the Irbesartan in Heart Failure With Pre-served Ejection Fraction Study (I-Preserve) trial. Circulation. 2010; 121(12):1393–405. doi:10.1161/ CIRCULATIONAHA.109.909614PMID:20231531.
40. Wang J, Khoury DS, Yue Y, Torre-Amione G, Nagueh SF. Preserved left ventricular twist and circum-ferential deformation, but depressed longitudinal and radial deformation in patients with diastolic heart failure. European heart journal. 2008; 29(10):1283–9. doi:10.1093/eurheartj/ehn141PMID:18385117.
41. Buckberg G, Hoffman JI, Mahajan A, Saleh S, Coghlan C. Cardiac mechanics revisited: the relationship of cardiac architecture to ventricular function. Circulation. 2008; 118(24):2571–87. doi:10.1161/ CIRCULATIONAHA.107.754424PMID:19064692.
42. Carabello BA, Spann JF. The uses and limitations of end-systolic indexes of left ventricular function. Circulation. 1984; 69(5):1058–64. PMID:6705160.
43. Park TH, Nagueh SF, Khoury DS, Kopelen HA, Akrivakis S, Nasser K, et al. Impact of myocardial struc-ture and function postinfarction on diastolic strain measurements: implications for assessment of myo-cardial viability. American journal of physiology Heart and circulatory physiology. 2006; 290(2):H724–
31. Epub 2005/09/27. doi:10.1152/ajpheart.00714.2005PMID:16183729.
44. Bongartz LG, Braam B, Gaillard CA, Cramer MJ, Goldschmeding R, Verhaar MC, et al. Target organ cross talk in cardiorenal syndrome: animal models. Am J Physiol Renal Physiol. 2012; 303(9):F1253–
63. Epub 2012/08/24. doi:10.1152/ajprenal.00392.2012ajprenal.00392.2012 [pii]. PMID:22914779.
45. Glassock RJ, Pecoits-Filho R, Barberato SH. Left ventricular mass in chronic kidney disease and ESRD. Clin J Am Soc Nephrol. 2009; 4 Suppl 1:S79–91. Epub 2010/01/09. doi:10.2215/CJN. 048607094/Supplement_1/S79 [pii]. PMID:19996010.
46. London GM. Cardiovascular disease in chronic renal failure: pathophysiologic aspects. Semin Dial. 2003; 16(2):85–94. Epub 2003/03/19. doi: 16023 [pii]. PMID:12641870.
47. Wu B, Tsai-Pai M, Hsu H, CH. L, Chen Y. Effect of Preload Reduction by Hemodialysis on Left Ventricu-lar Mechanical Parameters by Three-Dimensional Speckle Tracking Echocardiography. Acta Cardiol Sin. 2012; 28:25–33.
48. Burns AT, La Gerche A, D'Hooge J, MacIsaac AI, Prior DL. Left ventricular strain and strain rate: char-acterization of the effect of load in human subjects. European journal of echocardiography: the journal of the Working Group on Echocardiography of the European Society of Cardiology. 2010; 11(3):283–9. doi:10.1093/ejechocard/jep214PMID:20026455.
49. Farshid A, Pathak R, Shadbolt B, Arnolda L, Talaulikar G. Diastolic function is a strong predictor of mor-tality in patients with chronic kidney disease. BMC nephrology. 2013; 14:280. doi: 10.1186/1471-2369-14-280PMID:24359445; PubMed Central PMCID: PMC3878021.
50. Otsuka T, Suzuki M, Yoshikawa H, Sugi K. Left ventricular diastolic dysfunction in the early stage of chronic kidney disease. Journal of cardiology. 2009; 54(2):199–204. doi:10.1016/j.jjcc.2009.05.002