Association Tests of Multiple Phenotypes:
ATeMP
Xiaobo Guo1,2,4, Yixi Li7, Xiaohu Ding6, Mingguang He6, Xueqin Wang1,2,4,5, Heping Zhang1,3,4*
1Department of Statistical Science, School of Mathematics & Computational Science, Sun Yat-Sen University, Guangzhou, GD 510275, China,2SYSU-CMU Shunde International Joint Research Institute, Shunde, GD 528300, China,3Department of Biostatistics, Yale University School of Public Health, New Haven, CT 06520, United States of America,4Southern China Research Center of Statistical Science, Sun Yat-Sen University, Guangzhou, GD 510275, China,5Zhongshan School of Medicine, Sun Yat-Sen University, Guangzhou, GD 510080, China,6State Key Laboratory of Ophthalmology, Zhongshan Ophthalmic Center, Sun Yat-Sen University, Guangzhou, GD 510080, China,7Peking University HSBC Business School, Shenzhen, GD 518055, China
Abstract
Joint analysis of multiple phenotypes has gained growing attention in genome-wide associ-ation studies (GWASs), especially for the analysis of multiple intermediate phenotypes which measure the same underlying complex human disorder. One of the multivariate meth-ods, MultiPhen (O’Reilly et al. 2012), employs the proportional odds model to regress a genotype on multiple phenotypes, hence ignoring the phenotypic distributions. Despite the flexibilities of MultiPhen, the properties and performance of MultiPhen are not well under-stood, especially when the phenotypic distributions are non-normal. In fact, it is well known in the statistical literature that the estimation is attenuated when the explanatory variables contain measurement errors. In this study, we first established an equivalence relationship between MultiPhen and the generalized Kendall tau association test, shedding light on why MultiPhen can perform well for joint association analysis of multiple phenotypes. Through the equivalence, we show that MultiPhen may lose power when the phenotypes are non-normal. To maintain the power, we propose two solutions (ATeMP-rn and ATeMP-or) to improve MultiPhen, and demonstrate their effectiveness through extensive simulation stud-ies and a real case study from the Guangzhou Twin Eye Study.
Introduction
Genome-wide association studies (GWASs) have emerged as a common tool for identifying the genetic variants for numerous complex diseases. The conventional GWASs focus on a sin-gle phenotype, aiming to identify the associations between sinsin-gle nucleotide polymorphisms
(SNPs) and a univariate phenotype [1–3]. However, complex human disorders, such as mental
disorders, are often characterized by multiple intermediate phenotypes [4,5]. In addition,
many phenotypes, such as body-mass-index and refractive error, are derived from other
OPEN ACCESS
Citation:Guo X, Li Y, Ding X, He M, Wang X, Zhang H (2015) Association Tests of Multiple Phenotypes: ATeMP. PLoS ONE 10(10): e0140348. doi:10.1371/ journal.pone.0140348
Editor:Zhongxue Chen, Indiana University Bloomington, UNITED STATES Received:June 19, 2015 Accepted:September 24, 2015 Published:October 19, 2015
Copyright:© 2015 Guo et al. This is an open access article distributed under the terms of theCreative Commons Attribution License, which permits unrestricted use, distribution, and reproduction in any medium, provided the original author and source are credited.
Data Availability Statement:Data are available from Figshare athttp://dx.doi.org/10.6084/m9.figshare. 1564782.
measurements [6,7]. Modeling the association between multiple phenotypes and a genetic var-iant may reveal a weak or moderate genetic association that is not apparent from single pheno-type GWASs, increasing statistical power and providing fruitful biological insights by
identifying pleiotropic variants [8–10].
In recent years we have witnessed an increasing interest in multiple phenotypes GWASs. Among the numerous multivariate methods that have been proposed, some commonly used
ones include canonical correlation analysis (CCA) [11], MANOVA [12], and the linear mixed
model [13,14]. However, these methods are highly dependent on the normality assumption,
and are known to inflate Type I error [15,16] when the phenotypic distributions deviate from
normality. To deal with this problem, MultiPhen employs the proportional odds model by modeling the genotype score as an ordinal response and the multiple phenotypes as predictors, aiming to identify a combination of phenotypes associated with the genotype. This method ignores the fact that the phenotypes are measured with uncertainty, and hence avoids the need
to make a distributional assumption on the phenotypic distributions [16]. Nonetheless,
exten-sive simulations suggest that MultiPhen is one of the most powerful multivariate methods [17].
Despite the promising performance of MultiPhen, the properties of MultiPhen are not well
understood. One exception is a recent work by Wang [18] that offered an explicit expression of
the score test statistic for MultiPhen and provided some insights into how MultiPhen works in the multiple phenotypes association analyses. Here, we prove that the score test in MultiPhen
is in fact equivalent to the generalized Kendall’s tau association test [19], and hence is really an
alternative presentation of a method established earlier. Thus, it is not surprising that Multi-Phen works well for the multivariate analysis under certain circumstances. Using the equiva-lence formula to the generalized Kendall’s tau statistic, we demonstrate that MultiPhen may have poor power when the phenotypes are non-normal. To maintain robust power, we propose two solutions to improve MultiPhen or the generalized Kendall’s tau when the phenotypes are non-normal.
The rest of this paper is organized as follows. First, we establish the equivalence between MultiPhen and the generalized Kendall’s tau association test, and demonstrate that the Muti-Phen may lose power for non-normal phenotypes. Second, we propose two association tests for multiple phenotypes (ATeMP) that perform well even when the phenotypes are non-normal. Finally, extensive simulations and real GWAS data are used to evaluate the performance of ATeMP.
1 Materials and Methods
1.1 Notation
Suppose that there arensubjects in an association study. Let (Yi,Gi) denote the observed data
of theithsubject, whereYi= (Yi1,. . .,YiK)Tis a vector ofKphenotypes of theithindividual and
Giis the genotypic score. For simplicity, we consider a single variant and the genotypic score is
coded as 0, 1, or 2, corresponding to the number of minor alleles in a biallelic locus.
1.2 MultiPhen
MultiPhen uses the proportional odds logistic regression to model the probability distribution
of an individual’s genotypeGias a function of the multiple phenotypes,
PðGigÞ ¼
1
1þexpð a 0
PK k¼1akYikÞ
; ð1Þ
Chinese Government, and the International Collaborative Research Fund from NSFC (11328103).
where theα’s are regression coefficients. Under this setting, the score test statistic is [18]
S1 ¼
1
nð1 p
0Þð1 p1Þð1 p2Þ
WTV 1
W; ð2Þ
where
W¼ ð1 p 0Þ
X
i:gi¼0
Yiþ ðp2 p0Þ
X
i:gi¼1
Yiþ ðp2 1Þ
X
i:gi¼2
Yi; ð3Þ
V ¼n 1X
n
i¼1
ðYi YÞðYi YÞ T
; ð4Þ
andp0,p1andp2 are the proportions of genotypeGwith values of 0, 1, and 2, respectively.
The statisticSfollows a chi-square distribution with degrees of freedomdf=K.
1.3 The generalized Kendall
’
s tau and the equivalence
The generalized Kendall’s tau is one of the earliest association tests for multiple phenotypes
[19]. Because it is a nonparametric test, it can be applied to a hybrid of continuous and ordinal
phenotypes. Specifically, the generalized Kendall’s tau statistic can be defined as
U¼ 2
nðn 1Þ
X
i>j
fgðGi GjÞ
f1ðYi1 Yj1Þ . . .
fKðYiK YjKÞ 0 B B @ 1 C C A
; ð5Þ
wherefg() andfk() are kernel functions. Two popular choices of the kernel function are the
identity function and the sign function. For clarity, letfgbe the sign function becauseGis in an
ordinal scale, and letfk() be the identity function. Then, statisticUcan be simplified as
U¼ 2
nðn 1Þ
X
i>j
signðGi GjÞðYi YjÞ /
Xn
i¼1
giYi; ð6Þ
where
gi¼
1
n
Xn
j¼1
signðGi;GjÞ ¼
1 p0 if G
i¼0;
p2 p0 if Gi¼1;
p2 1 if Gi¼2:
8
> <
> :
ð7Þ
Conditional on the phenotypes, the generalized Kendall’s tau test statistic can be constructed as [19]
S2 ¼U
Tvar^ ðUjYÞU ¼ ðXn i¼1
giYiÞ T
ðvar^ ðX
n
i¼1
giYiÞÞ
1
ðX
n
i¼1
giYiÞ: ð8Þ
Note thatPni¼1giYi¼Wdefined inEq (3), and as shown in the appendix,
^
varðX
n
i¼1
giYiÞ ¼ ð1 p0Þð1 p1Þð1 p2Þ
Xn
i¼1 ðYi
YÞðYi
YÞT; ð9Þ
therefore the generalized Kendall’s tau test statisticS2is equal to the score test statisticS1of
MultiPhen works well for the multiple phenotypes association studies under various circumstances.
1.4 ATeMP
The MultiPhen used the classic technique in genetic analysis [20] by conditioning on the
phe-notypes, and avoided the need to assume phenotypic distributions. However, when the pheno-types are non-normal, MultiPhen may lose power. This is more convenient to see by
examining the generalized Kendall’s tau. For example, when all phenotypes are continuous, the identity function is the most natural choice for the kernel function. It is known that this choice
is not efficient in the absence of normality [21]. To maintain the power for testing the
non-nor-mally distributed phenotypes, we introduce two solutions for association tests of multiple phe-notypes (ATeMP):
• ATeMP-rn: The idea is to replace the original phenotypes with their normalized ranks, a
common approach to transforming non-normal data [14,22]. Let (R1k, ,Rnk) be the rank
vector of thekdimensional phenotypic vector (Y1k,. . .,Ynk). Next, we can employ the inverse
normal transformation, and transformYikintoYik ¼F
1 Rik
nþ1
. Then, we apply the
Multi-Phen or equivalently generalized Kendall’s tau.
When a phenotype is in an ordinal scale, the sign function is more suitable as the kernel func-tion. And, if we assume the genetic effect is additive, the generalized Kendall’s tau statistic in
Eq (6)can be simplified as
U/X
n
i¼1
Gi
1
n
Xn
j¼1signðYi1 Yj1Þ . . .
1
n
Xn
j¼1signðYiK YjKÞ
0
B B B @
1
C C C A
; ð10Þ
which can be viewed as testing the association betweenGiand and the transformed phenotypes:
ð1
n
Xn
j¼1
signðYi1 Yj1Þ;. . .; 1
n
Xn
j¼1
signðYiK YjKÞÞ T
: ð11Þ
Note that1
n Pn
j¼1signðYik YjkÞcan be regarded as the residual corresponding toYikwhen the
kth phenotype (Y1k, ,Ynk) is ordinal [23]. Hence, we refer to this transformation as the
“ordi-nal residual transformation,”which leads to the following improvement for MultiPhen:
• ATeMP-or: For a non-normally distributed phenotype, we employ the ordinal residual
trans-formation as described above, and transformYikintoYik ¼
Pn
j¼1signðYik YjkÞ:Then, we
apply the MultiPhen or equivalently generalized Kendall’s tau.
1.5 Simulation Study 1: Bivariate Phenotypes
We conducted simulation studies to systematically evaluate the efficiency as well as the robust-ness of ATeMP. We generated bivariate traits under the bivariate linear model
Yi1¼bG1 GiþbE1 Ei; ð12Þ
whereGiis the causal variant with minor allele frequency of 0.2,Eiis a random effect, andis
the random error followingN(0,σ2). Varying the distribution ofEiamong several non-normal
distributions yields a variety of non-normal phenotypes. Specifically, we setβG1= 0.1 andβG2=
0, or 0.05, or 0.1, and considered the following different distributions forEi: (1)N(0, 1), (2)t(3),
(3)Laplace(1.5, 1) and (4)Gamma(1, 2). We chose suitable values ofβE1,βE2andσ2such that
the variances of bothYi1andYi2are equal to 1 and the between-phenotype correlation,r, varies
from -0.8 to 0.8 in an increment of 0.4.
To evaluate the statistical power, we simulated 1000 datasets under each simulation scenario above. Each simulated dataset consisted of 2000 unrelated individuals. The significance level
was fixed at 5 × 10⁻⁴. This nominal level of significance is much higher than the typical level of
significance in GWAS to reduce the computational time in simulation. However, we believe it is small enough for the purpose of comparing the power of MultiPhen, ATeMP-rn, and ATeMP-or.
We assessed the Type I error of these tests by letting MAF be 5%. 50000 datasets were
simu-lated and the significance level was set to be 5 × 10⁻⁴in this simulation study. To assess the
asymptotic approximation, we also considered relatively small sample sizes of 300 and 500.
1.6 Simulation Study 2: High Dimensional Phenotypes
To further evaluate the efficiency and robustness of ATeMP, we considered high dimensional phenotypes. The phenotypes are generated using a linear additive model
Yk¼bkGþ ffiffiffi
a
p
Ukþ ffiffiffiffiffiffiffiffiffiffiffi
1 a p
εk;k¼1; ;K; ð14Þ
where (U1, ,UK)Tfollows multivariate normal distribution with mean 0 and covariance
matrixS. A gradient of strong to low levels of correlation forSis simulated; that is,ρij= 0.8ji
−jj. Under the alternative hypothesis, we assumed that the genetic variant is associated with one
third of the phenotypes. We simulated independentεkfrom one of the following distributions:
(1)N(0, 1); (2)t(3); (3)Laplace(1.5, 1); (4)Gamma(1, 2). Finally,awas set to be 0.4 and the
number of phenotypesKwas set to be 5 and 10.
To evaluate the statistical power, we simulated 1000 datasets under each simulation scenario above. Each simulated dataset consisted of 1000 unrelated individuals. The significance level
was fixed at 5 × 10⁻⁴. The minor allele frequency of the causal variantGis set to be 0.3. The
genetic variant explains 0.3% of the phenotypic variations whenεkfollows the normal
distribu-tion, and 0.6% for the other distributions. We assessed the Type I error by simulating 50000 datasets, and the sample sizes were set to be 300, 500 and 1000.
1.7 Study of Myopia: Testing Candidate SNPs from Guangzhou Twin
Project
Here, we applied MultiPhen, ATeMP-rn, and ATeMP-or to evaluated 38 candidate SNPs
which are identified from three large GWASs [3,24,25] for refractive error. We analyzed a
dataset from the Guangzhou Twin Eye Study, which iss a population-based registry designed to examine the genetic and environmental etiologies for myopia. It was launched in 2006, and has completed eight consecutive annual follow-up examinations, with more than 1200 twin pairs participating. In brief, twins born in Guangzhou aged 7 to 15 years received annual eye examinations from 2006 and on. The protocol and examination procedures have been
pub-lished elsewhere [26]. Written, informed consent was obtained for all participants from either
Ethics Committee of Zhongshan Ophthalmic Center [26]. We focus on refractive error, which
is the most common eye disorder in the world and is the leading cause of blindness [3].
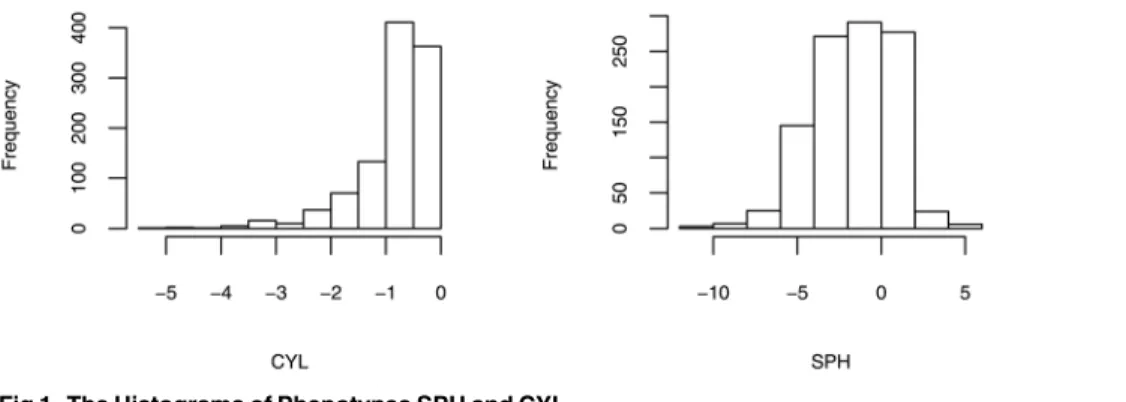
Spheri-cal lens (SPH) and cylindriSpheri-cal lens (CYL), two major intermediate traits of refractive error,
have gained increasing interest in the GWAS [27]. Borrowing the strength of the multiple
phe-notypes association studies, in this report, we are interested in the the multiple phephe-notypes
associations analysis for SPH and CYL.Fig 1displays the distributions of SPH and CYL. We
can observe that the distribution of CYL is heavily skewed, suggesting that transformed pheno-types would be preferrable before performing the association tests. Specifically, we employed both the inverse normal transformation and the ordinal residual transformation for CYL and SPH.
The current data are from the Guangzhou Twin Eye Study. A detailed description has been
published elsewhere [26]. The GWAS data included 1055 individuals from the first-born twins.
Age and gender were considered as covariates.
2 Results
2.1 Simulation Studies of Statistical Power and Type I Error
Fig 2presents the power comparison under different simulation settings for bivariate
pheno-types. We can learn fromFig 2that MultiPhen can lose a great deal of power when the
pheno-types are non-normal. The loss is more severe, as shown inFig 2, when the phenotypes are
heavily skewed such as from the Gamma distribution. However, ATeMP-rn and ATeMP-or
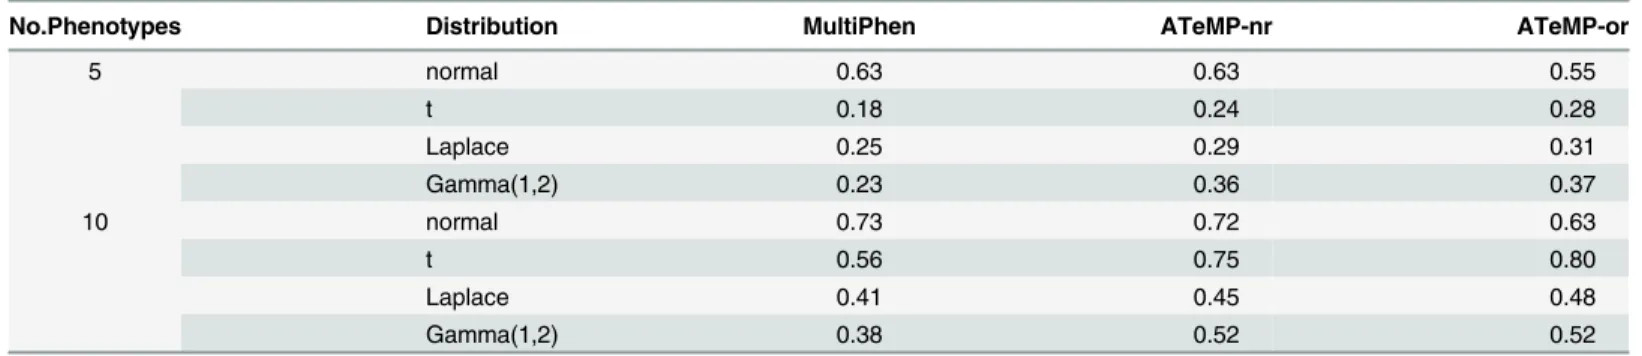
can recover the loss.Table 1displays the results of power comparisons under different
simula-tion settings when the number of phenotypes are five and ten. Similarly to the power compari-son for bivariate phenotypes, ATeMP-rn and ATeMP-or can recover the power loss when the phenotypes are non-normal. These simulations confirm that transforming non-normal pheno-types is necessary. Even though MultiPhen makes no assumption on the phenotypic distribu-tions, it does not necessarily mean that it is efficient.
To offer a practical guide, we summarize the order of superiority between different methods. When the phenotypic distribution is heavily-tailed, such as the t distribution or the Laplace dis-tribution, ATeMP-or is the most powerful approach in all of the considered simulation settings
as can be seen clearly fromFig 2andTable 1. When the phenotypic distribution is heavily
skewed, such as the Gamma distributions, ATeMP-rn is the perferred method for the bivariate phenotypes. However, the performance of ATeMP-rn and ATeMP-or is almost the same when the phenotypes are high dimensional, such as five or ten in our simulation studies.
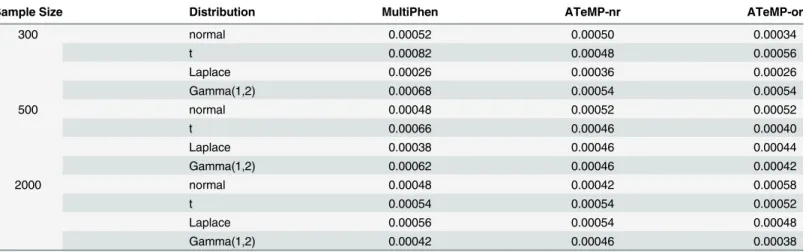
Table 2reports the Type I error rates when the nominal significance level is set to be
5 × 10⁻⁴. We can observe that the Type 1 error rates of ATeMP-rn and ATeMP-or are very
Fig 1. The Histograms of Phenotypes SPH and CYL.
close to the nominal values, indicating that these methods can control Type I error well in the
considered simulation settings. The Type 1 error rates of MultiPhen is inflated for thet
distri-bution when the sample size is 300 or 500. We do not observe inflated Type 1 error rate for
MultiPhen when the sample size is 2000.S1 Tablealso presents the Type 1 error rate when the
number of phenotypes are 5 and 10. We can observe that all methods can control Type 1 error well in the considered simulation settings, indicating that the asymptotic distribution provides an adequate approximation for high dimensional phenotypes.
Fig 2. The power of the multiple phenotypes association tests at the significance level 5 × 10⁻⁴under
different simulation settings.Different type of lines represent different methods. doi:10.1371/journal.pone.0140348.g002
Table 1. The power of the multiple phenotypes association tests at the significance level 5 × 10⁻⁴when the number of phenotypes are 5 and 10.
No.Phenotypes Distribution MultiPhen ATeMP-nr ATeMP-or
5 normal 0.63 0.63 0.55
t 0.18 0.24 0.28
Laplace 0.25 0.29 0.31
Gamma(1,2) 0.23 0.36 0.37
10 normal 0.73 0.72 0.63
t 0.56 0.75 0.80
Laplace 0.41 0.45 0.48
Gamma(1,2) 0.38 0.52 0.52
2.2 Association Study on Myopia
InTable 3, we display the SNPs with p-value<0.05 from the joint analysis. ATeMP-rn yields nearly the same results as ATeMP-or, and the most significant SNP (rs12229663 with p-value
of 4.9 × 10⁻⁴) is identified by the ATeMP-or. For the SNPs with p-value<0.01, most of the
p-values from ATeMP are smaller than those from MultiPhen, suggesting again that transform-ing phenotypes is helpful in this real data analysis. These results confirm the observations from
the simulation studies. For SNPs with p-value>0.01 (Table 3andS2 Table), there are no
apparent benefits from ATeMP.
After the Bonferroni correction, no SNPs are significant by using MultiPhen. However, ATeMP-rn or ATeMP-or identified one significant SNP rs12229663.
3 Discussion
In this report, we first pointed out and prove that a recent method for multiple phenotypes association testing, MultiPhen, is in fact equivalent to an earlier test proposed for the same pur-pose. After establishing this equivalence, we demonstrated that MultiPhen suffers from a sub-stantial loss of power when the phenotypic distributions were non-normal. This calls for the caution that the use of a distribution-free test may be convenient, but it may also be inefficient.
To recover the power loss of MultiPhen, we proposed two phenotypic transformations prior to the use of MultiPhen or the equivalent generalized Kendall’s tau. The first method, ATeMP-rn, employs the frequently used inverse normal transformation for the non-normal phenotypes
Table 2. Type I error of the multiple phenotypes association tests at the nominal significance levels of 5 × 10⁻⁴when the between-phenotype
corre-lation is 0.5 and the minor allele frequency of the tested locus is 5%.The sample sizes are set to be 300, 500 and 2000, respectively.
Sample Size Distribution MultiPhen ATeMP-nr ATeMP-or
300 normal 0.00052 0.00050 0.00034
t 0.00082 0.00048 0.00056
Laplace 0.00026 0.00036 0.00026
Gamma(1,2) 0.00068 0.00054 0.00054
500 normal 0.00048 0.00052 0.00052
t 0.00066 0.00046 0.00040
Laplace 0.00038 0.00046 0.00044
Gamma(1,2) 0.00062 0.00046 0.00042
2000 normal 0.00048 0.00042 0.00058
t 0.00054 0.00054 0.00052
Laplace 0.00056 0.00054 0.00048
Gamma(1,2) 0.00042 0.00046 0.00038
doi:10.1371/journal.pone.0140348.t002
Table 3. P-values from association tests of jointly analyzing CYL and SPH.The bold-face texts highlight where ATeMP tests may be superior to MultiPhen.
SNP MAF Gene MultiPhen ATeMP-rn ATeMP-or
rs12229663 0.45 PTPRR 2.1e-03 6.4e-04 4.9e-04
rs524952 0.42 GJD2 9.7e-03 7.5e-03 9.9e-03
rs7837791 0.48 TOX 1.8e-02 5.0e-03 2.9e-03
rs1881492 0.1 CHRNG 4.5e-02 2.3e-01 2.0e-01
rs1898585 0.36 PDE11A 4.7e-02 5.3e-02 7.9e-02
before any association test. The second method, ATeMP-or, uses a particular form of residuals
in a proportional odds model involving an ordinal response [23,28]. Extensive simulations
demonstrate that ATeMP tests can recover the power when the phenotypic distributions are heavy-tailed or highly-skewed, while MultiPhen suffers from a substantial loss of power. In addition, we also compared the power by using the permutation method rather than the
asymptotic distribution. The results (S1 Fig) indicate again that transforming phenotypes is
helpful when the phenotypic distributions are non-normal.
In our simulation studies, we observed that the power of the multivariate methods is high when the correlation of bivariate phenotypes is negative and the genetic effects on the
individ-ual phenotypes are positive. Others [13,16,29] have also noted this phenomenon that the
power increases when the correlation of the phenotypes is in opposite direction to the pheno-typic genetic effects. It can also be explained from the perspective of principle component anal-ysis [29].
We applied MultiPhen and ATeMP tests to evaluate 38 candidate SNPs from the
Guang-zhou Twin Eye Study. Five SNPs showed nominally significant p-value (p-value<0.05),
indi-cating that part of candidate SNPs of refractive error are associated with its two major intermediate traits. Our real data analysis confirmed that ATeMP tests are superior to Multi-Phen, underscoring the usefulness of transforming the non-normal phenotypes prior to associ-ation testing, despite the fact that MultiPhen is distribution-free.
Appendix: The derivation of
var
^
ð
P
n i¼1g
iY
iÞ
We first note that
Xn
i¼1
gi¼nðð1 p0Þp0 þ ðp2 p0Þð1 p0 p2ÞÞ þ ðp2 1Þp2Þ ¼0
and
^
varðg
iÞ ¼ ð1 p0Þ 2
p0 þ ðp2 p0Þ 2
ð1 p0 p2Þ þ ðp2 1Þ2p2 ¼ ð1 p
0Þð1 p1Þð1 p2Þ
sincep0þp1þp2 ¼1. Therefore,
^
varðX
n
i¼1
giYiÞ ¼var^ð
Xn
i¼1
giðYi YÞÞ
¼X
n
i¼1
ðYi YÞvar^ðgiÞðYi YÞ T
¼ ð1 p
0Þð1 p1Þð1 p2Þ
Xn
i¼1
ðYi YÞðYi YÞ T
:
Supporting Information
S1 Fig. The power of the multiple phenotypes association tests at the significance level 5 × 10⁻⁴under different simulation settings. Different types of curve represent different
methods.The simulation settings are the same as the simulation studies for bivariate pheno-types in Section 1.5. To alleviate the computational burden, the sample size was set to be 500, and the significance level was set to be 0.05.
S1 Table. Type I error of the multiple phenotypes association tests when the phenotypes are five and ten, respectively.The nominal significance level is set to be 5 × 10⁻⁴, and the sam-ple sizes are set to be 300, 500 and 100, respectively.
(XLS)
S2 Table. P-values from association tests of 38 candidate SNPs by jointly analyzing CYL and SPH.
(XLS)
Acknowledgments
Zhang’s research is partially supported by the U.S. National Institute on Drug Abuse (R01 DA016750), a 1000-plan scholarship from the Chinese Government, and the International Collaborative Research Fund from NSFC(11328103). Guo’s research is supported by the NSFC (11401600), and the Fundamental Research Funds for the Central Universities (15lgpy07). Wang’s research is partially supported by the free application projects from the SYSU-CMU Shunde International Joint Research Institute, NSFC(11271383) and Chinese Government and the International Collaborative Research Fund from NSFC(11328103).
Author Contributions
Conceived and designed the experiments: XG XW HZ. Performed the experiments: XG. Ana-lyzed the data: XG XW HZ. Contributed reagents/materials/analysis tools: YL XD MH. Wrote the paper: XG YL XD MH XW HZ.
References
1. Hunter DJ, Kraft P, Jacobs KB, Cox DG, Yeager M, Hankinson SE, et al. A genome-wide association study identifies alleles in FGFR2 associated with risk of sporadic postmenopausal breast cancer. Nature genetics. 2007; 39(7):870–874. doi:10.1038/ng2075PMID:17529973
2. Scott LJ, Mohlke KL, Bonnycastle LL, Willer CJ, Li Y, Duren WL, et al. A genome-wide association study of type 2 diabetes in Finns detects multiple susceptibility variants. science. 2007; 316 (5829):1341–1345. doi:10.1126/science.1142382PMID:17463248
3. Verhoeven VJ, Hysi PG, Wojciechowski R, Fan Q, Guggenheim JA, Höhn R, et al. Genome-wide meta-analyses of multiancestry cohorts identify multiple new susceptibility loci for refractive error and myopia. Nature genetics. 2013; 45(3):314–318. doi:10.1038/ng.2554PMID:23396134
4. Guo X, Liu Z, Wang X, Zhang H. Genetic association test for multiple traits at gene level. Genetic epide-miology. 2013; 37(1):122–129. doi:10.1002/gepi.21688PMID:23032486
5. Purcell SM, Wray NR, Stone JL, Visscher PM, O’Donovan MC, Sullivan PF, et al. Common polygenic variation contributes to risk of schizophrenia and bipolar disorder. Nature. 2009; 460(7256):748–752. doi:10.1038/nature08185PMID:19571811
6. Lavery J, Gibson J, Shaw D, Rosenthal A. Refraction and refractive errors in an elderly population. Ophthalmic and Physiological Optics. 1988; 8(4):394–396. PMID:3253631
7. Speliotes EK, Willer CJ, Berndt SI, Monda KL, Thorleifsson G, Jackson AU, et al. Association analyses of 249,796 individuals reveal 18 new loci associated with body mass index. Nature genetics. 2010; 42 (11):937–948. doi:10.1038/ng.686PMID:20935630
8. Amos C, Laing A. A comparison of univariate and multivariate tests for genetic linkage. Genetic epide-miology. 1993; 10(6):671–676. doi:10.1002/gepi.1370100657PMID:8314079
9. Schifano ED, Li L, Christiani DC, Lin X. Genome-wide association analysis for multiple continuous sec-ondary phenotypes. The American Journal of Human Genetics. 2013; 92(5):744–759. doi:10.1016/j. ajhg.2013.04.004PMID:23643383
10. Zhu W, Zhang H. Why do we test multiple traits in genetic association studies? Journal of the Korean Statistical Society. 2009; 38(1):1–10. doi:10.1016/j.jkss.2008.10.006PMID:19655045
12. Suo C, Toulopoulou T, Bramon E, Walshe M, Picchioni M, Murray R, et al. Analysis of multiple pheno-types in genome-wide genetic mapping studies. BMC bioinformatics. 2013; 14(1):151. doi:10.1186/ 1471-2105-14-151PMID:23639181
13. Korte A, Vilhjálmsson BJ, Segura V, Platt A, Long Q, Nordborg M. A mixed-model approach for genome-wide association studies of correlated traits in structured populations. Nature genetics. 2012; 44(9):1066–1071. doi:10.1038/ng.2376PMID:22902788
14. Zhou X, Stephens M. Efficient multivariate linear mixed model algorithms for genome-wide association studies. Nature methods. 2014; 11(4):407–409. doi:10.1038/nmeth.2848PMID:24531419
15. Medland SE, Neale MC. An integrated phenomic approach to multivariate allelic association. European Journal of Human Genetics. 2010; 18(2):233–239. doi:10.1038/ejhg.2009.133PMID:19707246
16. OŔeilly PF, Hoggart CJ, Pomyen Y, Calboli FC, Elliott P, Jarvelin MR, et al. MultiPhen: joint model of multiple phenotypes can increase discovery in GWAS. PLoS One. 2012; 7(5):e34861. doi:10.1371/ journal.pone.0034861
17. Galesloot TE, Van Steen K, Kiemeney LA, Janss LL, Vermeulen SH. A comparison of multivariate genome-wide association methods. PloS one. 2014; 9(4):e95923. doi:10.1371/journal.pone.0095923 PMID:24763738
18. Wang K. Testing Genetic Association by Regressing Genotype over Multiple Phenotypes. PloS one. 2014; 9(9):e106918. doi:10.1371/journal.pone.0106918PMID:25221983
19. Zhang H, Liu CT, Wang X. An association test for multiple traits based on the generalized Kendallśtau. Journal of the American Statistical Association. 2010; 105(490):473–481. doi:10.1198/jasa.2009. ap08387PMID:20711441
20. Haseman J, Elston R. The investigation of linkage between a quantitative trait and a marker locus. Behav Genet. 1972; 2:3–19. doi:10.1007/BF01066731PMID:4157472
21. Hollander M, Wolfe DA, Chicken E. Nonparametric statistical methods. John Wiley & Sons; 2013.
22. Wei C, Li M, He Z, Vsevolozhskaya O, Schaid DJ, Lu Q. A Weighted U-Statistic for Genetic Association Analyses of Sequencing Data. Genetic epidemiology. 2014; 38(8):699–708. doi:10.1002/gepi.21864 PMID:25331574
23. Li C, Shepherd BE. A new residual for ordinal outcomes. Biometrika. 2012;p. asr073.
24. Kiefer AK, Tung JY, Do CB, Hinds DA, Mountain JL, Francke U, et al. Genome-wide analysis points to roles for extracellular matrix remodeling, the visual cycle, and neuronal development in myopia. PLoS Genet. 2013; 9(2):e1003299. doi:10.1371/journal.pgen.1003299PMID:23468642
25. Cheng CY, Schache M, Ikram MK, Young TL, Guggenheim JA, Vitart V, et al. Nine loci for ocular axial length identified through genome-wide association studies, including shared loci with refractive error. The American Journal of Human Genetics. 2013; 93(2):264–277. doi:10.1016/j.ajhg.2013.06.016 PMID:24144296
26. Zheng Y, Ding X, Chen Y, He M. The Guangzhou Twin Project: An Update. Twin Research and Human Genetics. 2013; 16(01):73–78. doi:10.1017/thg.2012.120PMID:23186635
27. Li Q, Wojciechowski R, Simpson CL, Hysi PG, Verhoeven VJ, Ikram MK, et al. Genome-wide associa-tion study for refractive astigmatism reveals genetic co-determinaassocia-tion with spherical equivalent refrac-tive error: the CREAM consortium. Human genetics. 2015; 134(2):131–146. doi: 10.1007/s00439-014-1500-yPMID:25367360
28. Zhang H, Wang X, Ye Y. Detection of Genes for Ordinal Traits in Nuclear Families and a Unified Approach for Association Studies. Genetics. 2006; 172:693–699. doi:10.1534/genetics.105.049122 PMID:16219774