Magnetic fabric of Araguainha complex impact structure (Central Brazil):
Implications for deformation mechanisms and central uplift formation
E. Yokoyama
a,⁎
, R.I.F. Trindade
a, C. Lana
b, C.R. Souza Filho
c, D. Baratoux
d, Y.R. Marangoni
a, E. Tohver
e aInstituto de Astronomia, Geofísica e Ciências Atmosféricas, Universidade de São Paulo, Rua do Matão, 1226, 05508-090, BrazilbDepartamento de Geologia (DEGEO), Universidade Federal de Ouro Preto (UFOP), Ouro Preto 35400-000, Minas Gerais, Brazil cDepartamento de Geologia e Recursos Naturais, Instituto de Geociências, UNICAMP, 13083-970, Brazil
dObservatoire Midi-Pyrénées, Laboratoire Dynamique Terrestre et Planétaire, UMR 5562, CNRS & Université Paul Sabatier, 14, Avenue Edouard Belin, 31 400, Toulouse, France eTectonics Special Research Center, University of Western Australia, 35 Stirling Highway, Crawley, WA 6009, Australia
a b s t r a c t
a r t i c l e
i n f o
Article history:
Received 14 April 2011
Received in revised form 26 October 2011 Accepted 5 January 2012
Available online 18 May 2012
Editor: L. Stixrude
Keywords:
complex impact crater weakening mechanism microstructures magnetic anisotropy Araguainha
The weakening mechanisms involved in the collapse of complex impact craters are controversial. The Ara-guainha impact crater, in Brazil, exposes a complex structure of 40 km in diameter, and is an excellent object to address this issue. Its core is dominated by granite. In addition to microstructural observations, magnetic studies reveal its internal fabric acquired during the collapse phase. All granite samples exhibit impact-related planar deformation features (PDFs) and planar fractures (PFs), which were overprinted by cataclasis. Cataclastic deformation has evolved from incipient brittle fracturing to the development of discrete shear bands in the center of the structure. Fracture planes are systematically decorated by tiny grains (b10μm)
of magnetite and hematite, and the orientation of magnetic lineation and magnetic foliation obtained by the anisotropies of magnetic susceptibility (AMS) and anhysteretic remanence (AAR) are perfectly coaxial in all studied sites. Therefore, we could track the orientation of deformation features which are decorated by iron oxides using the AMS and AAR. The magnetic fabrics show a regular pattern at the borders of the cen-tral peak, with orientations consistent with the fabric of sediments at the crater's inner collar and complex in the center of the structure. Both the cataclasticflow revealed from microstructural observations and the structural pattern of the magnetic anisotropy match the predictions from numerical models of complex im-pact structures. The widespread occurrence of cataclasis in the central peak, and its orientations revealed by magnetic studies indicate that acousticfluidization likely operates at all scales, including the mineral scales. The cataclasticflow made possible by acousticfluidization results in an apparent plastic deformation at the macroscopic scale in the core.
© 2012 Elsevier B.V. All rights reserved.
1. Introduction
Impact cratering is a major geological process affecting the surface of rocky planets (French, 1998). The scars left on the Earth by the im-pact of asteroids and comets have a large range of sizes from a few meters to hundreds of kilometers. The largest impact craters exhibit a complex geometry comprising a central uplifted area that stand above aflatfloor that is in turn surrounded by annular basins and an-nular rings (e.g.,Grieve and Therriault, 2000). This morphology is ac-quired in a modification stage occurring in a short period of time after the impact (typically in the order of a few minutes). The overall ge-ometry and internal structure of these complex craters seems to be largely dependent on the composition, strength and pre-existing structures of the target rocks (e.g.,Collins et al., 2008; Lana et al., 2003), and to a lesser extent on the impact angle. Nevertheless, the
mode of target rock deformation during transient cavity collapse and central uplift formation is not well understood and is still subject of debate in the literature. Several mechanisms may account for the collapse of complex craters, including frictional melt (Dence et al., 1977), thermal softening (O'Keefe and Ahrens, 1999), acousticfl uidi-zation (Melosh, 1979; Melosh and Ivanov, 1999) and dynamic fault-ing (Senft and Stewart, 2009). All mechanisms, when incorporated in numerical models, can yield similar crater morphologies (e.g.
Collins and Wünnemann, 2005; Goldin et al., 2006; Wünnemann and Ivanov, 2003). On the other hand, the effects of these mecha-nisms can differ at the macroscopic and microscopic scales, producing different styles of structures, as well as different deformation par-titioning in the shocked rocks (i.e., penetrating vs. localized deformation).
Studies of the deformation mechanisms on complex craters are mainly based onfield mapping, structural geological data and petro-graphic descriptions. Nonetheless, a consensus about operating mechanisms during the collapse of impact craters has not been reached from these geological observations. In the past two decades,
–
⁎Corresponding author.
E-mail address:elder@iag.usp.br(E. Yokoyama).
0012-821X/$–see front matter © 2012 Elsevier B.V. All rights reserved. doi:10.1016/j.epsl.2012.01.005
Contents lists available atSciVerse ScienceDirect
Earth and Planetary Science Letters
studies of magnetic anisotropy have been widely used to understand the deformation of complex terranes (e.g., Borradaile and Henry, 1997; Sen and Mamtani, 2006; Tarling and Hrouda, 1993and refer-ences therein), but its use in characterizing the deformation of rocks in the context of an impact crater is incipient. This technique has been successfully applied to the structural analysis of the Sudbury crater (Canada). At Sudbury the fabrics of melt dikes were interpreted in terms of crater collapse mechanisms (e.g.Scott and Benn, 2002; Scott and Spray, 1999), whereas the host-rock fabrics were consid-ered to be strongly modified by the tectonic events that took place long after the impact (e.g.Hirt et al., 1993). More recently, magnetic anisotropy techniques were applied on the study of the granitic core of Vredefort crater, in South Africa (Carporzen et al., 2012). The mag-netic fabric shows in this case random directions that do not correlate with the observed magmatic or metamorphic fabrics. According to
Carporzen et al. (2012)in these rocks, random high-intensity magne-tizations resulted from lightning strikes.
In an effort to better understand the target-rock deformation during transient cavity collapse and central uplift formation, we have studied
the granitic rocks belonging to the central uplift of the Araguainha complex structure, the largest impact crater in South America (Lana et al., 2007, 2008). It is a rare example of a moderately eroded complex impact struc-ture that contains a well-exposed central uplift and two concentric annular rings (Fig. 1B). Despite a little occurrence of metamorphic rocks (phyllites), the target-rocks (granitic and sedimentary rocks) were not tectonically de-formed before the impact, and there is no post-impact deformation. Good rock exposures across the central uplift area appear therefore perfectly suited to study the central uplift deformation mechanism (Lana et al., 2008). We focus on the internal fabric of the granitic rocks (Fig. 1), revealed fromfield-based structural measurements, microscopic observations and magnetic anisotropy data, providing insights into the softening mecha-nisms operating during the collapse of complex impact craters.
2. Background
The 245 Ma Araguainha impact structure has a rim-to-rim diame-ter of about 40 km. It is located at the boundary of Mato Grosso and Goias states (16°47′S and 52°59′W), in central Brazil (Fig. 1A). The
Polymitic breccia Melt breccia d oi r e P y h pr ar git ar t S Formation p u or G SI O D A S S A P O Ã R A B U T Á N A R A P Aquidauana Furnas Irati Ponta Grossa ? á b ai u C Corumbataí Siltstone, Carbonate, Sandstone, Chert Siltstone, Carbonate, Shale, Chert TOP Sandstone, Siltstone, Diamectites BASE Sandstone, Conglomerate Siltstone, Sandstone, Conglomerate Sandstone, Conglomerate Phyllite n ai mr e P s u or efi n o br a C Impact Event (Permian/T riassic) Porphyritic Granite n air b m a c er P n ai ci v o dr O 53°07' W 53°04' W 52°54’ W
0 2.5 5 10
km Araguainha Ponte Branca Araguaia River A B
Lineaments Anticline Roads
S' 6 5° 6 1 S' 3 4° 6 1 Fig. 2 Fig. 2 NW SE (m) 700 600 500
A 5 15 25 35 B
AB CP AB
A
B
C
Towns n ai n o v e D Central Uplift CRA Paraná Basin Araguainha South America CRA CR CRFig. 1.(A) Geological map of the Araguainha impact structure; (B) simplified stratigraphic column expected inside and outside the structure; (C) NW–SE rim-to-rim cross-section, showing topography and lithological variations across the structure. CRA = crater rim area; CR = concentric rings; AB = annular basin (AB); CP = central peak.
Modified fromLana et al. (2007).
Araguainha impact is regarded as one of the most violent and cata-strophic events in the history of the Paraná Basin (Lana et al., 2006) and excavated more than 2000 m of Ordovician to Permian–Triassic sedimentary rocks down to the crystalline basement producing a structural uplift of about 2.5 km high (Fig. 1C) (e.g.,Engelhardt et al., 1992; Lana et al., 2006). Previous authors (Theilen-Willige et al., 1982;Lana et al., 2006, 2007) have divided the structural and mor-phological features of Araguainha into four domains (Fig. 1C): crater rim area (CRA); concentric rings (CR); annular basin (AB); and cen-tral peak (CP).
The crater rim area, located at 20–22 km from the center of the crater is characterized by kilometer-scale blocks with accurate geom-etry of variably deformed rocks from Passa Dois Group and Aqui-dauana Formation. These blocks are controlled by steep concentric normal faults and km-scale scale folding with vergence towards the center of the crater. Structural and remote sensing data (Thematic Mapper and ASTER) reveal an annular ring area comprising two main ring features at 10–12 km (inner collar) and 14–18 km (outer collar) from the center of the structure (Lana et al., 2007, 2008). The rings form ridges or aligned hills that surround the annular basin. Structural data collected on both the inner collar and the outer collar show a concentric pattern. Several radial faults affect the outer collar, with lateral displacements of 500 m to 2 km. The inner collar is also affected by radial faults, but with smaller lateral displacements (Lana et al., 2008).
The central uplift is characterized by a 5 km wide annular basin and a 6–7 km wide central peak described in detail byEngelhardt et al. (1992)andLana et al. (2007, 2008). The annular basin is aflat de-pression formed by sandstones and conglomerates of Ponta Grossa and Furnas Formations, situated between the concentric rings and the central peak. The central peak consists of a 4–5 km wide core of porphyritic granite and a 1–2 km wide collar of upright to overturned sediments of the Furnas Formation. Although erosion has removed much of the impact-related materials, many impact melt rocks and polymitic breccia deposits are still preserved in the central peak (e.g.,Engelhardt et al., 1992; Hammerschimidt and von Engelhardt, 1995; Lana et al., 2008). Several lines of evidence suggest a 2–
2.5 km excavation depth at the center of the Araguainha crater. These include petrographic studies ofEngelhardt et al. (1992) indi-cating temperatures in excess of 2000 °C for impact melts and pres-sures above 20 GPa in clasts of polymict breccia, as well as the stratigraphic study of target rocks inside and outside the impact structure (Lana et al., 2007) showing that the impact has affected a sedimentary column of more than 1800 m thickness and also part of the crystalline basement.
3. Samples and methods
We performed a detailed mapping of the central peak comprising 190 observational points. Thefield-based description was comple-mented by the observation under the microscope of 50 thin sections for the petrographic and microstructural characterization of the dif-ferent units in the central uplift. The previous lithological unit scheme ofEngelhardt et al. (1992)was generally followed in our work. Mag-netic studies were performed for 42 sites (Fig. 2). At each site two to four 2.5-cm-diameter oriented cores were collected with a portable rock drill and further cut into three tofive 2.2 cm in height specimens, providing a total of 387 specimens.
Our magnetic studies focus on the magnetic anisotropy of the rock, including the anisotropy of magnetic susceptibility and the an-isotropy of anhysteretic remanence magnetic susceptibility (k) re-flects how much a material is magnetized in presence of an inducing magneticfield (Tarling and Hrouda, 1993). The intensity of the induced magnetization (Mi) with respect to the inducingfield (Hi) is expressed through a second-order symmetrical tensor (k), with Mi= (k) · Hi. Note that (k) is an intrinsic property of the rock
and depends only on the magnetic properties of its constituent min-erals and their degree of alignment. The AMS is obtained by measur-ing the magnetic susceptibility of a rock sample at low magneticfields in different orientations in order to define the intensity and orienta-tion of the three principal axes kmax≥kint≥kmin. The three main axes are usually represented as an ellipsoid analogous to the strain el-lipsoid, withkmaxparallel to the‘magnetic lineation’andkminnormal to the‘magnetic foliation’(Rochette et al., 1992; Tarling and Hrouda, 1993). These magnetofabric elements are easily correlated, respec-tively, to the classical‘lineation’and‘foliation’of Structural Geology. The shape of the anisotropy ellipsoid can be described by two param-eters: the degree of anisotropy P (computed as the ratio ofkmaxto kmin), and the parameter T ofJelinek (1981), used to discriminate be-tween prolate (Tb0) and oblate ellipsoids (T > 0). In this work, the
AMS was determined for all granite samples in a KLY4S Kappabridge susceptometer (Agico Ltd.).
In addition to the AMS, we have measured the anisotropy AAR in order to isolate the anisotropy of ferromagnetic minerals (e.g.,
Jackson, 1991; Martín-Hernández and Ferré, 2007; Trindade et al., 2001a). The study of the AAR is essential to discriminate the magne-tofabric of the ferromagnetic mineral fraction. While the AMS is car-ried by all minerals in the rock (diamagnetic, paramagnetic and ferromagnetic), the AAR is carried only by the ferromagnetic fraction (i.e., iron oxides and sulfides). In our study, the AAR was induced using a LDA-AMU1 magnetizer (Agico Ltd.) with a DCfield of 100μT and a peak-field of 50 mT, which encompasses most of the remanent coercivity spectra in studied samples (details seeSection 4.3). Rema-nent magnetization after each inducing step was measured with a JR6A magnetometer (Agico Ltd.). For a test site (AE2) we have used 6, 9, 12 and 18 position schemes and estimated the best AAR tensors from least-squaresfitting followingTrindade et al. (2001b). Since all schemes yielded coherent results we have used the most time-effective six position scheme for the rest of the sites. For each site, the average anisotropy tensor was obtained using the tensor statistics ofJelinek (1981)on nine to twelve specimens for AMS data and from five specimens for AAR data. It is worth noting that other statistical methods applied to the same set of samples, such as the bootstrap method ofConstable and Tauxe (1990)or the Monte-Carlo method ofLienert (1991)yield very similar results within error limits.
The study of magnetofabrics must be complemented by additional analyses that enable the identification of the minerals that control both the magnetic susceptibility and the magnetic remanence. This was done through hysteresis cycles, thermomagnetic curves, isother-mal remanence (IRM) acquisition curves, and scanning electron microscope (SEM) observations. Hysteresis measurements were per-formed in a MicroMag VSM (Princeton Instruments corp.) up to 1500 mT at room temperature. Thermomagnetic curves were obtained through heating and cooling cycles from room temperature up to 700 °C in a CS3 furnace coupled with a KLY4S Kappabridge sus-ceptometer (Agico Ltd.). Experiments were done in argon atmo-sphere to inhibit alteration during heating. IRM acquisition was performed up to 2800 mT with a very detailed routine, which com-prises more than 40 measuring steps using a pulse magnetizer MMPM10 (Magnetic Measurements Ltd.) and a spinner magnetome-ter (Molspin ltd.). SEM observations were done in carbon-coated samples using LEO 430i and LEO 440I Cambridge microscopes coupled with Leica EDS analyzers.
4. Results
4.1. Petrography and microstructures
The porphyritic granite is the dominant lithology exposed on the inner part of the central uplift. A predominantly massive structure preserving the magmatic textures is systematically observed at each outcrop (Fig. 3A). This granite is composed of alkali-feldspar
megacrysts, 1 to 3 cm in size, in a coarse-grained matrix of alkali-feldspar, plagioclase, biotite, and quartz with accessory minerals such as zircon, tourmaline, and opaque minerals. The euhedral/ subeuhedral megacrysts of orthoclase commonly exhibit inclusions of quartz, plagioclase and biotite. Alkali-feldspar crystals in the matrix are 2 to 6 mm in size and usually contain inclusions of anhedral quartz, biotite and muscovite. The plagioclase varies in shape from subeuhedral to anhedral and often exhibits fractures. We have identi-fied at least two generations of quartz. Thefirst occurs asfine inclu-sions or myrmekite associated with alkali-feldspar rims and rarely exhibits evidence of shock deformation. The second population com-prises large grains with shock deformation features, such as planar fractures (PFs) and planar deformation features (PDFs). The biotite grains are predominantly anhedral, with very different sizes, reaching up to 3 mm, sometimes presenting kink bands or shattered grains (Fig. 3B).
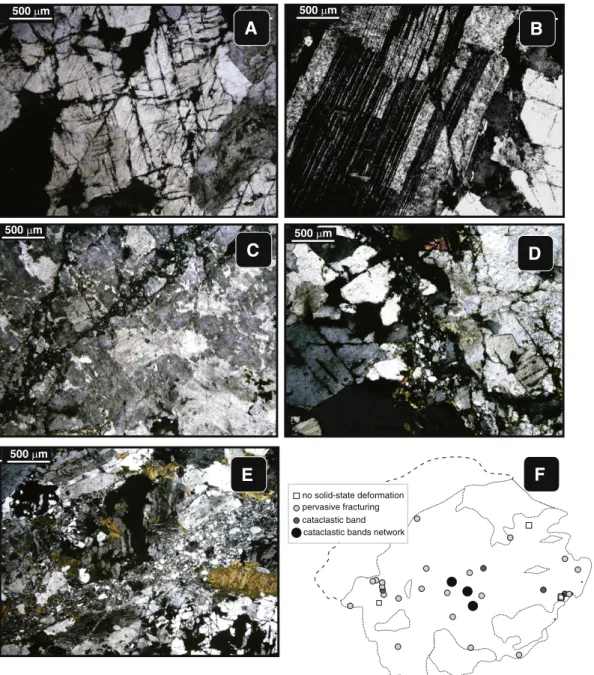
Shock metamorphism features in granite samples are overprinted by brittle and cataclastic microstructures, which comprise: (i) pervasive frac-turing with localized micro-faults (Fig. 4A, B); (ii) discrete cataclastic bands (Fig. 4C, D); (iii) cataclastic bands forming an interconnected network (Fig. 4E). The distribution of these microstructures throughout the central peak is shown inFig. 4F.
Pervasive microfracturing is observed in almost all sites and consists of opening and displacement of planar fractures in quartz and their propagation into other minerals. These microstructures are irregular and form 10–60μm wide corridorsfilled with angular to sub-angular microclasts of a few millimeters in size embedded into afine matrix (Fig. 4A). These fractures are locallyfilled with thinfilms of quenched melt and carry a substantial amount of iron-oxide grains (see also Machado et al., 2009). In some cases, the
8140000
8198000
8142000
285000 287000 289000
285000 287000 289000
80
40
20
70
80 40
70
80 70
85 85
40
85
70
60
80
20 85 60 70 40
30 30 40
70 70 70 35
60
9 7 5 4
8 83
78
46
39
86
74
63
45 41
36 35
33 32 31
27
26
24
23 20 19
18 17
16 15
11
1 76
89
30 29
77 3
28
25
88
79
75
2
80 81 10
6 13
47
34
69 82
Siltstones and sandstones (Ponta Grossa Formation)
Metamorphic basement (Cuiabá Group)
Roads Polymict breccia
Impact melt sheet
LEGEND
Sandstone and conglomerates (Furnas Formation)
65
Bedding Impact melt dikes
Sampling sites
0 1 2 Km
Porphyritic granite
Fig. 2.Geological map of the central peak of Araguainha, showing the exposed target rocks, related impact-materials and structures. White circles (and numbers) represent the sampling sites. Note that the stars represent the sites where melt-dikes occur.
A
10 cm
200 µm
B
Fig. 3.(A) Typical texture of the porphyritic granite; and (B) photomicrograph of kinked and shattered biotite.
displacement of these fractures results in propagation of microfaults, which are well marked in plagioclase crystals by the displacement of polysynthetic twinning (Fig. 4B). The apparent displacement varies from tens of micrometers to a few millimeters. These fault planes usu-ally exhibit afine-grained comminuted matrix produced by mechan-ical abrasion during fault movements.
At some sites, microfaults form discrete cataclastic bands (Fig. 4C). Along these bands, mineral fragments show strong size reductions down to 1μm or less, forming a veryfine matrix. In most cases, the walls of the cataclastic bands are well defined and form 15–150μm wide corridors filled with angular to sub-angular microclasts of a few millimeters in size immersed into a veryfine matrix (Fig. 4D). These microclasts usually show an incipient imbrication, which is well defined at the band edges. In some cases, however, the bands have a diffuse contact with a gradational grain size reduction from the surrounding cataclastic granite. It is interesting to stress that the roundness of clasts and the width of the bands are similar to those ob-served in tectonic cataclastic granites (Lin, 1999). At some places,
these structures are accompanied by bent of twin lamellae in isolated plagioclase clasts and chess-board extinction in quartz clasts suggest-ing that brittle-ductile deformation occurred, at least locally. In the core of the central peak, cataclastic bands with widths of hundreds of micrometers up to a few millimeters form an irregular and inter-connected network (Fig. 4E). Strongly asymmetric clasts, intensely fractured and micro-faulted are usually observed within these zones. This network of cataclastic bands postdate the pervasive cata-clasis observed in almost all sites, likely resulting from increased localization of the shear stress, which modify and connect the cata-clastic bands.
4.2. Magnetic anisotropy
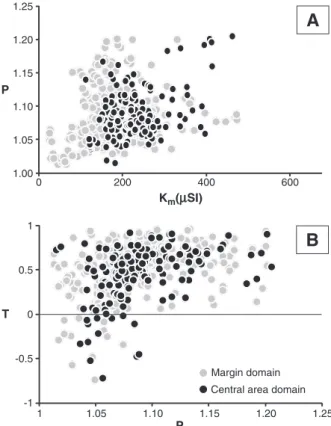
The mean magnetic susceptibility (km= (kmax+kint+kmin)/3) in the porphyritic granite ranges from 60 to 416μSI (average of 202μSI); kmvalues between 100 and 300 μSI are found in 86% of no solid-state deformation
pervasive fracturing cataclastic band cataclastic bands network
500 m
C
500 m
B
F
500 m
E
500 m
A
500 m
D
Fig. 4.Photomicrographs of microstructures in the porphyritic granite. (A) Pervasive fractured texture; (B) microfault in plagioclase crystal displacing polysynthetic twinning. (C) Cataclastic bands in k-feldspar megacrystal; (D) detail of (C) showing the clast range size and the clast shapes. (E) Interconnected shear bands; (F) map of microstructure distribution.
the sites (Table 1, 1S andFig. 5). The anisotropy degree P ranges from 1.02 to 1.16 (average of 1.08), with 74% of the specimens within the 1.05–1.10 interval (Fig. 5). The P value distribution throughout the area does not exhibit any particular trend even though microstructures indicate higher strains on the inner part of the Central Peak (CP). The shape parameter T varies within a wide range, from−0.74 to 0.96
(av-erage of 0.50), but oblate AMS ellipsoids are largely dominant for higher P values where the ellipsoid is better resolved (Fig. 6).
As expected from its dominantly oblate shape, the AMS fabric of the Araguainha granite shows well-defined foliations for all studied sites (Fig. 6). This is shown by the small values of the semi-angle of the major and minor axes of the 95% confidence ellipses forkmin(eandz values inTable 1, 1S). For some siteskminand alsokmaxshow strong clustering. In order to define the reliability of the magnetic fabrics (foli-ation and line(foli-ation), we arbitrarily set the cut-off to accept an AMS data parameter ateb30° (seeTable 1, 1S).
The AMS foliation pattern defines two structural domains: (i) the margin of the granitic core, surrounding the collar of Furnas Formation
sandstones in the central uplift area and (ii) the central sector of the Araguainha granite represented by the sites 15–20, 23–26 and 29–31 (which coincides with the geographic center of the impact structure). Thefirst domain shows a coherent structural pattern with foliations presenting concentric strikes and moderate to steep dips. In the west, southeast and east sectors of the marginal area, the foliations dip pre-dominantly outwards, while in the south and southeast sectors the foli-ations dip inwards. By contrast the dip angles of folifoli-ations in the central sector vary strongly between neighboring sites, but trend dominantly towards the geographic center (nine out of thirteen sites) (Fig. 7). In several sites AMS lineation is undefined because of the predominantly planar nature of AMS ellipsoids (Fig. 6). Where lineations can be obtained they follow the same pattern observed for foliations. In the marginal zone they show a relatively homogeneous pattern, being char-acterized by orientations tangential to the borders of the granite core with gentle to moderate plunges (Fig. 7). In contrast, the central area shows a complex lineation pattern (Fig. 7), with strong variations in both their orientation and dip.
Table 1
AMS data from Araguainha granitic core.
Mean AMS parameters Jelinek Tensor
Site Localization Nc Ns km L F P T kmax error kmin error
UTM coordinates (mSI) Dec
(°) Inc (°)
z e Dec
(°) Inc (°)
z e
Margin area domain
1B 2 3 142.20 1.01 1.02 1.04 0.39 – – – – – – – –
2 3 12 160.32 1.02 1.04 1.06 0.46 128 12 34 9 34 18 10 6
3A 3 8 256.11 1.01 1.04 1.05 0.59 143 18 15 7 45 24 8 4
3B 2 4 214.46 1.01 1.05 1.06 0.59 – – – – – – – –
4 3 6 243.98 1.02 1.04 1.06 0.44 174 26 19 4 57 44 12 3
5 3 10 222.14 1.01 1.06 1.07 0.74 174 35 29 4 40 45 6 3
6A 2 6 170.33 1.02 1.05 1.06 0.49 149 19 44 6 52 20 9 5
7 4 14 238.01 1.02 1.05 1.06 0.45 176 2 48 4 85 34 12 4
10 3 13 161.71 1.02 1.08 1.10 0.57 23 9 14 7 117 27 7 5
11 3 11 205.43 1.02 1.13 1.15 0.74 214 33 14 3 78 48 5 2
12 3 7 416.12 1.01 1.07 1.07 0.79 36 72 30 5 145 6 13 5
13 2 6 253.52 1.02 1.07 1.08 0.59 164 34 7 3 34 44 4 3
32 3 10 126.16 1.02 1.04 1.06 0.18 24 3 11 4 278 77 12 4
33 3 10 175.42 1.01 1.06 1.08 0.63 58 0 13 8 148 26 10 4
34B 3 10 142.11 1.02 1.05 1.07 0.31 22 12 12 8 115 8 14 6
35 3 12 185.73 1.02 1.07 1.09 0.61 4 40 20 5 128 33 7 4
36 3 5 759.94 1.00 1.02 1.02 0.78 17 73 32 2 277 3 5 2
37B 3 9 116.06 1.03 1.09 1.12 0.52 52 1 24 5 143 28 6 3
41 3 7 204.96 1.01 1.03 1.04 0.33 326 54 12 6 154 35 9 6
45 3 9 160.70 1.01 1.08 1.10 0.68 350 34 63 2 163 56 6 2
47 3 9 159.01 1.01 1.08 1.10 0.69 145 33 21 5 326 57 15 5
63 3 10 60.23 1.03 1.02 1.05 −0.09 358 32 12 6 148 54 20 5
69 4 13 148.72 1.05 1.11 1.16 0.34 53 13 27 3 163 55 11 4
74 3 3 204.41 1.01 1.08 1.10 0.78 3 28 23 4 115 36 4 3
77A 4 12 71.73 1.01 1.02 1.03 0.43 7 41 57 5 120 24 10 5
77B 3 4 113.20 1.02 1.06 1.08 0.53 – – – – – – – –
86 3 10 258.26 1.02 1.08 1.10 0.60 155 9 18 4 52 53 4 3
Central area domain
15 3 8 214.29 1.03 1.08 1.12 0.43 173 60 10 3 311 23 3 3
16 3 8 248.91 1.02 1.05 1.07 0.47 167 37 15 4 343 53 9 5
17 3 11 249.25 1.02 1.05 1.07 0.52 117 79 16 6 324 9 8 6
18 4 11 231.49 1.02 1.04 1.06 0.41 132 27 10 3 338 60 9 4
19 3 15 262.30 1.03 1.05 1.08 0.28 127 17 11 5 356 64 11 5
20 3 10 250.03 1.02 1.03 1.06 0.20 182 54 8 4 335 33 11 4
23 3 9 209.53 1.02 1.06 1.08 0.58 315 17 13 4 80 62 5 3
24 3 8 194.93 1.02 1.03 1.05 0.25 357 22 40 9 111 45 12 1
25B 3 10 238.64 1.02 1.05 1.07 0.51 5 36 14 4 119 29 12 3
26 3 10 162.66 1.02 1.06 1.08 0.42 14 8 21 4 113 47 6 4
27 3 8 274.21 1.02 1.09 1.11 0.70 152 19 24 5 36 51 8 3
28A 3 7 130.60 1.02 1.02 1.04 −0.15 301 32 7 4 81 51 15 5
29A 3 11 311.14 1.03 1.11 1.14 0.60 333 34 26 4 92 35 4 3
30B 4 17 310.49 1.01 1.05 1.06 0.74 330 33 15 12 157 56 58 11
31 3 10 176.38 1.02 1.09 1.11 0.69 9 27 15 4 163 60 6 3
Nc = number of cylinders collected; Ns = number of specimens measured;km= mean susceptibility (kmax+kint+kmin)/3; L = lineation (kmax/kmin); F = foliation (kint/kmin); P = degree of anisotropy (kmax/kmin); T = Jelinek's parameter (Jelinek, 1981) ((2lnF /lnL)−1); Dec = declination; Inc = inclination; z and e = semi-angle of the minor and major axes of the 95% confidence ellipse, respectively.
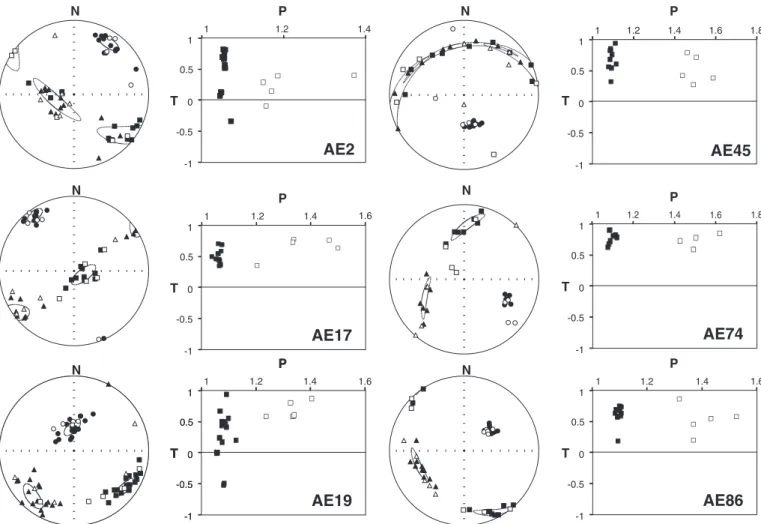
The pattern described above may reflect the preferred crystallo-graphic orientation of the paramagnetic matrix (mainly biotite crys-tals in the case of the Araguainha granite) and/or the orientation of elongate iron oxide crystals (magnetite and hematite). In order to iso-late the contribution of iron oxides in some of the studied sites, the AAR technique was applied in six of them: sites 2, 45, 74 and 86 from the granite margin, and sites 17 and 19 from the central domain. The comparison of AMS and AAR principal axes show similar fabric symmetries between the two methods (Fig. 6andTable 2), with mag-netic foliations and lineations of both methods coinciding within 25°. AAR shows anisotropy degrees as usually observed in other studies (e.g.,Trindade et al., 1999). The fact that in the six studied sites the AAR fabrics are perfectly coaxial with the AMS fabrics demonstrates that iron oxide grains are orientated parallel to the AMS fabric and may control its anisotropy. This will be investigated further in the next section.
4.3. Magnetic mineralogy
Thermomagnetic curves and hysteresis cycles show that the scalar magnetic susceptibility of the granite is dominantly controlled by the paramagnetic matrix in several samples (seeFigs. 8 and 9, Table 2S). Thermomagnetic curves present a hyperbolic decrease of magnetic susceptibility at low temperatures, which is typical of the paramag-netic behavior, followed by an increase in magparamag-netic susceptibility at around 500 °C probably associated with the formation of magnetite due to biotite breakdown during the experimental heating (e.g.,
Trindade et al., 2001b). This newly formed magnetic phase would be responsible for the strong signal observed in the cooling curve (Fig. 8). The paramagnetic contribution observed in thermomagnetic curves was estimated between 2.7% and 76.9% using the method of
Hrouda et al. (1997)(Table 2S). This significant paramagnetic signal is further confirmed by hysteresis cycles obtained forfive samples which are typically far from saturation at 1500 mT inducingfields (Fig. 9A).
In spite of the strong paramagnetic contribution to the total sus-ceptibility in several samples, the orientation of the magnetic suscep-tibility and remanence ellipsoids is always coaxial, meaning that the oxide grains that decorate microfractures and cataclastic bands are orientated parallel to the bulk fabric defined by the AMS. This ferro-magnetic signal is carried by two ferro-magnetic phases: one that saturates atfields below 1000 mT in IRM acquisition curves and the other char-acterized by very high saturationfields in excess of 3 T (Fig. 9B). Some clues about these two phases can be obtained by the coercivity spec-tra of the same samples (Fig. 9C). Coercivity spectra measured be-tween 0 and 100 mT peaks within the 0–50 mT interval suggesting that the mineral fraction that saturates at lowfields is a soft magnetic phase, most likely multidomain magnetite. But the same diagrams also show a significant contribution of a more coercive phase that is not affected by AFfields of 100 mT, suggesting that the other magnet-ic carrier is hematite. Magnetite and hematite grains are observed in the Araguainha granite samples as tiny iron oxides, smaller than 10μm in diameter, always associated with deformation features, in-cluding in-filling of fractures within feldspar (Fig. 10A), occupying the axial plane of kink bands within biotite grains (Fig. 10B) and within the planar features in quartz (Fig. 10C). Our observations are similar to those ofMachado et al. (2009), who show that the iron ox-ides preserved in fractures of the Araguainha granite do not exhibit significant secondary alteration or hydration. Both observations sug-gest that the iron oxide formation was associated to shock effects on biotite which broke down into Fe-oxides + Al–Si melt and migrat-ed locally through the fractures.
5. Discussion
5.1. Deformation regime during central uplift formation
Previous works suggest that the formation of the Araguainha's central uplift was associated with large-scale upward movement of the granitic core and inward movement of the sedimentary target rocks controlled dominantly by faults (e.g.,Lana et al., 2006; 2008). According toLana et al. (2008)the inward movement from the crater walls to the collar of the uplift resulted in extreme thickening of the sedimentary target rocks, which have a centripetal bedding orienta-tion related to the imbricaorienta-tion of km-scale thrust sheets. This imbrica-tion and the inwardflow of melt pockets between the granitic core and surrounding sedimentary strata are also tracked by gravity and electric sounding surveys at the edge of the central uplift (Tong et al., 2010). Additional rotation of the bedding to vertical orientations at the margin of the central uplift was associated to the progressive upward movement of the granitic core (Lana et al., 2008). The up-ward movement in the center of Araguainha was likely accommodat-ed through bounding faults (Lana et al., 2007, 2008).Engelhardt et al. (1992)suggested that the granite core uplifted as a uniform plastic mass because no large scale fracture system was identified within the central uplift. Nevertheless, the rheology behavior of the granitic core itself during the uplift is still not well understood. Here we pro-pose a mechanism for such an apparent plastic behavior of the granit-ic target rocks in the central uplift. Our petrographgranit-ic analysis suggests that brittle deformation features (cataclasis) are pervasively distrib-uted within the granitic core of the structure. These features are sim-ilar to those observed in large seismic fault zones (e.g.Onishi and Shimizu, 2005; Takagi et al., 2000), and also to those observed in smaller impact craters where deformation is dominantly controlled by cataclasis (Kenkmann, 2003; Okubo and Schultz, 2007; Trepmann, 2008). More recently, similar features have also been observed on the central uplift of the 90-km-wide Manicouagan impact structure (Biren
0 200 400 600
Km(
µ
µ
SI) P1.00 1.05 1.10 1.15 1.20 1.25
1
-1 -0.5 0 0.5
T
1 1.05 1.10 1.15 1.20
P
1.25 Margin domain
Central area domain
A
B
Fig. 5.AMS scalar data (A)Pvs.kmplot; (B)Pvs.Tplot.
0 1 2 km
N
64
87 7266
46
45 70
56 63
60 84
46 67 82
81 30 26 57
28 45 61 43
42
39
39
55 30
13
57 62 82 55 33
54
66
36 37
34
35
Magnetic Foliations (normal to K )min
0°- 30°
60°- 90° 30°- 60°
56
Magnetic Lineations (Kmax)
0°- 30°
30°- 60°
60°- 90°
18 26 35 9
33
72
33
60 34
79
37 27
36 17
54
17 8 32
27
19 33
54
28 40
3
0
12 1
9
32
13 34
Fig. 7.AMS fabric pattern of the Araguainha granite: (A) magnetic lineation (parallel tokmax); (B) magnetic foliation (normal tokmin). Foliation poles (circles) and lineation (squares) are represented in lower-hemisphere stereoplots.
N
N
N
N
N N
1.2 1.4
-1 -0.5 0 0.5 1
1
P
T
AE2
1.2 1.4 1.6 1.8
-1 -0.5 0 0.5 1
1
P
T
AE45
-1 -0.5 0 0.5 1
P
T
1.2 1.4 1.6
1
AE17
1.2 1.4 1.6
-1 -0.5 0 0.5 1
P
T
-1 -0.5 0 0.5 1
1
P
T
AE19
1.2 1.4 1.6 1.8
-1 -0.5 0 0.5 1
1
P
T
AE74
1 1.2 1.4 1.6
-1 -0.5 0 0.5 1
P
T
AE86
90
Fig. 6.Representative lower-hemisphere stereoplots of AMS and AAR and P–T diagrams. Squares =kmaxandAmax; triangles =kintandAint; circles =kminandAmin.(AMS in black and AAR in white). Dashed line ellipses: 95% confidence ellipses.
and Spray, 2011). In the central uplift of the Manicouagan pervasive dam-age is related to shear veins, which show minimal offsets (in order of a few millimeters) and exhibit a microbrecciaed texture. Yet, in contrast to the shock veins of Manicouagan, which is twice as big as Araguainha, we did notfind high pressure mineral polymorphs or glass within the Araguainha veins.
In Araguainha the intensity of cataclasis varies locally, with a ten-dency to increase towards the center of the structure (Fig. 4). Early
impact fracture sets are observed throughout the granitic core, usual-ly associated with the planar fractures in quartz (Engelhardt et al., 1992). These microstructures are overprinted by pervasive extension-al fractures and associated micro-faults with sub-millimetric disloca-tions and incipient grinding of crystals along the fault planes. In granites affected by fault zones, similar microstructures (intergranu-lar and transgranu(intergranu-lar microcracks) are indicative of early fault move-ments (Lin et al., 2007; Onishi and Shimizu, 2005). Discrete cataclastic bands developed locally allowing solid-stateflow involv-ing brittle fragmentation of mineral grains with rotation of grains ac-companied by frictional grain boundary sliding and dilatancy (e.g.,
Sibson, 1977). These cataclastic bands become wider in the center of the structure and form irregular networks (see map inFig. 4). The same progression in deformation is observed in seismic fault zones, where discrete shear bands along the main fault are replaced by microcracks, which decrease in density away from the wall rock damage zone (Ismat and Mitra, 2001).
Cataclastic deformation at the scale of individual particles primar-ily involves localized brittle fracture, but the progressive cataclasis in a large volume of rock can produce apparently plastic uniformflow macroscopically (Griggs and Handin, 1960). This process is named cataclastic flow (c.f. Sibson, 1977). Cataclastic flow was reported in the formation of sandstone dikes at the Upheaval Dome impact structure (Kenkmann, 2002, 2003). In Araguainha, which is a much larger impact structure, we propose that cataclastic flow occurred
Site 2
Site 5
Site 17
Site 18
Site 19
Site 29
Site 45
Site 74
Site 86
0 100 200 300 400 500 600 700 0
0.5 1
Normalized Susceptibility
0 100 200 300 400 500 600 700 0
0.5 1
Normalized Susceptibility
0 0.5 1
Normalized Susceptibility
T(C°)
0 100 200 300 400 500 600 700
T(C°) T(C°)
0 100 200 300 400 500 600 700 0
0.5 1
Normalized Susceptibility
0 100 200 300 400 500 600 700 0
0.5 1
Normalized Susceptibility
0 0.5 1
Normalized Susceptibility
T(C°)
0 100 200 300 400 500 600 700
T(C°) T(C°)
0 100 200 300 400 500 600 700 0
0.5 1
Normalized Susceptibility
0 100 200 300 400 500 600 700 0
0.5 1
Normalized Susceptibility
0 0.5 1
Normalized Susceptibility
T(C°)
0 100 200 300 400 500 600 700
T(C°) T(C°)
Fig. 8.Representative thermomagnetic curves with magnetic susceptibility change with temperature. Heating and cooling curves are represented by the red lines and blue lines, respectively.
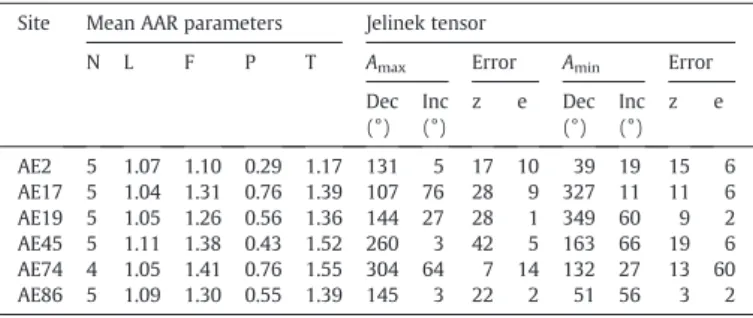
Table 2
AAR data from Araguainha granitic core.
Site Mean AAR parameters Jelinek tensor
N L F P T Amax Error Amin Error
Dec (°)
Inc (°)
z e Dec
(°) Inc (°)
z e
AE2 5 1.07 1.10 0.29 1.17 131 5 17 10 39 19 15 6
AE17 5 1.04 1.31 0.76 1.39 107 76 28 9 327 11 11 6
AE19 5 1.05 1.26 0.56 1.36 144 27 28 1 349 60 9 2
AE45 5 1.11 1.38 0.43 1.52 260 3 42 5 163 66 19 6
AE74 4 1.05 1.41 0.76 1.55 304 64 7 14 132 27 13 60
AE86 5 1.09 1.30 0.55 1.39 145 3 22 2 51 56 3 2
N = number of specimens measured; L = lineation (Amax/Amin); F = foliation (Aint/Amin); P = degree of anisotropy (Amax/Amin); T = Jelinek's parameter (Jelinek, 1981) ((2lnF/lnL)−1); Dec = declination; Inc = inclination; z and e = semi-angle of the minor and major axes of the 95%confidence ellipse, respectively.
pervasively all across the core of the structure, the corresponding mi-crostructures obliterating PDFs in quartz. In addition, geophysical data indicate a strong reduction in electrical resistivity and density within the central uplift which are fully compatible with the wide-spread occurrence of cataclasis in the center of the impact structure (Masero et al., 1994; Tong et al., 2010).
5.2. Internal structure of the central peak: The significance of magnetic fabric
Thin sections of cataclastic bands from within the granitic core of the Araguainha structure are systematically decorated by tiny magne-tite grains (and minor hemamagne-tite). The anisotropy of magnetic rema-nence for these oxides is coaxial to the anisotropy of magnetic susceptibility. Therefore, we interpret the magnetic fabric as resulting dominantly from the alignment of these oxide grains along the micro-fault planes, yielding an image of micromicro-fault orientations throughout
the impact structure (Fig. 9). This echoes the correlation between the AMS fabric in granitic cataclasites associated with faults. In this case, the magnetic fabric is characterized by oblate ellipsoids with kminoriented nearly normal to the fault plane (e.g.,Borradaile et al.,
1989; Nakamura and Nagahama, 2001). In addition, the degree of an-isotropy was found to increase towards the fault gouge in cataclasites from the Nojima Fault (Japan) that cuts across the Ryoke granite (Nakamura and Nagahama, 2001). We can thus use our magnetic an-isotropy measurements to track the preferred orientation of cataclas-tic fractures through the Araguainha granicataclas-tic core.
Field mapping of collar sediments and the magnetic fabric pattern in the granitic core unravel the post-impact internal geometry in the central peak of the structure. Previous studies at the Araguainha cen-tral peak show that vertical exhumation of the granite core was ac-companied by thickening of Furnas and Ponta Grossa rocks in the collar (Lana et al., 2006, 2007, 2008). This thickening produced an asymmetric geometry with isoclinal folds formed by differential movement between strata, imbrications of km-scale thrust sheets of the Furnas strata, and formation of radial folds during lateral constric-tion of sediments (Fig. 1). In Araguainha, even though the thickness of the folded sediment pack is significantly larger, its geometry is similar to that expected from numerical models of the mid-size stratified im-pact structures (e.g.Collins et al., 2008). This geometry is the result of the interaction between the outward and the downwardflowfields in
Applied Field (mT)
AE19 AE34
0 0.5 1
0 500 1000 1500 2000 2500
B
0 0.5 1
0 10 20 30 40 50 60 70 80 90
Applied Field (mT)
Normaliz
ed Intensity
Normaliz
ed Intensity
C
50
1500
H(mT)
M(mAm /Kg)2
AE17
Ms=8.1 mAm /Kg Mrs= 3.1 mAm /Kg Hc=51 mT Hcr=120 mT
2 2
A
Fig. 9.Magnetic mineralogy. (A) Representative hysteresis loop for granite samples (AE17); (B) curves of isothermal magnetization acquisition with bimodal distribution for two samples (AE19 and AE34); (C) coercivity spectra with unimodal distribution.
C
15 m
Qtz
Mgt
A
Mgt
Fds
750 mB
Mgt
20 m
Bt
Bt
Fig. 10.SEM images. (A) Magnetitefilling-in feldspar microfractures; (B) magnetite hosted in biotite microfracture; and (C)fine-grained magnetite along quartz planar fracture. Mgt = magnetite; Fds = feldspar; Qtz = quartz.
the central uplift during the structural collapse (e.g.,Collins et al., 2002, 2008). But kinematic features that would indicate how the cen-tral uplift has collapsed are rare in Araguainha, being limited to the outward vergence of intrafolial folds in the Ponta Grossa Formation (Lana et al., 2008).
In the present study, we observe that the magnetic fabric is mainly oblate and defines a concentric pattern in the border of the granitic core surrounding a central area with complex fabric orientations. The oblate and concentric magnetic fabric pattern in the margin of the granitic core follows the attitude of the intrafolial folds in the Ponta Grossa Formation, suggesting that this area records the struc-tures dominantly associated to outwardflow. The variable inward dip foliations in the south and southeast areas might be a conse-quence of the different rheological behavior of granite and metamor-phic basement, since the latter only occur in these areas. In the central area, the magnetic fabric shows a complex pattern with foliation dips varying strongly between neighboring sites and trending dominantly towards the geographical center of the crater. This pattern suggests that the central area recorded the structures associated to the down-wardflow.
The two structural domains defined by the magnetic fabric, are likely related to the interaction of outward/downwardflows and pre-sent some differences in their microstructures. On the outer margin of the granitic core the microstructures are mainly composed of perva-sive fractures that rarely change to cataclastic bands. The microstruc-tural setting imaged by the magnetic fabric data may have resulted from a certain degree of homogeneity in the outwardflowfield dur-ing crater (c.f.Section 5.3) with subsequent“freezing”of the defor-mation pattern. By contrast the central area comprises pervasive fractures that evolve to cataclastic bands and, in some cases, form a cataclastic band network. In this case, the association between the microstructures and the magnetofabric pattern suggests that they could have been influenced by oscillatoryflows in the center of the impact structure during the collapse.
5.3. Implications for softening mechanism in large impact structures
We recallfirst that the coefficient of internal friction of target rocks in models must be orders of magnitude lower than laboratory results in quasi-static conditions on natural rocks to explain the final morphology of complex craters (Melosh, 1979). This situation suggests that a strength reduction mechanism may operate during crater formation (e.g.,Melosh, 1979). In numerical modeling, this unresolved physical process is reproduced by a transient reduction of internal friction during the crater growth. Internal friction returns gradually back to its static value during crater collapse, freezing the crater in itsfinal shape.
On the basis of observations of the melt dike pattern in the Sud-bury impact structure,Dence et al. (1977)has proposed the lubrica-tion of faults by friclubrica-tion melt as a weakening mechanism (e.g.,Scott and Benn, 2001). In this case, the deformation must be partitioned and concentrated on faultsfilled with melt veins (c.f., Spray, 2010
and references therein). At Araguainha, some fractures are indeed filled with quenched melt, but the amount of melt in the central uplift is considered to be insufficient for strength reduction during crater collapse (c.f.Melosh and Ivanov, 1999). Recently,Senft and Stewart (2009)proposed an alternative model of fault weakening caused by high slip velocities during collapse flow. While Araguainha shows an important fault pattern between the supracrustal rocks and the granitic core (Lana et al., 2006, 2008), the granitic core does not show a macroscopic fracture/fault network that could support this mechanism. In addition, this model was developed just for the col-lapse of large craters (100-km scale) that are much larger than Ara-guainha. The shear strength of target rocks may also be reduced by thermal softening mechanism, following the ideas of O'Keefe and Ahrens (1993, 1999)based on the mechanical behavior of metals at
high temperatures. For this, target rocks must be heated to tempera-tures close to their solidus and results in a more pervasive deforma-tion pattern than the fricdeforma-tional melt weakening mechanisms. However, according to scaling laws for the cratering process (Melosh, 1989), impact events of the scale of Araguainha do not pro-duce enough shock heating for the granitic core to be at or above its solidus point. Shock heating may be efficient for larger craters, typi-cally above 200 km in diameters (Melosh and Ivanov, 1999).
Finally, a temporary strength reduction of the target rock can also be accomplished by acousticfluidization. The concept of acousticfl u-idization was elaboratedfirst in the context of fault weakening, as an alternative explanation to the presence of fluids (Melosh, 1979, 1996). The fundamental idea of acoustic fluidization relies on the fact that for a coulomb material the yield stress is a linear function of the overburden pressure. If some fraction of the total energy is re-leased as short wavelength elastic waves generating oscillations in the normal stress, failure will be facilitated by a transient reduction of the overburden below the coulomb threshold. From the fact that crater morphologies are well described by a phenomenological model that presumes that a limited volume enclosing the crater is endowed with the properties of a Bingham plastic material for a short time after the impact,Melosh and Gaffney (1983)applied this concept to impact cratering. The original acousticfluidization model may be simplified using the one-dimensional block model describing the normal stress oscillations of a block sliding along a surface (Melosh and Ivanov, 1999). The block model for which sliding occurs between large blocks is supported by structural observations on some large impact structures (Melosh and Ivanov, 1999and references therein). Numerical simulations of impact cratering and modification stage incorporate acousticfluidization as a block-model approxima-tion and reproduce well the overall morphology of complex craters (Collins and Wünnemann, 2005; Collins et al., 2002; Melosh and Ivanov, 1999; Wünnemann and Ivanov, 2003).
Available geological evidence of acousticfluidization during the crater collapse has been restricted to cataclastic flow features ob-served in the sandstone dikes of the Upheaval dome (Kenkmann, 2002, 2003). Our microstructural data from the Araguainha granitic core indicate that deformation inside the central uplift has evolved from pervasive brittle fracturing to the development of discrete shear bands in the center of the structure. The magnetic fabric associ-ated to this pervasive deformation is dominantly planar, with well-defined orientations at the borders of the central peak. This coherent fabric pattern contrasts with the complex orientation of foliations and lineations observed in the core of the central peak. The pervasive na-ture of deformation and the microstructural evolution observed in the granitic target suggest that the strain in the central peak was partially accommodated by both deformation at the microscopic scale and dis-placement along fault systems at the border of the granitic core. In this context, we suggest that the reduction of internal fraction coeffi -cient operates not only between large blocks, but also at a larger range of scales than previously thought. A reduction of the internal friction coefficient of the rocks may be indeed produced by the action of high-frequency vibrations between individual grains at the mineral level. We note that, for the block-model to be valid, the time for elas-tic waves to cross a block must be short compared to the period of vi-bration of one block against another. This condition is eventually more easily satisfied with small mineral grains, than with large rock fragments. This mode of deformation could even dominate within the granitic core in the absence of observation of large fault systems affecting the core itself. The observed deformation at the macroscopic scale could be then given the name of a cataclasticflow; including the possibility that acousticfluidization operates down to the mineral scale.
There is no reason for Araguainha to be a unique case concerning the collapse mechanism. Evidences for differential motions between large fragments have been found in other large craters (e.g., the
Archean gneisses of the central peak of Puchezh-Katunki, Masaitis, 1999) but this do not exclude the possibility that deformation has also operated at the scale of minerals implying a reduction of the in-ternal friction coefficient in the context of high-frequency vibrations of individual grains.
6. Conclusion
Microstructural data from the Araguainha granitic core indicate that deformation in the central uplift has evolved from pervasive brit-tle fracturing to the development of discrete shear bands in the center of the structure (cataclasis). The fractures and the shear bands are systematically decorated with tiny iron oxides (magnetite and hema-tite), which are associated with the breakdown of biotite. The internal structure of the crater was defined from the systematic measurement of magnetic anisotropy (AMS and AAR). AMS and AAR fabric are per-fectly coaxial, indicating that the magnetic anisotropy defines the preferential orientation of the magnetite grains in the fractures. Therefore, the magnetic anisotropy measurements track the orienta-tion of cataclastic fractures through the Araguainha granitic core. The complex orientation of foliations and lineations observed in the core is interpreted to be the result of the collapseflow. The structural pattern revealed by magnetic methods andfield observations mimics the internal structure predicted by numerical models of impact into layered targets. In addition, these results shed a new light on the de-bate concerning the weakening mechanism required to explain the formation of complex craters. The pervasive nature of deformation and the microstructural evolution that was observed in the granitic target associated to other structural data (e.g., folds and faults on the crater scale) indicate that acousticfluidization could operate at different scales. The apparent plastic deformation at the macroscopic scale in the core is in fact a cataclasticflow made possible by acoustic fluidization at the scale of minerals.
Supplementary materials related to this article can be found on-line atdoi:10.1016/j.epsl.2012.01.005.
Acknowledgments
This project was funded by São Paulo State Science Foundation (FAPESP) through research Grant No. 05/51530-3. Elder Yokoyama acknowledges support from the Brazilian Research Council (CNPq). We thank Editor Lars Stixrude and referees John Spray, Boris Ivanov and Jaime Urrutia Fucugauchi for constructive reviews.
References
Biren, M.B., Spray, J.G., 2011. Shock veins in the central uplift of the Manicouagan impact structure: Context and genesis. Earth and Planetary Science Letters 303 (3–4), 310–322. doi:10.1016/j.epsl.2011.01.003.
Borradaile, G.J., Tella, S., McArthur, J., 1989. Magnetic fabric as a kinematic indicator of faults: a test case. Ann. Tectonicae 3, 3–11.
Borradaile, G.J., Henry, B., 1997. Tectonic applications of magnetic susceptibility and its anisotropy. Earth Sci. Rev. 42 (1–2), 49–93.
Carporzen, L., Weiss, B.P., Gilder, S.A., Pommier, A., Hart, R.J., 2012. Lightning remagne-tization of the Vredefort impact crater: No evidence for impact-generated magnet-icfields. J. Geophys. Res. 117, E01007. doi:10.1029/2011JE003919.
Collins, G.S., Melosh, H.J., Morgan, J., Warner, M., 2002. Hydrocode simulations of Chic-xulub Crater collapse and peak-ring formation. Icarus 157 (1), 24–33. doi:10.1006/ icar.2002.6822.
Collins, G.S., Wünnemann, K., 2005. How big was the Chesapeake Bay impact? Insight from numerical modeling. Geology 33 (12), 925–928. doi:10.1130/G21854.1. Collins, G.S., Kenkmann, T., Osinski, G.R., Wunnemann, K., 2008. Mid-sized complex
crater formation in mixed crystalline-sedimentary targets: insight from modeling and observation. Meteorit. Planet. Sci. 43 (12), 1955–1977.
Constable, C., Tauxe, L., 1990. The bootstrap for magnetic-susceptibility tensors. J. Geo-phys. Res. 95 (B6), 8383–8395.
Dence, M.R., Grieve, R.A.F., Robertson, P.B., 1977. Terrestrial impact structures: princi-pal characteristics and energy considerations. In: Roddy, D.J., Pepin, R.O., Merrill, R.B. (Eds.), Impact and Explosion Cratering. Pergamon Press, New York, pp. 247–275.
Engelhardt, W.von, Matthäi, S.K., Walzebuck, J., 1992. Araguainha impact crater, Brazil. 1. The interior part of the uplift. Meteoritics 27, 442–457.
French, B.M., 1998. Traces of Catastrophe: A Handbook of Shock-metamorphic Effects in Terrestrial Meteorite Impact Structures. Lunar and Planetary Institute, Houston. 120 pp.
Goldin, T.J., Wünnemann, K., Melosh, H.J., Collins, G.S., 2006. Hydrocode modeling of the Sierra Madera impact structure. Meteorit. Planet. Sci. 41 (12), 1947–1958. Grieve, R., Therriault, A., 2000. Vredefort, Sudbury, Chicxulub: three of a kind? Annu.
Rev. Earth Planet. Sci. 28, 305–338. doi:10.1146/annurev.earth.28.1.305. Griggs, D., Handin, J., 1960. Observation on fracture and a hypothesis of earthquakes, in
rock deformation, a symposium. Geol. Soc. Am. Mem. 79, 347–373.
Hammerschimidt, K., von Engelhardt, W., 1995.40Ar/39Ar dating of the Araguainha im-pact structure, Mato Grosso, Brazil. Meteoritics 30, 227–233.
Hirt, A.M., Lowrie, W., Clendenen, W.S., Kligfield, R., 1993. Correlation of strain and the anisotropy of magnetic susceptibility in the Onaping Formation: evidence for a near circular origin of the Sudbury basin. Tectonophysics 225, 231–254. Hrouda, F., Jelínek, V., Zapletal, K., 1997. Refined technique for susceptibility resolution
into ferromagnetic and paramagnetic components based on susceptibility temperature-variation measurement. Geophys. J. Int. 129, 715–719.
Ismat, Z., Mitra, G., 2001. Folding by cataclasticflow at shallow crustal levels in the Can-yon Range, Sevier organic belt, west-central Utah. J. Struct. Geol. 23 (2–3), 355–378. doi:10.1016/S0191-8141,00.00101-2.
Jackson, M., 1991. Anisotropy of magnetic remanence: a brief review of mineralogical sources, physical origins, and geophysical applications, and comparison with suscep-tibility anisotropy. Pure Appl. Geophys. 136 (1), 1–28. doi:10.1007/BF00878885. Jelinek, V., 1981. Characterization of the magnetic fabric of rocks. Tectonophysics 79,
63–67.
Kenkmann, T., 2002. Folding within seconds. Geology 30 (3), 231–234. doi:10.1130/ 0091-7613,2002.030b0231:FWS>2.0.CO.
Kenkmann, T., 2003. Dike formation, cataclasticflow, and rockfluidization during im-pact cratering: an example from Upheaval Dome structure, Utah. Earth Planet. Sci. Lett. 214, 43–58. doi:10.1016/S0012-821X,03.00359-5.
Lana, C., Gibson, R.L., Reimold, W.U., 2003. Impact tectonics in the core of the Vredefort dome: implications for formation of central uplift in large impact structures. Meteorit. Planet. Sci. 38 (7), 1093–1107.
Lana, C., Romano, R., Reimold, W.U., Hippertt, J., 2006. Collapse of large complex impact structures: implications from the Araguainha impact structure. Geology 34 (1), 9–12. doi:10.1130/G21952.1.
Lana, C., Souza-Filho, C.R., Marangoni, Y.R., Yokoyama, E., Trindade, R.I.F., Thover, E., Reimold, W.U., 2007. The Araguainha impact structure, central Brazil: a shallowly eroded peak ring structure. Geol. Soc. Am. Bull. 119 (9/10), 1135–1150. doi:10.1130/B26142.1.
Lana, C., Souza-Filho, C.R., Marangoni, Y.R., Yokoyama, E., Trindade, R.I.F., Thover, E., Reimold, W.U., 2008. Structural evolution of the 40 km wide Araguainha impact structure, central Brazil. Meteorit. Planet. Sci. 43 (4), 1–20.
Lienert, B.R., 1991. Monte Carlo simulation of errors in the anisotropy of magnetic sus-ceptibility: a second-rank symmetric tensor. J. Geophys. Res. 96, 19.539–19.544. Lin, A., 1999. Roundness of clasts in pseudotachylytes and cataclastic rocks as an
indi-cator of frictional melting. J. Struct. Geol. 21 (5), 473–478. doi: 10.1016/S0191-8141,99.00030-9DOI:dx.doi.org.
Lin, A., Maruyama, T., Kobayashi, K., 2007. Tectonic implications of damage zone-related fault-fracture networks revealed in drill core through the Nojima Fault, Japan. Tectonophysics 443 (3–4), 161–173. doi:10.1016/j.tecto.2007.01.011. Machado, R., Lana, C., Stevens, G., Souza-Filho, C.R., Reimold, W.U., McDonald, I., 2009.
Generation, mobilization and crystallization of impact-induced alkali-rich melts in granitic target rocks: evidence from the Araguainha impact structure, central Brazil. Geochim. Cosmochim. Acta 73 (23), 7183–7201. doi:10.1016/j.gca.2009.08.029. Martín-Hernández, F., Ferré, E.C., 2007. Separation of paramagnetic and ferromagnetic anisotropies: a review. J. Geophys. Res. 112 (B3). doi:10.1029/2006JB00434012. Masero, W., Schnegg, P.-A., Fontes, S.L., 1994. A magnetotelluric investigation of the
Araguainha impact structure in Mato Grosso-Goiás, central Brazil. Geophys. J. Int. 116, 366–376.
Melosh, H.J., 1979. Acousticfluidization: a new geologic process? J. Geophys. Res. 84 (B13), 7513–7520.
Melosh, H.J., 1989. Impact Cratering: A Geologic Process. Oxford University Press, New York. 245 pp.
Melosh, H.J., 1996. Dynamical weakening of faults by acousticfluidization. Nature 379, 601–606. doi:10.1038/379601a0.
Melosh, H.J., Gaffney, E.S., 1983. Acousticfluidization and the scale dependence of impact crater morphology. J. Geophys. Res. 88 (Suppl. A), 830–834.
Melosh, H.J., Ivanov, B.A., 1999. Impact crater collapse. Annu. Rev. Earth Planet. Sci. 27, 385–415. doi:10.1146/annurev.earth.27.1.385.
Nakamura, N., Nagahama, H., 2001. Changes in magnetic and fractal properties of frac-tured granites near the Nojima Fault, Japan. Isl. Arc 10 (3–4), 486–494. O'Keefe, J.D., Ahrens, T.J., 1993. Planetary cratering mechanics. J. Geophys. Res. 98 (E9),
17011–17028.
O'Keefe, J.D., Ahrens, T.J., 1999. Complex craters: relationships of stratigraphy and rings to impact conditions. J. Geophys. Res. 104 (E11), 27091–27104.
Okubo, C.H., Schultz, R.A., 2007. Compactional deformation bands in Wingate Sand-stone; additional evidence of an impact origin for Upheaval Dome, Utah. Earth Planet. Sci. Lett. 256 (1-2), 169–181. doi:10.1016/j.epsl.2007.01.024.
Onishi, C.L., Shimizu, I., 2005. Microcrack networks in granite affected by fault zone: vi-sualization by confocal laser scanning microscopy. J. Struct. Geol. 27 (12), 2268–2280. doi:10.1016/j.jsg.2005.07.007.
Rochette, P., Jackson, M., Aubourg, C., 1992. Rock magnetism and the interpretation of anisotropy of magnetic-susceptibility. Rev. Geophys. 30 (3), 209–226.
Scott, R.G., Benn, K., 2001. Peak-ring rim collapse accommodated by impact melt-filled transfer faults, Sudbury impact structure, Canada. Geology 29 (8), 747–750. doi:10.1130/0091-7613,2001.029b0747:PRRCAB>2.0.CO.
Scott, R.G., Benn, K., 2002. Emplacement of sulphide deposits in the Copper Cliff offset dike during collapse of the Sudbury crater rim: evidence from magnetic fabric studies. Econ. Geol. Bull. Soc. Econ. Geol. 7, 1447–1458.
Scott, R.G., Spray, J., 1999. Magnetic fabric constraints on friction meltflow regimes and ore emplacement direction within the South Range Breccia Belt, Sudbury Impact Structure. Tectonophysics 307 (1–2), 163–189.
Sibson, R.H., 1977. Fault rocks and fault mechanisms. J. Geol. Soc. Lond. 33, 191–213. Sen, K., Mamtani, M.A., 2006. Magnetic fabric, shape preferred orientation and regional
strain in granitic rocks. J. Struct. Geol. 28 (10), 1870–1882.
Senft, L.E., Stewart, S.T., 2009. Dynamic fault weakening and the formation of large impact craters. Earth Planet. Sci. Lett. 287 (3-4), 471–482. doi:10.1016/ j.epsl.2009.08.033.
Spray, J.G., 2010. Frictional Melting Processes in Planetary Materials: From hypervelocity Impact to Earthquakes: Annual Review of Earth and Planetary Sciences 38, 221–254. Takagi, H., Goto, K., Shigematsu, N., 2000. Ultramylonite bands derived from cataclasite and pseudotachylite in granites, northeast Japan. J. Struct. Geol. 22 (9), 1325–1339. doi:10.1016/S0191-8141,00.00034-1DOI:dx.doi.org.
Tarling, D.H., Hrouda, F., 1993. The Magnetic Anisotropy of Rocks. Chapman & Hall, London and New York. 247 pp.
Theilen-Willige, B., 1982. The Araguainha astrobleme/central Brazil. Geologischen Rundschau 71, 318–327.
Tong, C.H., Lana, C., Marangoni, Y.R., Elis, V.R., 2010. Geoelectric evidence for centripetal resurge of impact melt and breccias over central uplift of Araguainha impact struc-ture. Geology 38 (1), 91–94.
Trepmann, C.A., 2008. Shock effects in quartz. Compression versus shear deformation—
an example from the Rochechouart impact structure, France. Earth Planet. Sci. Lett. 267 (1-2), 322–332. doi:10.1016/j.epsl.2007.11.035.
Trindade, R.I.F., Raposo, M.I.B., Ernesto, M., Siqueira, R., 1999. Magnetic susceptibility and partial anhysteretic remanence anisotropiesin the magnetite-bearing granite pluton of Tourão. NE Brazil, Tectonophysics 314, 443–468.
Trindade, R.I.F., Bouchez, J.-L., Bolle, O., Nédélec, A., Peschler, A., Poitrasson, F., 2001a. Secondary fabrics revealed by remanence anisotropy: methodological analysis and examples from plutonic rocks. Geophys. J. Int. 147, 310–318. doi:10.1046/ j.0956-540x.2001.01529.x.
Trindade, R.I.F., Nguema, T.M.M., Bouchez, J.-L., 2001b. Thermally enhanced mimetic fabric of magnetite in a biotite granite. Geophys. Res. Lett. 28, 2687–2690. Wünnemann, K., Ivanov, B.A., 2003. Numerical modeling of crater depth-diameter
dependence in acousticallyfluidized target. Planet. Space Sci. 51 (13), 831–854. doi:10.1016/j.pss.2003.08.001.