THIS REPORT WAS PREPARED BY “CAROLINA TORRES”, A MASTERS IN FINANCE STUDENT OF THE NOVA SCHOOL OF BUSINESS AND
M
ASTERS IN
F
INANCE
E
QUITY
R
ESEARCH
We initiate Coverage of Viscofan with a buy rating and a target price
of Eur 52.3/sh. In our view, Viscofan is a unique player in a market
with great potential. The artificial casings market experienced 6%
growth in 2013, above the 2009-2013 CAGR of 5,6% and above global
average meat consumption and production. We believe in the
company’ potential to generate strong cash flow powered by revenue and margin improvement.
.
Clear Competitive Advantage
Viscofan is the only company producing the four type of artificial casings (cellulose, collagen, fibrous and plastic) and 45% of its clients buy
the four different types. This leaves Viscofan as the company with the
largest range of products on the market, representing a strong competitive
advantage over its competitors.
Potential market but no growth stolen
. The global market for casings is booming. This is becoming more evident in emerging countries, where globalization of eating habits is playing
a crucial role. In China, for example, casings consumption per capita grew at
17% 2009-2013 CAGR from Eur 0.14 to Eur 0.32. Because of its competitive
advantage and timely investment opportunities (first with investments in
China and first with collagen extrusion plant in LatAm) we believe Viscofan is
better positioned than its peers to enjoy the next decade of growth. The lack
of pricing power, the specific technology knowledge requirements and the
capital intensive nature are the most important entry barriers, which in our
view, will make very unlikely to attract new competitors, despite market
growth.
“
V
ISCOFAN SA
”
C
OMPANY
R
EPORT
“
P
ACKAGING AND
C
ONTAINERS
”
7
THJ
ANUARY2014
S
TUDENT
:
“
C
AROLINA
T
ORRES
”
[email protected]
A unique player in a unique market
Recommendation: BUYUPSIDE 24%
Price Target FY15: 52.3 €
Price (as of 7-Jan-15) 43.9 €
Bloomberg: VIS SM
52- week range (€) 36.24Eur-48.36Eur
Market Cap (€m) Eur 2.03 Bn
Outstanding Shares (m) 46.6million
Source: Bloomberg
Source:Bloomberg
lu € millions) 2013 2014E 2015E
Revenues 660 677 718
EBITDA 171 174 187
Net Net Profit 97 100 106
EPS EPS 2.18 2.14 2.28
DPS 1.12 1.40 1.54
“VISCOFAN SA” COMPANY REPORT
Table of Contents
INVESTMENT CASE ... 3
VALUATION ... 5
MAIN ASSUMPTION IN THE WEIGHTED AVERAGE COST OF CAPITAL (WACC) ....5
TERMINAL VALUE AND GROWTH ASSUMPTIONS ...6
MULTIPLES VALUATION:SLIGHT PREMIUM ...8
COMPANY OVERVIEW ... 9
COMPANY SNAPSHOT ...9
BRIEF HISTORY ...9
PRODUCTS ... 10
PRODUCTION PROCESS... 12
SHAREHOLDER STRUCTURE ... 12
COMPETITORS ... 13
CLEAR COMPETITIVE ADVANTAGE ... 14
KEY FIGURES ... 15
MARKET OVERVIEW ... 16
MEAT CONSUMPTION,POPULATION INCREASE AND CHANGING EATING HABITS16 ARTIFICIAL VS NATURAL –TECHNOLOGICAL TRANSFORMATION ... 17
CASINGS MARKET- AMPLIFYING THE MEAT EFFECT ... 18
MATURE MARKETS-EUROPE AND NORTH AMERICA ... 20
KEY GROWTH MARKETS-LATAM AND CHINA ... 21
BUSINESS STRATEGY AND INVESTMENT GUIDANCE: ... 25
FINANCIALS ... 27
SOLID REVENUE INFLOWS AS MARKET BOOMS ... 27
MARGIN RECOVERY AND EBITDA GROWTH ... 28
GROWING WITH SOLID BALANCE SHEET ... 29
IAN GROUP DISPOSAL ... 31
WHAT TO DO WITH THE MONEY? ... 32
RISKS TO VALUATION AND SCENARIO ANALYSIS ... 33
HEALTH CONCERNS AND ANIMAL DISEASES ... 33
IBEX35EXIT ... 35
APPENDIXES ... 36
“VISCOFAN SA” COMPANY REPORT
Figure 1. Revenues reached the 9thconsecutive year of growth… Figure 2. Powered by recent market expansion
Figure 3. …and growth means profitability
Source: Novasbe Research; Company Data Source: FAO Statistics, Novasbe Research; Company Data
Figure 4. Cash Flow generation promotes…
Source: Novasbe Research; Company Data Source: Novasbe Research; Company Data
Investment Case
Viscofan revenues reached a new high in 2013, completing the ninth consecutive year of growth, which was particular positive in a year marked by currency depreciation against the euro.
We expect revenue to keep increasing on the back of higher volume coming from the beginning of operations in Uruguay (production started in 1Q14) and by market
expansion in all geographies. As explained in further detail in the “Market overview”
section of this report, we see market growth as one of the main drivers of Viscofan as we expect the artificial casing market to growth 7.6% on average in the next two years. This will be fuelled by i) population increase, which should increase overall meat demand; ii) higher meat consumption per capita as a consequence of urbanization and globalization of eating habits- shift from cereal based diets to higher levels of animal
protein and sausages are the cheapest source of animal protein; iii) shift from natural
to artificial casings as sausage producers look to increase their output and improve the
“VISCOFAN SA” COMPANY REPORT
Source: Novasbe Research; Company Data
Figure 5. …solid balance sheet
Source: Novasbe Research; Company Data
Figure 6 … and higher shareholder remuneration
We are positive that the ramp up of operation in emerging markets should allow
Viscofan to enjoy economies of scale and consequent profitability improvement in the
long run. Note that the recent investment period together with energy and raw material
costs increasing have pushed margins down. Since we are not expecting Viscofan to
open another plant in the near future and as production increases via the new plants,
we expect some operational and fixed costs dilution leading to Ebitda and gross margin
improvements, as we quantified in further sections. We expect strong free cash flow
generation supported by higher revenue growth and improved margin. We believe this
will entail the company to keep its historical NetDebt/EV and hence leaving Viscofan
with a strong balance sheet. In our opinion, this deliver a comfortable position to
enhance growth and take advantage of market opportunities without raising financial
debt or asking extra efforts to shareholders.
As for the final topic of our investment case, we forecast higher shareholder
remuneration, through higher dividend distribution. This should be above the
company’s historical average as the cash flow generated will be sufficient to keep
“VISCOFAN SA” COMPANY REPORT
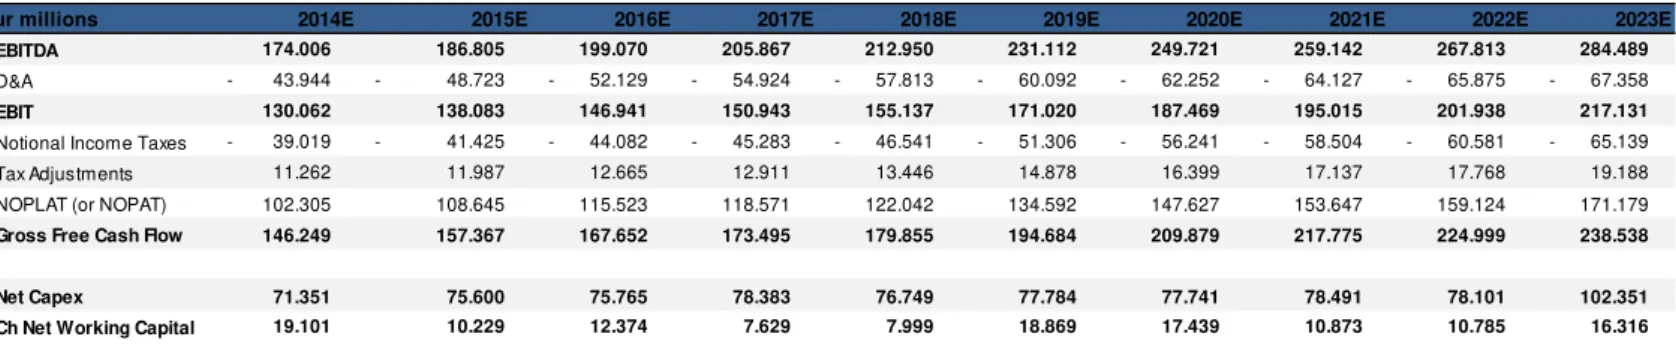
Eur millions 2014E 2015E 2016E 2017E 2018E 2019E 2020E 2021E 2022E 2023E
EBITDA 174.006 186.805 199.070 205.867 212.950 231.112 249.721 259.142 267.813 284.489
D&A - 43.944 - 48.723 - 52.129 - 54.924 - 57.813 - 60.092 - 62.252 - 64.127 - 65.875 - 67.358
EBIT 130.062 138.083 146.941 150.943 155.137 171.020 187.469 195.015 201.938 217.131
Notional Income Taxes - 39.019 - 41.425 - 44.082 - 45.283 - 46.541 - 51.306 - 56.241 - 58.504 - 60.581 - 65.139 Tax Adjustments 11.262 11.987 12.665 12.911 13.446 14.878 16.399 17.137 17.768 19.188 NOPLAT (or NOPAT) 102.305 108.645 115.523 118.571 122.042 134.592 147.627 153.647 159.124 171.179
Gross Free Cash Flow 146.249 157.367 167.652 173.495 179.855 194.684 209.879 217.775 224.999 238.538
Net Capex 71.351 75.600 75.765 78.383 76.749 77.784 77.741 78.491 78.101 102.351 Ch Net Working Capital 19.101 10.229 12.374 7.629 7.999 18.869 17.439 10.873 10.785 16.316
FCF 55.360 71.102 79.076 87.046 94.670 97.594 114.263 127.974 135.677 119.433 Sum of Discounted CashF 750.401 10% 9% 3% 17% 12% 6% -12%
Terminal Value 1.819.606
Net Operating Assets - 26.889 9% 9% 9% 9% 9%
EV 2015 2.543.117
Net Debt (2015E) 96.867
Equity Value 2.446.250 # Shres (millions) 46.604
Traget Price (€) 52,49
Table 1. DCF Model (Base Scenario)
Source: Novasbe Research
Table 2. WACC
Source: Novasbe Research
Discount Rate
Risk Free 2,63%
Market Premium 6,6%
Beta 0,75
Cost of equity 7,6%
Cost of debt 3,3%
Tax rate 30%
Target D/E 3,2%
WACC 7,4%
Valuation
We value Viscofan through a DCF Valuation Model and reach a target share price of Eur 52,49 per share. Please notice that this regards our base case scenario.
Main assumption in the weighted average cost of capital
(WACC)
Our DCF valuation is entitled of 7,4% Wacc at which we discount our expected free cash flow.
In order to derive Viscofan’s shareholders required rate of return we used the CAPM
approach. In a scenario of low interest rates we used the average yield on 10y bunds for the last ten years as a proxy for the risk free rate. This resulted in 2,63% risk free. When comparing to the current 0,8% yield on a 10y German Bund or even with the 20y German bund yield of 1,3% we believe an average is a better representation of what can be the return of a risk free investment over the next 10 years since it avoids the biased towards really low rate levels (10y bund) and it also prevents for liquidity risks associated with the 20y bund. Furthermore, in the long run, the risk free rate should move towards the growth rate of the economy, which is forecasted by the IMF to equal 2,7%.
“VISCOFAN SA” COMPANY REPORT
Figure 1. Growth Rate Figure 2. Sustainable growth rate
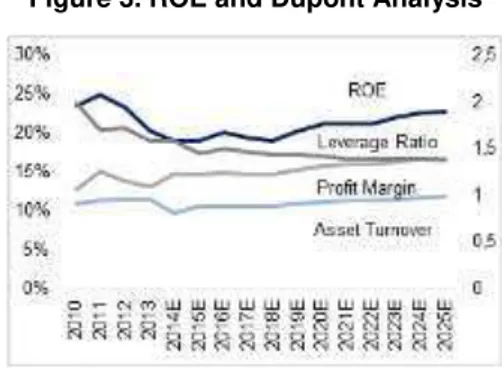
Figure 3. ROE and Dupont Analysis
Market Growth (Eur) Weights (2025
Europe 2,0% 47%
North America 1,3% 20%
China 5,0% 13%
Latin America 4,0% 14%
g 2,38%
LR Sustainable Rate Inputs
ROE 21%
Profit Margin 16%
Asset Turnover 93%
Levarage ratio 1,39
Retention ratio 12%
g 2,46%
Source: Novasbe Research Source: Novasbe Research
Source: Novasbe Research
Considering an historical market risk premium of 6,641% we reach a cost of equity
equal to 7,6%.
Viscofan does not have tradable debt instruments. To assess the company’s cost of
debt, we used Moody’s rating methodology for Global Packaging Manufacturers2 in
order to assigned a hypothetical credit rating and from that rating derive an accurate yield, recovery rate and probability of default. According to Moody’s methodology for the industry, Viscofan was assigned an weighted average score of 2,00 which
corresponds to Aa1 credit rating. The fact that Moody’s attributes a credit rating for the
Spanish Government Debt of Baa2 was not an issue since we estimate more than
70% of Viscofan’s revenues are outside Spain (more than 50% are outside Europe). Given a credit rating of Aa1 and Moody’s market implied CDS spread of 0.7% , an
average default probability of 0.061%3 and an average recovery rate of 75.1%4 , we
estimate a Viscofan’ cost of debt equal to 3.32% (in line with average interest
expense).
Terminal Value and Growth Assumptions
Our long term growth was derived from what we believe will be the market growth for casings in all geographies (Fig 2). In the long run, we see European market growing with inflation, which should be around 2% (ECB target). Given its mature state in the long run, the North America market should also evolve at a 2% inflation rate, which when converted for euros yields approximately 1,3% growth. Given the nature of Chinese and Latin America markets for casings we estimate these should growth 3% and 2% above inflation5 (3,5% and 4,63% respectively) in the long run, which when converted to euros yields a 5% and 3,5% long term growth, respectively. Matching with
1 Siegel, Jeremy J. 2005, Perspectives on the Equity Risk Premium
2Mopdy’s Report on Rating Methodology for Global Packaging Manufactures, June 2009. The methodology used includes a broad series of rating factors, such as Coverage and Leverage, Operating profile and Competitive Position. Given the old date of release,
credit ratings and credit scores were updated in accordance with Moody’s Rating Methodology for Global Packaged Goods, Jun 2013. For more detail on how we derived Viscofan’s Credit rating see appendix x.
3Moody’s Annual Default Study: Corporate Default and Recovery Rates 1920-2013; Average rate for Aa1 letter rating 4 Moody’s Annual Default Study: Corporate Default and Recovery Rates 1920-2013; Rate estimated for 1st Lien bank loans
5
“VISCOFAN SA” COMPANY REPORT
Cash Flow 2026 187.178,5
Revenues 1.155.054 Long term Ebita margin 28%
Ebitda 325.302
Noplat 200.355
Capex 75.116
Ch Working 9.421
g 2,38%
Terminal Value 1.818.960
Figure 4. Perpetuity Cash Flow
Source: Novasbe Research
the company’s exposure to each geography, we estimate Viscofan long term rate to be
approximately 2.38%.
This goes in line with our estimation for Viscofan long term sustainable growth rate (2,46%), which we estimated as the product between the long term ROE (21%) and
retention ratio (12%). Growth is mostly supported by a high ROE and not much by what the company is retaining, since it distributes almost all Net Income. We shall discuss what drives dividend policy later in section of this report. We believe the company's ability to sustain a ROE at 21% in the long run because i) it is in line with what have been the company's historical return on equity but slightly lower because we are not considering the existence of another investment phase such as the one Viscofan is right now; ii) it is supported by relatively high profit margin (16%) and asset
turn over (93%).
These inputs are also in line with the last 5 years of our analysis, as illustrated in Figure 4, and are already reflecting an approximation to the steady state (constant rates, stable margins, constant payout). We should also highlight the small leverage ratio at 1.39, which leaves a door open for increasing shareholders return.
Finally, Viscofan ultimate cash flow was carefully estimated. Figure 5 illustrates the
most important components. The company’s NOPLAT is calculated under a long term
Ebitda margin of 28% (in line with our estimation for the last 5years) and is sustaining a 19% ROIC. This is not only in line with our estimations for the ten period analysis, but also with usual historical high ROICS of this industry (see appendix). Even not considering substantial high investments in the analysed period (low reinvestment rate) that could be in the origin of high ROIC (via growing NOPLAT), we believe the 19% ROIC is justified by i) temporal lag in the NOPLAT, leading to higher ROICS 5-10years after the investment period. Therefore, the 20% ROIC should be a reflect of the current investment period as it is slightly above current ROIC of 17% ii) we do not foresee another intensive investment plan, such as the one Viscofan is currently engaged, but we expect capacity adjustments, with incremental capex in the last three years of our analysis to support market demand in the steady state. Our long term Eur75m capex should be able to cover depreciation (92%) and small capacity increases (8%) forever
and thus, sustain the company’s ROIC.
“VISCOFAN SA” COMPANY REPORT
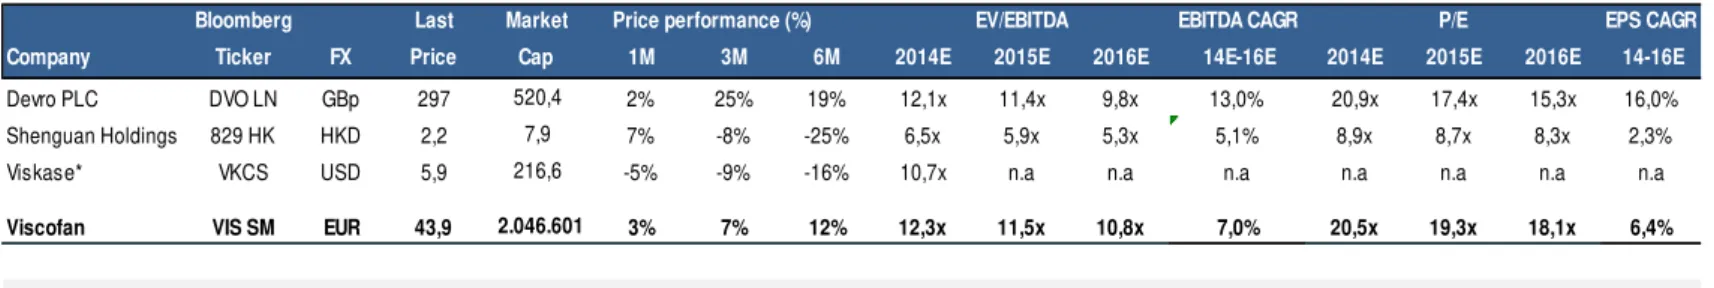
Bloomberg Last Market Price performance (%) EBITDA CAGR EPS CAGR
Company Ticker FX Price Cap 1M 3M 6M 2014E 2015E 2016E 14E-16E 2014E 2015E 2016E 14-16E
Devro PLC DVO LN GBp 297 520,4 2% 25% 19% 12,1x 11,4x 9,8x 13,0% 20,9x 17,4x 15,3x 16,0%
Shenguan Holdings 829 HK HKD 2,2 7,9 7% -8% -25% 6,5x 5,9x 5,3x 5,1% 8,9x 8,7x 8,3x 2,3%
Viskase* VKCS USD 5,9 216,6 -5% -9% -16% 10,7x n.a n.a n.a n.a n.a n.a n.a
Viscofan VIS SM EUR 43,9 2.046.601 3% 7% 12% 12,3x 11,5x 10,8x 7,0% 20,5x 19,3x 18,1x 6,4%
Median of Glonal Peers 11,4x 11,4x 9,8x 7% 20,5x 17,4x 15,3x 6%
P/E EV/EBITDA
Table 3. Multiples
Figure 5. Historical EV/Ebitda Figure 6. Historical PER
Source: Bloomberg Source: Bloomberg
Source: Bloomberg , Novasbe Research
Multiples Valuation: Slight Premium
Viscofan is currently trading at an EV/EBITDA of 12.3x and at a PE of 20.6x. This is highly above its historical average (EV/EBITDA of 8.81x and an average P/E of 17x; Figure 5 and 6) and represents a slight premium when compared with the median of its peers.
The company is trading very much in line with Devro, its closest peer, not only in terms of EV/Ebitda but also in earnings. However, when compared with Shenguan, the Chinese player, Viscofan trades at a big premium. Notice that, Shenguan is quoted at very low multiples when compared with the industry, and is in fact, pushing it down. The very low multiples are explained by the recent allegation of fraud. Shenguan is being accused by Emerson analyst who claim the company have inflated profits and
artificially suppressed costs. On September 3, Shenguan’s shares were suspended
and resumed trading on September, 29, falling 11,4% to HKD2.4. The company bought back three million of its own shares for HKD 7,86on September 30 after 14million for HKD 33.32 on the day before. The word of war continues between the company and the group of analysts and we believe this is pressuring down Shenguan
“VISCOFAN SA” COMPANY REPORT
Figure 1. Geographical Presence
Source: Company Data
leadership position in the market and is the only payer producing the four type of artificial casings. Moreover, Viscofan is the only company with manufacturing plants in all geographies, North America, South America, Asia and Europe; the only with collagen extrusion plant in Latin America and the first investing in China (excl. Shenguan). Overall, if the premium is significant, we believe it is justified by the above aspects.
Company overview
Company Snapshot
Viscofan is one of the leading players in the artificial casings market, belonging to the Materials sector, and in particular, to the Containers& Packaging Industries. Its core business is the manufacture of artificial casings for the meat industry. The company is based in the Navarro (Spain), and currently has casings production sites in Spain, Germany, US, Mexico, Czech Republic, Serbia, China and Uruguay and supports its international sales through a network of commercial offices in the mentioned countries plus Canada, Costa Rica, United Kingdom, Russia and Thailand.
Viscofan is the most diversified company in the sector, producing all type of artificial casings- edible and non-edible collagen, cellulose, plastic and fibrous. Today, the company is the leader in the artificial casings market with 28% market share.
Along with its casings business, Viscofan had also engaged on the healthy and convenience food market industry through several small acquisitions. Among them we give special highlight to the acquisition of the Industrias Alimentarias de Navarra (IAN group) in 1988. The IAN group is a Spanish market leader in vegetable foods (canned olives, asparagus, other vegetable and fruits), with a clear, noteworthy lead in canned white asparagus. In November 2014, Viscofan announced the disposable of the IAN group, which we shall evaluate in more detail further in this report.
In 1993, Viscofan started its first co generation plant in Caséda, Spain. More recently, the company built another cogeneration plant in Latin America and expanded its plant in Spain. The energy produced in this plants is on the one hand conducted to their own production process and on the other end is distributed and sold, representing extra source of revenue. This slice of revenue is usually associated with its casings business although it is not part of its core activity.
Brief History
“VISCOFAN SA” COMPANY REPORT
Figure 2. Cellulose Casings
Source: Company Data
founder Jaime Enchevarría Abona incorporated his company as Viscofan SA, Industria Navarra de Envolturas Celulosicas.
In 1986, Viscofan became a public company, listing on the Bolsa de Madrid. It was upon this step that the company begun its internationalization process, by opening sales and distribution subsidiaries in a number of key markets, where sausages sales were traditionally high.
In 1990, the group took a major step when acquiring Germany’s Naturin GmbH, roughly four times Viscofan size, which was specialized in the production of artificial casings using collagen. The company was entering a period of internationalization with the main goal of producing casings in different materials.
In 1991 the company turned its attention to the Latin America where it established a sales and distribution subsidiary in Brazil, itself the largest casings market in South America. Viscofan soon deepened its Latin American presence, building a cellulose plant in Brazil in 1993. In 1999, the company built a third facility, adding further extrusion capacity. The new facility not only allowed Viscofan's Brazilian subsidiary to become autonomous, but it also enabled the company to claim leadership in the Latin American market.
The ending of patent restrictions in North America (its competitor Viskase had a cellulose technology patented) allowed Viscofan to begin selling its casings in Canada, followed by the United States, in 1994. The move came at a crucial moment, as Viscofan's two primary competitors in the United States--Devro, and especially Viskase--had both run into financial difficulties.
Today, Viscofan is world leader with 28% market share thanks to solid organic growth recorded since its foundation and a successful acquisition policy that have allowed not only gain scale, but also achieve geographical and product diversification.
Products
Cellulose
The first being produced, Cellulose casings are made from natural cellulose and used primarily in the manufacture of industrially cooked sausages such as frankfurters, Vienna sausages or hot-dogs. The product’s first stage is the extrusion progress, where the cellulose is converted into a usable raw material (viscose), from which the casings are made of. The cellulose molecules are then chemically and mechanically depolymerized and subsequently depolymerized in cylindrical or tubular form
according to the customer’s requirements. The product goes through processes of
“VISCOFAN SA” COMPANY REPORT
Source: Company Data
Figure 3. Collagen Casings
Source: Company Data
Figure 4. Plastic Casings
Source: Company Data
Figure 5. Fibrous Casings
Collagen- The Golden Pearl
Collagen casings use collagen as their raw material. Collagen is obtained from cow and pig hides and processed using sophisticated technology so that it can be shaped into casings.
Collagen casings are of two kinds: small caliber (fresh sausages, Bratwurst) and large calibre (salami, Bierwurst). Besides being an edible material, the key difference from other type of casings lies in the thickness of the casing wall and the way the collagen is processed to withstand a given degree of stress when filled and holding in the weight of the meat. Because they are edible they reach the consumer more often and therefore may present different colors and logos.
The greater strength and consistency of this material have helped fresh and gourmet sausages producers to increase their level of productivity and consequently to better face the accelerating market growth. This have been a key driver in a replacement of natural casings to artificial casings, as the first allow for a small level of industrialization and are associated with higher health risks.
According to Devro, clients who chose artificial casings (collagen) over natural casings would, on average, save approximately Eur16 per 100kg of meat (Eur7.81 when using collagen casings vs Eur24.19 with natural casings). The difference lies essentially in the number of meters used (485m vs600m) and in the efficiency of the filling and smoking processes (higher filling speed, quicker smoke uptake and less drying time) with artificial casings.
Therefore, the shift from natural to artificial materials have also greatly contribute to
organic market growth, which shall be discussed in the “Market Overview section” of this
report.
Plastic Casings
Plastic casings are made from a range of polymers. Viscofan makes a wide variety of plastic cases for different product application and this product offers stronger barrier properties, mechanical strength, thermal shrinkage, peeling and heat resistance.
Fibrous Casings
“VISCOFAN SA” COMPANY REPORT
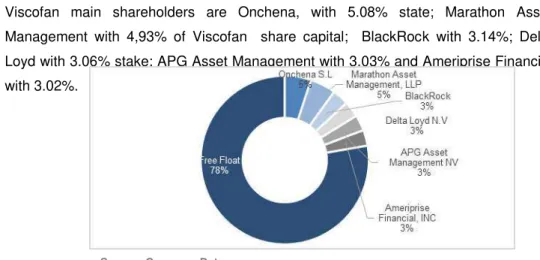
Figure 5. Shareholder Structure
Source: Company Data
Production Process
Although looking simple products, there is a very high sophisticated technology underlying the casing manufacturing process, which we highlight that only a few companies worldwide have developed. The small calibre of sausage production industry requires products with extremely high quality features at competitive prices, in order to make the large scale of sausages possible.
A typical Viscofan’s plant is usually composed of two extrusion mills- one for collagen and one for cellulose, with one common converting plant with an R&D area and two cogeneration sites. There is higher complexity in the extrusion site when compared with the converting because the first includes not only the treatment of raw materials but also because it involves different processes for heating, cooling and cleaning the casings whereas in the converting site, the casings only suffer a compression progress to reach their final shape.
The artificial casing production is specific to each client tastes and therefore, process lines are specific for each different product. However, the actual cost of the casings represents only a portion of 5%-15% of the unit cost of a sausage.
Entry Barriers- capital intensive, specific technology and lack of pricing power
If on the one side, we see lack of pricing power by casings producers, on the other, we see a very capital intensive industry coupled with specific technology. We believe these are probably the stronger entry barriers in the market and therefore, we are not expecting new entrants in the future. This means that, besides representing a very low cost in sausage production, all the profitability of this market in expansion will, in our view, be allocated to the experienced existing producers: Viscofan, Devro, Shenguan and Viskase. This is also the reason why there is only four main casings producers worldwide.
Shareholder Structure
Viscofan main shareholders are Onchena, with 5.08% state; Marathon Asset Management with 4,93% of Viscofan share capital; BlackRock with 3.14%; Delta Loyd with 3.06% stake; APG Asset Management with 3.03% and Ameriprise Financial with 3.02%.
“VISCOFAN SA” COMPANY REPORT
Figure 1. Market Share
Source: Novasbe Research
Competitors
There are four main players in the artificial casings market: Viscofan, Devro, Viskase and Shenguan. Given the nature and final destination of the main product (it
becomes part of sausages and other stuffed products’ production process), there
are several local producers which because of their small dimension will not be part
of our peer’s analysis.
Devro is a UK player and the pioneer in the development of edible collagen casing. Although, the company is mostly focused on the production of collagen casings, it
also produces plastic and fibrous types. Currently Devro has manufacturing plants in the USA, UK, Australia and Czech Republic but sells to all over the world. In 2013, 26% of its revenue were coming from America (17% US and 6% others), 47% from Europe and 29% from Asia.
Viskase is a North American player which focus most of its business in the production of cellulose casings. It also produces plastic and fibrous casings. Viskase is in fact, the ancient player in the artificial casings market and the big creator of the first cellulose casing. Its technology was patented in the North America region and only after its expiration could Viscofan and the other players commercialized cellulose casings. Today, Viskase has manufacturing plants in the US, France, Brazil, Mexico and Philippines. In 2013, 55% of its revenue were coming from North America, 14% from South America, 40% from Europe and only 6% from Asia.
Shenguan Holdings is, according to the China Meat Association, the larger manufacture of edible collagen sausages casings in China and the dominant player in Asia in the collagen family. With more than 90% market share, the company is solely focused in the production of collagen casings. The group has three plants, all located in China where it concentrates more than 90% of its sales. Currently, Shenguan Holdings has an installed capacity of more than 5 billion meters of casings, covering 50 different styles of Chinese and Western sausages.
“VISCOFAN SA” COMPANY REPORT
Source: Novasbe Research
Figure 2. Market Segments
Given the recent market expansion and the estimated potential in the future, these companies are producing at almost full capacity and for that reason have recently engage in big investment plans. Devro, for instances, started in February 2014 the construction of a new manufacturing hall adjacent to its existing plant in Sandy Run, South Carolina. According to a company release, this £40m investment is expected to improve efficiency by lowering production costs £8m per annum. Over the next five years Devro plans to increase its market share in the North America region to 35%. In our view, this represents a very optimistic number since we estimate Devro to have currently 10% of the US market. The company plans regarding the Asian market and China in particular are quite conservative.
Devro reported its intention to construct a manufacturing plant in China to start production in 2016. In our opinion this investment comes with some delay and we do not see any threat to Viscofan given its earlier entrance. However, we do see some damage for Shenguan as the company is the unique player and Asia region is its only market.
Clear competitive Advantage
In our view, none of this companies is an exact match of Viscofan profile. The company is the only player producing all type of artificial casings and 45% of its clients purchase the four different types (Figure 2). Moreover, we see Viscofan strategy one step ahead of its peers since the company is usually the first player investing in a specific geography (China, for instances) and therefore, the first to enjoy market growth opportunities. As a result, Viscofan is the only player with manufacturing plants across all geographies (Asia, Europe, North America and South America), the only with a collagen production site in Latam and the only with manufacturing sites in China (excl. Shenguan).
Because of its competitive advantage and timely investment opportunities (especially in emerging markets) we believe Viscofan is better positioned than its peers to enjoy the next decade of growth.
“VISCOFAN SA” COMPANY REPORT
Figure 3. Revenues (Eur millions) Figure 4. Ebitda Margins Figure 5. Net Debt (Eur Millions)
Source: Novasbe Research
Source: Novasbe Research Source: Novasbe Research
Figure 6. Capex (Eur millions) Figure 4. ROE
Source: Novasbe Research Source: Novasbe Research
Key Figures
Viscofan revenues have been more than three times higher than its peers and
therefore we expect this tendency to be verified in the future, reinforcing the company’s
competitive advantage and strategic position in emerging markets.
“VISCOFAN SA” COMPANY REPORT
Figure 1. Meat Consumption per capita
Source: FAO Statistics
Besides the growth potential that has been verified, the sector is also characterized by companies with very low levels of debt (Figure 5). Not only Viscofan, which, according to our estimates, has a Net Debt/EV of 3,2%, but also Devro, Shenguan and Viskase display very light balance sheets. In fact, Viskase is the only player with listed debt. Viscofan has taken more aggressive investments when compared to its peers, as illustrated in figure 6 by the increasing capital expenditures. Again, this shows that Viscofan strategically positioned itself earlier on than its peers, which in our opinion, is on the origin of the company fast growth and leadership position. Note however, that Devro is now engaging in new investment plants and hence capex figure has been increasing in the last years. Yet, with some delay when compared with Viscofan.
When analyzing all company’s return on equity, we see it has a similar evolution to Ebitda margin. Shenguan has the highest ROE, and highly above the industry average. By doing a Dupont analysis on ROE, we see that Shenguan ROE is driven by its high profit margin of 46% on average. When compared to the most similar peers, Devro and Viskase, (as they share the same geographical areas), Viscofan shows the higher historical ROE. On the origin of higher ROE we find a more efficient asset turnover and slightly above profit margin, for a lower leverage ratio, when compared to Devro and Viskase.
Market Overview
Meat Consumption, Population increase and changing eating
habits
It is usually assumed that, the wealthier the country, the more meat its citizens consume. Therefore, it should not be surprising that the heaviest consumers of meat worldwide are the US, Europe and Australia.
“VISCOFAN SA” COMPANY REPORT
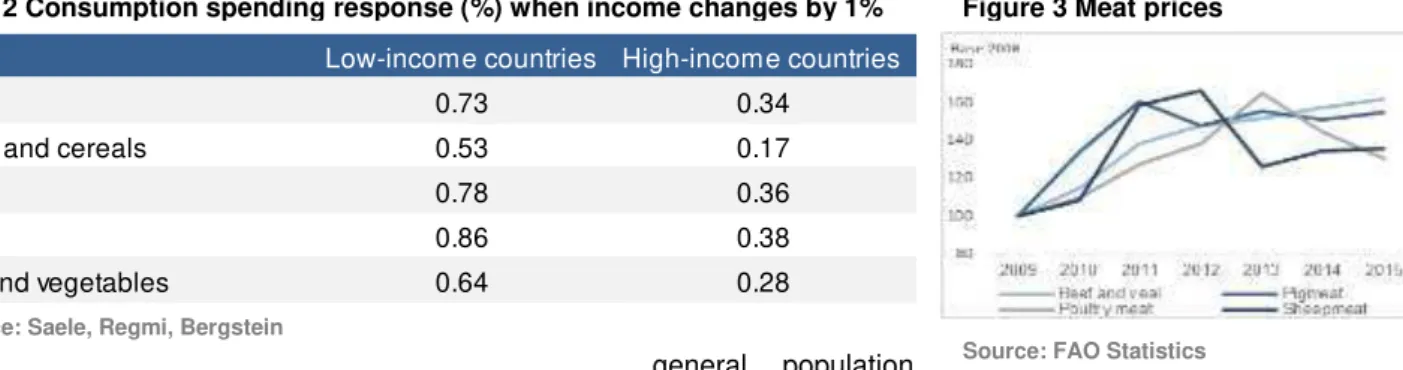
Figure 2 Consumption spending response (%) when income changes by 1% Composition
Low-income countries High-income countries
Food 0.73 0.34
Bread and cereals 0.53 0.17
Meat 0.78 0.36
Dairy 0.86 0.38
Fruit and vegetables 0.64 0.28
Source: Saele, Regmi, Bergstein
Figure 3 Meat prices
Source: FAO Statistics
Figure 4. Total Casings Market
Source: Novasbe Research, Company
Meanwhile, growth in the worldwide population, expected to reach 7bn in 2014 and the tendency towards urbanization, have played an important role in the meat market. In
general, population
have been growing 1% on year with greater emphasis to developing economies such as China and Brazil. The trend is expected to continue until 2020 where it should decelerate to an early growth of 0.5%. This is mainly driven by the expansion in economic activity and healthier hygienic habits in emerging regions.
People are also moving from rural areas to urban centres and World Bank data shows that in 2013, 53% of the population was living in city centres, representing this number a significant increase when compared with 48% in 2002. Again, this is expected to be amplified in the upcoming years.
Not surprisingly, these social economic trends have been and are still playing a significant role in the globalization of eating habits across the globe.
Again, this is mostly felt in emerging regions, where cereal based diets are being replaced by higher level of animal protein.
Empirical Studies point upside to existing consumption for all major food categories (Figure 2) but highlight for higher consumption towards more expensive goods such as meat and dairy products. As a consequence of urbanization and improved wealth, it is expectable that food retail will adapt to urban middle class, with a taste for more meat and dairy products.
As said, during the 2009-2013 period, producers were driven by an increasing meat demand, and consumers felt the pressure of increasing meat prices. With the exception of poultry meat, all meat prices are expected to increase in the near future (Figure 3).
Artificial vs Natural
–
Technological Transformation
“VISCOFAN SA” COMPANY REPORT
technological progresses in recent years, which makes produces replace animal intestines by artificial casings.
We expect it to became more intensive in the future as it allows meat producers to achieve higher productivity levels: on the one hand, they can enjoy lower production costs as artificial casings do not need to be stored in a chilled environment, are ready to be use and allow product standardization, which facilitates the packaging process. From the hygienic point of view microbial contamination is negligible, refrigeration is not needed and there are no spoilage problems during transport and storage (FAO Statistics).
Given the natural casing represent almost half of the total casings market, a total shift would mean doubling of volumes. We believe this should highly contribute to strong growth in the artificial casings markets in the near future, especially in the collagen family as it is the direct substitute of natural gut, and therefore contribute with higher revenues for Viscofan.
Structural drivers for market growth
We shall now summarize what we believe are the main structural drivers for artificial casings market growth:
1. Population increase, which should increase overall meat demand
2. Higher meat consumption per capita due to a change in eating habits and urbanization levels in emerging markets leading to packaged meat, such as sausage, as the main source for animal protein consumption.
3. Shift from natural to artificial casings as sausage producers look to increase their output and improve the efficiency of their industrial process.
In this context, the demand for casings is growing all over the world, as part of a process which we believe is not complete due to significant imbalances between population, eating habits, and technology. The global population is expected to reach approximately 7bn in 2014, of whom 85% live in emerging countries which produce 64% of global poultry and pork meat (62% in 2008) In the next subsection we detail our estimation for the artificial casings market.
Casings market- amplifying the meat effect
Sausages are among the cheapest processed meat products available and are
becoming quite popular in developing markets as consumer’s transition away from cereal based diets to more intensive animal protein habits. As a consequence, casings market have been booming in the last decade.
“VISCOFAN SA” COMPANY REPORT
Figure 5. Global Casings Market Evolution
Source: Company Data, IMF estimates, FAO statistics
The total market for casings is therefore the sum of the five different markets estimated, namely North America, Latin America, Europe, Asia and Pacific (where we specifically estimated China) and Africa. Due to the small size of Africa we disregard it in our analysis.
Similarly, A.Casings expenditures per capita was defined as:
Therefore, the amount people spend on casings depends on the one side on their forecasted level of meat consumption in the future, adjusted by the evolution in meat prices (meat expenditures per capita) but it also depends on the evolution of the proportion between casings expenditures and meat expenditures per capita.
In order to estimate meat expenditures per capita we used we used OECD-FAO data estimates on the levels of meat consumption and meat prices for the five geographies in analysis. The first part of the equation is more subjective and hence was estimated according to historical trends (and with the qualitative information described in the previous sub section (social economic trends). Therefore, it varies from geography to geography. For instances, in China, both meat expenditures and the proportion between casings and meat expenditures have increased. This indicates that people are not only consuming more meat but they are also shifting their meat consumption towards sausages, for instances (packed meat in general).
“VISCOFAN SA” COMPANY REPORT
Source: FAO Statistics, Company Data, Analyst estimates
Figure 6. Casings Expenditures per capita
Figure 7. North America Revenues (Eur Million)
Source: Analyst estimates
Figure 9. North America Revenues (Eur Million)
Given the importance of
emerging countries – our key growth markets, we shall evaluate this geographies in more detail.
Mature Markets- Europe and North America
It was in Europe and North America that Viscofan first saw its potential market. The mature nature of both regions with stable population growth and increase GDP levels are very representative indicators of the amount of meat consumed. As previously illustrated, meat consumption in this regions had suffered significant improvements over the last years.
North America
The taste for traditional processed meat such as spicy sausage, salamis, and the fashion regarding American hot dogs were great catalyst for the casings market in this region. Therefore, not only meat consumption had been increasing, but there have also been a shift towards processed meat, illustrated by the increasing in casings
expenditure per capita from €0.9 in 2009 to €1,14 in 2013
The market has grown at a 2009-2013 CAGR of 7% and Viscofan had 36% market share. However, we are not expecting further increases in the level of expenditures per capita in this region as improvement in economic conditions are associated with healthier eating habits and hence possible decrease in packed meat consumption. Nevertheless, we believe that demand rigidity for sausages (popularity of the American hot dog) will held expenditures in casings around Eur1,14 per capita. Overall, we expect the market to growth at a five year CAGR of 0.5%, mostly driven by population increase in the US.
Revenues in this region represented 31% of Viscofan’s revenues in 2013. These are
“VISCOFAN SA” COMPANY REPORT
Figure 8. Casings Expenditures per capita Figure 9. Europe and other Asia Revenue (Eur Million)
Source: Novasbe Research Source: Company Data, IMF estimates, FAO statistics
improvement in Viscofan’ market share which we estimate to stabilize at 39% in 2020 (36% in 2014). By the end of the period under analysis (10 year horizon) we expect this to represent only 20% of Visofan´s revenues mainly due to the increase foreseen
in emerging markets’ revenue. Europe
Similar to North America, Europe is also a mature market where population eating habits will tend to improve as income level rises. However, this trend is most felt in Europe than in the US where casings expenditure per capita are decreasing since
2009 at €1.1 to €1.03 in 2013. In Europe, we expect periods where meat consumption
increase but casings expenditure decline. As illustrated in the figure 9, this means people will tend to shift meat consumption towards higher quality meats,
Depending on the regions in Europe casings expenditure per capita should vary
between €1.01 and €1.06 per capita in a 10 year horizon and the market in Europe
should growth at a five years CAGR of 1%.
Regarding revenues, Viscofan disclosures European revenues together with Asian’s (but in our analysis we excluded China, given the growing importance of this market). Therefore, the combined revenues (Europe+ other Asia) will be mostly driven by the Asian market (excl. China) and by slight improvements in market share, which in turn, is expected to achieve 32% (from 29% in 2013) for the European and rest of Asia region. This market should keep weighting 45% on Viscofan revenues for the remaining of analysed period, since what may possibly be loss in Europe is offset by the Asian market.
Key Growth Markets- Latam and China
“VISCOFAN SA” COMPANY REPORT
Figure 11. Casings Expenditures per capita (Eur) Figure 10. Collagen Casings vs Artificial Casings
Source: Company Data, IMF estimates, FAO statistics Source: Company Data, FAO statistics, Novasbe Research
Figure 12. Chinese Revenues (Eur Million) Figure 13. Casings consumption per capita
Source: Novasbe Research Source: Company Data, IMF estimates, FAO statistics
Although casings sales have accelerated over the past years, per capita consumption is still significantly below European and North America levels (Figure 11).
China
China is not only becoming one of the greatest meat consumers worldwide but it has already reach the number one position in meat producer (FAO statistics). The artificial casings market growth in China has been exponentially. This has been mostly driven by the expansion of the collagen family that saw its market size in China increase more than 6x since 2006 to Eur250m in 2013.
This accelerated consumption of collagen should not come as a surprise in this region. Firstly, China is highly suffering from urbanization and globalization of eating habits, which is increasing the popularity of the western-style sausage. Secondly, the country
is the world’s biggest meat producer, which also include processed meat. As
“VISCOFAN SA” COMPANY REPORT
Figure 14. Processed Meat market in China
Source: Shenguan IPO
As a response to this growth opportunity, Viscofan plans to have full control in the production cycle of collagen casings. The company opened a converting collagen plant in 2010 (Eur 8m investment) and built a collagen extrusion plant in Suzhou, China,
which started production in 1Q 2013. The company’s plan is to achieve 15-20% market share in China by 2015-2016.
We believe Viscofan will reach this goal given that i) competition in China is limited. As previously, Viscofan main competitor in the Chinese market is Shenguan Holdings. Shenguan has its production fully specialized in the collagen casings family where it is market leader with approximately 90% market share in the Chinese Market. Shenguan has more than 5Bn meters of installed capacity in China and is now using 93%, after engaging in an expansion plan due to the fast-growing nature of the casings market in China; ii) the company is being able to increase its market share (estimated to be around 10% in 2013 and coming from an 8% market share with only one year of running operations) by taking advantage of the growth of the market and clients desire for supplier and product diversification.
“VISCOFAN SA” COMPANY REPORT
Figure 16. Latin America Revenues (Eur Million) Figure 15. Casings consumption per capita
Source: Novasbe Research Source: Company Data, IMF estimates, FAO statistics
On the one hand, this indicate that not only people is increasing their meat consumption in China but also increasing the proportion of processed meat in their diets. On the other hand, we see casings expenditures per capita in China enjoying the highest increase across geographies with a four year average growth of 17% and
reaching world’s level in 2013 ( world’s expenditure of casings per capita is Eur 0,32).
In line with market growth, we expect revenues in China also to suffer the greatest peaks in the fore coming future at an average growth rate of 15% in ten years period (2015-2025). Again, this should be mostly driven by market size expansion and Viscofan increasing market share, which we estimate to stabilize at 19%
Latin America
Similar to China, Latin America region is also becoming one of the world’s largest
consumers of sausages. It should not come as a surprise as it is the region that has most strongly suffered from dietary changes- moving from cereal based diets to include reasonable levels of animal protein and the cheapest way to do this is via sausage consumption. Reinforcing our previous claim, casings consumption per capita have suffered a growth of 10% on average in the 2009-2013 period.
“VISCOFAN SA” COMPANY REPORT
Figure 18. Capex as % of Revenues) Figure 17. Capex vs FCF (Eur Millions)
Source: Novasbe Research Source: Novasbe Research
Business Strategy and Investment Guidance:
The growth felt in the casings market over the last decade had created the need to provide additional hundreds of millions meters of casings, pressing for increases in capacity in all casings family.
The company’s strong balance sheet have been constantly allowing for big investments amounts. After following a consolidation plan, denominated BE ONE (from 2009-2011), Viscofan had taken timely opportunities to enjoy casings market growth with investments across the globe under its new strategic plan, Be More (from 2012-2015) -Market, Optimization, Returns, Efficiency.
The first half of the Be MORE plan (2012-2013) involved a total investments of Eur 175,6m with the construction of a new collagen extrusion plant in Suzhou, China, which started operations in early 2013 and the construction of a collagen extrusion plant in Uruguay which has already initiated production in the first quarter of 2014. As previously referred, with the investment in Uruguay, Viscofan had not only improved its access to the expanding casings market in Latam but the company had also become the first company in the sector to have a collagen production center in the region. At the same time, Viscofan has also increased its capacity concerning all other technologies in order to respond to a growing demand for volume. Examples of this improvement are the projects carried out in USA, the upgrade of technology in Spain and Germany, the replacement of energy sources in Germany, process automation in Brazil and the Czech Republic and finally the increased production speed in Mexico. In total, investment for capacity expansion, in already existent plants, amounted Eur23m in 2013
“VISCOFAN SA” COMPANY REPORT
for small capacity increases and process update (covering depreciations). This should occur during approximately the next 8 years, with capex as % of revenues slowly decreasing to pre investments levels (Figure 18 ).
In fact, when the company engages in heavy capex project, such as building plants, it only uses around 20% of the available space, leaving the remaining empty. It then plans capacity expansion according to market growth and client demands. This policy reinforces our view that capex in the next years should decrease since expanding capacity should be much less capital intensive than building a new mill (it does not include the costs of the fields, licenses or installation).
In the final three years of our analysis we believe Viscofan will have to make an heavier investment, with capex as % of revenues reaching again 10%, in order to strongly expand its producing capacity for an undetermined future. Notice that, no plant will be constructed but capacity will be substantially increased inside the existing plants, when compared to 2014-2022 period. This way, we are confident that the company will be able to bear casings market demand in the future (assuming a capex of 7% revenues in perpetuity, as mentioned in the Valuation section) and above all sustain a 19% ROIC.
“VISCOFAN SA” COMPANY REPORT
Sales Drivers 2013 2014E 2015E 2016E 2017E 2018E 2019E 2020E
Revenue 2% 3% 6% 6% 3% 3% 7% 6%
Organic Growth 6,4% 4,0% 5,2% 6,7% 4,4% 3,5% 7,4% 6,2%
Forex -3,8% -1,3% 0,6% -1,3% -1,1% -0,9% -0,9% -0,8%
Cogeneration -0,8% -0,1% 0,1% 0,1% 0,1% 0,1% 0,1% 0,1%
Source: Novasbe Research
Figure 1. Revenue Growth Model
Financials
Solid Revenue Inflows as market booms
We forecast solid revenue evolution on the back of resilient growth and increased market share position on the main markets over the forecasted period (2015-2025).
Our revenue model defined revenue growth as the sum of three different impacts we have carefully taken into account.
Firstly, growth will manly came in the form of organic growth. Organic growth is the weighted average between each geography revenue growth and correspondent weight
of that geography in the company’s revenues. As explained before, revenues per
region depend on the evolution of the artificial casings market (derived from casings expenditures per capita and meat expenditures) and the gain or loss of Viscofan market share in that region.
We estimate organic growth rates to be between 5% and 7% for the given horizon, fuelled by intensive expansion in emerging markets and by the ramp up of the new collagen production plants in Uruguay and China.
Secondly, forex activity. Foreign exchange rate activity have played a crucial role when determining the actual growth rate in revenues.
Since Viscofan had operations across the globe, the company is subject to currency risks, which became a matter of greater concern in the aftermaths of the financial crisis.
“VISCOFAN SA” COMPANY REPORT
Source: Novasbe Research, IMF
Figure 2. Forex Activity
Source: Novasbe Research
Figure 3. Viscofan’s Revenues (Eur Million)
Figure 4. Ebitda (Eur Million) and Ebitda Margin
Source: Novasbe Research
Figure 5. Gross Margin
Source: Novasbe Research
Again, this impact is mostly coming from emerging market countries, where inflation is expected to continue high, and higher than in the Euro Area, leading to the devaluation of its currencies against the euro and consequently loss of purchasing power in these regions. For example, our estimates foresee a 5% and 4% inflation rates in Brazil and China, respectively and a consequent 3% and 2% depreciation of BRL and CHY against the euro. Figure 3 illustrates our forecasts for the foreign exchange rate activity in the fore coming period. These would have been a good proxy for forex in the past. Lastly, we took into account the effect on revenue coming from the co-generation plants, which results from selling and distributing energy. This represents around 7% of total revenue on average and therefore we do not expect it to have much impact on total revenues.
Margin Recovery and Ebitda growth
The company’s gross margin has historically been around 79%. However, during 2012
“VISCOFAN SA” COMPANY REPORT
Figure 6. Gross Margin
According to a report released by GIA (Gelatine: A Global Strategic Business Report) the forecasted CAGR for the gelatin market in Asia is 4.1% over the next five years. The increasing use of gelatin in the pharmaceutical industry (in the form of gelatin encapsulated medicines) and its hydro colloidal properties that can provide chewiness, texture, foam stabilization, water-binding properties, creaminess, fat reduction and texture to various food products, had been in the origin of the increase demand for this product and consequently to an increased demand for collagen and collagen raw material prices.
This increase in collagen raw material prices led to a huge gross margin decrease (to 71,8% and 70,2% in 2012 and 2013, respectively) and a consequent EBITDA margin reduction in 2013 (from27.3% to 25.8%)
We expect prices to continue to increase but at a slower pace and Viscofan has already showed its intention to seek different suppliers of collagen raw materials in order to efficiently improve margins. Therefore, we do not expect margins to keep its downward trend but instead we are waiting for slightly improvements to be seen already in 2014. Nevertheless, our expectation are that gross margins will not return to 2011 levels given the higher demand for collagen not only in the casings market but in other markets and will stabilize somewhere around 74% in the long term.
As for the Ebitda margin, we do expect some recovery and slightly improvements during the upcoming years mainly on the back of strong revenue growth and cost dilution. We see with great probability cost dilution through reduction in personal costs. In the short term, we expect personal to keep its pace, with number of employments growing on average 6%, mainly due to the construction of the new production plants, requiring higher workforce. However, in the long run we expect cost reduction coming from stabilization in the workforce, with number of employers growing slower at 3%. Hence personnel cost as % of revenue should decrease from 23% (after building plants) to 21,5% leading to ebitda margin improvement. Other operating costs which mainly include energy and transportation cost should evolve very much in line with historical averages and therefore weighting 25% of revenues.
Growing with Solid Balance sheet
Cash Flow Generation and cash is King
“VISCOFAN SA” COMPANY REPORT
Source: Novasbe Research
Figure 7. Net Debt/EV
Source: Novasbe Research
Figure 8. Net Debt/ Ebitda
company’s operation subtracted by i) its main operational expenses (change working capital and taxes); ii) by its debt holder obligations (interest expenses); iii) also taking into account investment outflows, such as capital expenditures. Therefore, whatever cash is left should be used either to pay shareholders or to repay debt obligations.
Lower Net Debt/ Enterprise Value
Viscofan has very low levels of Financial Debt in its balance sheet. According to our estimation, the company has held relatively constant its Net Debt to Enterprise Value around 3,1%. In 2013, for instances this reached 3,7% in order to sustain capex and the usual dividend payment (Figure x).
By going deeper on the company’s capital structure, we see Viscofan’s ability to achieve a net cash position (similar to Shenguan) by 2019. Assuming a dividend
payout of 63%, the company’s Free Cash Flow of Eur 95m would be enough to repay
net debt of 2018 (Eur12m), pay dividends of Eur75m and still leave the company with excess cash on the balance sheet (Figure 8)
However, we believed that the previous scenario is very unlikely to happen because i) the company have kept relatively constant capital structure with no need to significant shifts and ii) debt yields fiscal benefits through tax shields and hence, it is not reasonable to waste an opportunity to save in taxes (even for a moderately small amount).
By further leveraging up its position, Viscofan could enjoy higher fiscal benefit.
Though, the company’s historical conservative profile, showed through very low levels of financial debt even during investment periods, do not leave us in a comfortable position to assume higher debt in the future (especially when we do not expect the construction of another plant).
“VISCOFAN SA” COMPANY REPORT
Source: Novasbe Research
Figure 9. Actual Net Debt/ Ebitda
Note, however that, in the last three years of our analysis (2023, 2024 and 2025), the ratio will be close to 2013 levels of 3,7% due to heavy investment in capacity increases.
Very much in line with historical, we forecast low levels of NetDebt/Ebitda around 0,5x. With robust cash flow generation and low Net Debt levels, Viscofan will keep showing signs of solid balance sheet, which in our view is an important advantage as it gives room to enjoy market opportunities. The company position is more than comfortable to make big investment decisions if demand for casings reveals to be strong and hence, expand capacity with no need to lever its position or ask shareholder extra efforts.
Ian Group Disposal
On the 10th of November 2014, Viscofan announced the disposable of the IAN Group, its vegetable division. The company has accepted the bidding offer made by the Portobelllo Capital Gestión, a private equity firm, to acquire 100% of the issued capital of Ian and its subsidiaries, Lingbao Baolihao Food Industrial and IAN Peru.
Viscofan is expected to receive Eur55.5m which will consist of Eur50m cash payment plus an additional deferred payment of Eur5.5m in three years from the closing of the transaction.
The sale of this business unit does not come as a surprise as this was a non-core business which is unrelated and lacks of synergies with the artificial casings market. IAN Group is the Spanish leader in the canned vegetable division mainly through its Carretilla brand. For the 2014 nine months ended, Ian group revenues (Eur81.8m)
represented 14% of Viscofan’s and EBITDA (Eur 5.5m) with a 4% weight.
“VISCOFAN SA” COMPANY REPORT
Figure 10. Net Profit and Profit Margin
Figure 7. Dividend per shar Figure 11. Net Profit and Profit Margin
Source: Novasbe Research Source: Novasbe Research
We welcome the disposal of these assets and the consequent 100% focus on the artificial casings market business and we believe it may, in fact, come with value creating opportunities. At this stage the company did not provide any guidance on how it will use the proceeds but we believe it has some plans, otherwise its balance sheet would be, in our opinion, inefficient with Net/Debt 2015E 0,2x and achieving Net Cash position soon.
Therefore, we have included in our valuation the payment of a special dividend in 2015 amounting the upfront cash received (Eur50m)- the cash is also assumed to be received in 2015.
What to do with the money?
Higher shareholder remuneration
On the back of strong cash flow generation, low net debt levels and the proceeds received from the disposal of Ian, we expect Viscofan will increase its shareholders remuneration. We point to a dividend per share growth of 13% in a five year period fuelled by higher earnings per share and aggressive dividend policy. By 2020 we expect Viscofan will distribute 87% of its earning and therefore giving shareholders Eur2.7 for each share own. By the end of the 2025, we forecast a payout ratio of 88% and a dividend per share of Eur 3.6, in line with a relatively constant capital structure.
In fact, Viscofan had taken aggressive dividend policies in the past, with dividend per share growing at a 2009-2013 CAGR of 16%. In 2013, the company distributed 51% of its earning through a Eur 1.12 dividend which guaranteed their entrance in IBEX Top Dividend in early 2014. During the last years, dividend yield stood between 2.5% and 2.7% and we expect it to reach the 3% ratio in 2014E and 2015E.
M&A Activity?