Performance of an adult Brazilian sample
on the Trail Making Test and Stroop Test
Kenia Repiso Campanholo1, Marcos Antunes Romão1, Melissa de Almeida Rodrigues Machado1,
Valéria Trunkl Serrao1, Denise Gonçalves Cunha Coutinho1, Gláucia Rosana Guerra Benute1,
Eliane Correa Miotto2, Mara Cristina Souza de Lucia1
ABSTRACT. Objective: The Trail Making Test (TMT) and Stroop Test (ST) are attention tests widely used in clinical practice and research. The aim of this study was to provide normative data for the adult Brazilian population and to study the influence of gender, age and education on the TMT parts A and B, and ST cards A, B and C. Methods: We recruited 1447 healthy subjects aged ≥18 years with an educational level of 0-25 years who were native speakers of Portuguese (Brazilian). The subjects were evaluated by the Matrix Reasoning and Vocabulary subtests of the Wechsler Adult Intelligence Scale-III, along with the TMTA, TMTB and ST A, B and C. Results: Among the participants, mean intellectual efficiency was 103.20 (SD: 12.0), age 41.0 (SD: 16.4) years and education 11.9 (SD: 5.6) years. There were significant differences between genders on the TMTA (p=0.002), TMTB (p=0.017) and STC (p=0.024). Age showed a positive correlation with all attention tests, whereas education showed a negative correlation. Gender was not found to be significant on the multiple linear regression model, but age and education maintained their interference. Conclusion: Gender did not have the major impact on attentional tasks observed for age and education, both of which should be considered in the stratification of normative samples.
Key words: attention, Trail Making Test, Stroop test, demographic analysis.
DESEMPENHO DE UMA AMOSTRA DE ADULTOS BRASILEIROS NO TRAILL MAKING TEST E STROOP TEST
RESUMO. Objetivo: Os testes de atenção Trail Making Test (TMT) e Stroop Test (ST) são largamente usados na prática clínica e em pesquisas. O objetivo deste estudo foi fornecer informação normativa para a população brasileira de adultos e estudar a interferência de gênero, idade e educação no TMT parte A e B e no ST cartão A, B e C. Métodos: Recrutamos 1447 sujeitos saudáveis com idade ≥18 anos, nível educacional de 0-25 anos, falantes nativos do Português (Brasil). Os sujeitos foram avaliados pelos subtestes do Wechsler Adult Intelligence Scale-III Raciocínio Matricial e Vocabulários, além do TMTA, TMTB e ST A, B e C. Resultados: Entre os participantes a média de eficiência intelectual foi de 103,20 (SD: 12,0), de idade 41,0 (SD: 16,4) anos e de escolaridade 11,9 (SD: 5,6) anos. Houve diferenças significantes por gênero em TMTA (p=0,002), TMTB (p=0,017) e STC (p=0,024). Idade se correlacionou de modo positivo com todos os testes de atenção, enquanto a escolaridade correlacionou-se de modo negativo. Após o modelo de regressão linear múltipla o gênero não manteve correlação significativa, mas idade e escolaridade mantiveram sua interferência. Conclusão: O gênero não mostrou grande impacto nas tarefas atencionais como a idade e escolaridade que devem, portanto, ser consideradas na estratificação de amostras normativas.
Palavras-chave: atenção, Trail Making Test, Stroop Test, análise demográfica.
INTRODUCTION
T
he concept of attention is associated with the ability to perceive a stimulus, but this is merely one of the aspects related to this cognitive function essential for the functio-ning of other superior cortical function.1Attention can be deined as a neural
me-chanism that organizes the input stimuli in our consciousness.2 hus, it enables the
pro-cessing of information, thoughts or actions relevant for us to function adequately in res-ponse to emerging needs. herefore, it is not hard to understand why many authors refer to attention not only as the climax of
men-1Psychology Division - Hospital das Clinicas, University of São Paulo, São Paulo, Brazil; 2Neurology Department - Hospital das Clínicas, University of São Paulo,
São Paulo, Brazil.
Kenia Repiso Campanholo. Av Min. Petrônio Portela, 2001, 222E – 02802-120 São Paulo SP – Brazil. E-mail:[email protected]
Disclosure: The authors report no conflicts of interest.
tal integration, but as a prerequisite for intellectual manifestation.3
Given the multifactorial nature of attention, it can be characterized into three basic forms.4 he irst of
the-se, sustained attention, represents a state of readiness to detect and respond to a particular stimuli for a period of time. It refers to our ability to maintain a stable res-ponse during a repetitive activity. Attention set-shifting is the ability to modify the focus of the attention from one task to another while maintaining luid behavior, that is, without interrupting the activity. In addition, selective attention refers to the ability to train attention continuously on one stimuli while inhibiting another, therefore, to direct attention to one event over another, where this constitutes an adaptive capacity.5
Tests assessing attention are essential in a neurop-sychological assessment.6 Such instruments include the
Trail Making Test (TMT) and the Stroop Test (ST), both widely quoted in international and national studies7-11 and
considered highly sensitive tasks to lesions in the subcor-tical region and to frontal lobe lesions and their connec-tions.6,12 hese tests are therefore measures of executive
function and shifting, sustained and selective attention.6,12
he TMT irst appeared in 193813 and was known
as Partington’s Pathways. Originally it was divided into two parts, the irst, called Part A (TMTA), was used to assess sustained attention and the second, called Part B (TMTB), evaluated attention set-shifting. Currently, other neuropsychological assessment batteries incorpo-rate similar tasks to those proposed by Partington and Leiter,14,15 but these instruments are without adaptation
or validation for use in Brazil. here is however, national publication of similar tasks in the form of a modiied version of the Color Trails Test.16
he ST was originally developed by John Ridley Stroop in 193517 to assess selective attention and
men-tal lexibility.6,12 Like the TMT, several versions of the
ST became available, the most useful of which is the Victoria version.18 It was from the Victoria version that
Duncan (2006)8 published a Brazilian adapted version
for use in children from 12 to 14 years of age from public and private schools.
To our knowledge, no investigations on the TMT and ST for native adult and elderly Portuguese (Brazilian) speakers have been published to date. herefore, the aims of the current study were to investigate the efects of age, education and gender on TMT and ST scores in a sample of Brazilian adults.
METHODS
Participants. he study included 1447 healthy subjects
recruited from the community, associations, schools for adult education, seniors clubs, voluntary or work centers in the ive regions of the country, including urban and rural areas, aged 18 years or older, with educational level of 0-25 years who were native speakers of Portuguese (Brazilian).
Procedures. Subjects who agreed to participate in the study illed out the consent form approved by the re-search ethics committee of the Hospital das Clinicas of the University of São Paulo Medical School (CAPPESq 086/06). Participants were initially interviewed using a semi-structured questionnaire to collect medical and demographic information. he Mini-Mental State Exa-mination (MMSE)19 and the Hospital Anxiety and
De-pression Scale (HADS)20 were also administered.
Individuals were excluded if they had previous his-tory of neurological or psychiatric disorders; use of psychotropic drugs; motor, auditory or visual disorders; estimated intelligence quotient (IQ) of less than 80; lo-wer-than-expected scores for education on the MMSE19
(20 for illiterates; 25 for 1 to 4 years; 26.5 for 5 to 8 years; 28 for 9 to 11 years, and 29 for higher levels) and score of less than 9 for anxiety and depression as indica-ted by the HADS.20 Consequently, 422 individuals were
excluded. Eight for anxiety symptoms, 267 for MMSE scores, 107 for IQ and 40 for inconsistent data.
Instruments. he neuropsychological evaluation included the Matrix Reasoning (MR) and Vocabulary from the Wechsler Adult Intelligence Scale-III (WAIS-III)21 to
ob-tain the estimated IQ,22 the Trail Making Test parts A
and B (TMTA and TMTB)6,13 and the Stroop Test (ST),
adapted Victoria version.6,8
he TMT is a task divided into two parts: Part A (TMTA), that requires the connection in ascending or-der of 25 numbers within circles arranged randomly on an A4 sheet; Part B (TMTB), that requires the connec-tion between 12 letters and 13 numbers in alphabetical and ascending order alternately. Both TMTA and TMTB are preceded by training. he score criterion adopted for the test was the time taken to complete each of the two tasks, but participants who required more than 300 se-conds to complete the TMT A or B were not included in the study and classiied as having inconsistent data. Er-rors were corrected promptly by the examiner without stopping the chronometer.6,13
similarly to Card A, but with rectangles replaced by unre-lated words to concepts of color (each, never, today and all) printed in uppercase in the 4 colors mentioned. Card C, was also organized similarly to Card A, representing the interference card where the written stimuli were the names of the colors (brown, blue, pink and green), prin-ted in the same colors in such a way that the ink color printed and color name never matched (e.g. brown word printed in pink, green or blue). For the irst card, partici-pants have to state the colors of the rectangles as quickly as possible. For cards B and C, subjects must state the co-lor of the printed words and not actually read the words themselves. he criterion score was the time taken to perform the task of each card6,8 and all errors were
cor-rected promptly without stopping the chronometer.
Statistical analysis. All analyses were conducted using the statistical software package SPSS V20 for Windows V8.1.
Continuous and semi-continuous data were analysed ini-tially using the KS-distance test for the evaluation of nor-mality. Consequently, parametric tests were employed. For comparisons of means between genders, Student’s t-test was used whereas comparison among age and edu-cation groups was performed using ANOVA or Chi-squa-re among fChi-squa-requency comparisons. Pearson’s corChi-squa-relation was conducted among attention tests, age and education. Multiple linear regression models were adopted to deter-mine which of these variables had a signiicant inluence on attention tests. Only variables proving signiicant on the multiple linear regression models were considered for the normative table. he descriptive information was ex-pressed as mean, standard deviation, absolute and relative frequency. A value of p≤0.05 was considered for all results.
RESULTS
he study included 1025 subjects. Gender, age and
edu-Table 1. Mean, standard deviation, absolute and relative frequency of sociodemographic data and IQ for all participants and for gender, age and education groups.
Male (%) Female (%) Age M (SD) Education M (SD) IQ M (SD) All N=335 33 N=690 67 N=1025 41.0 (16.4) N=1025 11.9 (5.6) N=1025 103.2 (12.0)
Gender Female – – N=690
42.6 (17.0)
N=690 11.85 (5.6)
N=690 102.97 (11.6)
Male – – N=335
37.9 (15.0)
N=335 12.04 (5.7)
N=335 103.85 (12.2)
p <0.001* 0.610 0.880
Age (years) 18-29 N=119
37.1 N=202 62.9 N=321 24.26 (3.4) N=321 12.62 (5.3) N=321 103.80 (12.1) 30-39 N=96 39.7 N=146 60.3 N=248 33.88 (3.1) N=248 13.19 (5.6) N=248 102.02 (11.6)
40-49 N=49
29.9 N=115 70.1 N=168 44.79 (2.8) N=168 12.32 (5.6) N=168 105.58 (12.5) 50-59 N=37 31.4 N=81 68.6 N=118 54.18 (2.8) N=118 12.25 (5.3) N=118 104.59 (11.2) 60-69 N=18 16.7 N=90 83.3 N=108 64.19 (2.7) N=108 9.19 (5.0) N=108 102.47 (12.1)
>70 N=16
22.2 N=56 77.8 N=72 75.44 (4.4) N=72 6.67 (4.6) N=72 97.43 (10.2)
p <0.001* <0.001* <0.001* <0.001* <0.001*
Education (years) 0-4 N=46
30.3 N=106 69.7 N=152 40.06 (20.7) N=152 3.47 (0.8) N=152 91.5 (8.8) 5-8 N=64 5.8 N=115 64.2 N=179 43.66 (17.54) N=179 6.84 (1.3) N=179 97.08 (10.8) 9-12 N=70 29.2 N=170 70.8 N=250 41.16 (15.9) N=250 10.76 (0.8) N=250 103.20 (11.2) >13 N=155 34.1 N=299 65.9 N=454 37.24 (13.2) N=454 17.33 (2.6) N=454 109.47 (9.3)
p <0.001* <0.001* <0.001* <0.001* <0.001*
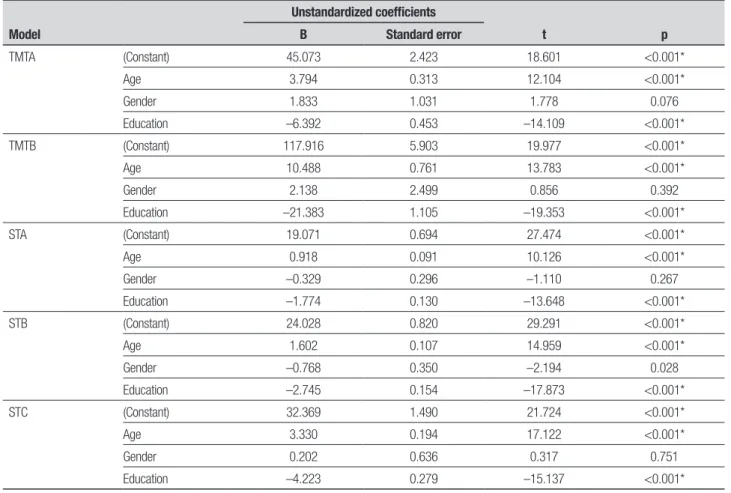
Table 2. Regression Model controlling for age, gender and education on attention tests.
Model
Unstandardized coefficients
t p B Standard error
TMTA (Constant) 45.073 2.423 18.601 <0.001*
Age 3.794 0.313 12.104 <0.001*
Gender 1.833 1.031 1.778 0.076
Education –6.392 0.453 –14.109 <0.001*
TMTB (Constant) 117.916 5.903 19.977 <0.001*
Age 10.488 0.761 13.783 <0.001*
Gender 2.138 2.499 0.856 0.392
Education –21.383 1.105 –19.353 <0.001*
STA (Constant) 19.071 0.694 27.474 <0.001*
Age 0.918 0.091 10.126 <0.001*
Gender –0.329 0.296 –1.110 0.267
Education –1.774 0.130 –13.648 <0.001*
STB (Constant) 24.028 0.820 29.291 <0.001*
Age 1.602 0.107 14.959 <0.001*
Gender –0.768 0.350 –2.194 0.028
Education –2.745 0.154 –17.873 <0.001*
STC (Constant) 32.369 1.490 21.724 <0.001*
Age 3.330 0.194 17.122 <0.001*
Gender 0.202 0.636 0.317 0.751
Education –4.223 0.279 –15.137 <0.001*
*Statistical Significance (p≤0.05). p: value of Statistical Significance; TMTA: Trail Making Test Part A; TMTB: Trail Making Test Part B; STA: Stroop Test Card A; STB: Stroop Test Card B; STC: Stroop Test Card C.
cation data are showed in Table 1. he intellectual ei-ciency ranged from 81 to 140 (Table 1). On the mood assessment, subjects scored a mean (SD) of 4.66 (2.1) points for anxiety and 3.37 (2.2) for depression, conir-ming an absence of these symptoms.20 On the MMSE
screening instrument, subjects scored a mean of 28.83 (1.3) points, all suggestive of preserved cognition.
As regards to attention tests, signiicant diferences between genders were observed on the TMTA [female 40.52 (18.6) and male 36.61 (18.2); p=0.002], TMTB [female 87.99 (50.3) and male 80.14 (45.4); p=0.017] and STC [female 29.64(12.7) and male 27.79 (11.4); p=0.024], but not for the STA [female 15.75 (5.1) and male 15.60 (5.1), p=0.660] and STB [female 18.87 (6.7) and male 18.82 (7.1), p=0.912]. he data showed poorer outcomes among women.
Age showed a positive correlation with attention tests [TMTA r=0.432 and p<0.001; TMTB r=0.473 p<0.001; STA r=0.337, p<0.001; STB r=0.485, p<0.001 and STC r=0.529, p<0.001], whereas education showed a negative correlation [TMTA r= –0.479 and p<0.001; TMTB r= –0.544 p<0.001; STA r= –0.436, p<0.001; STB
r= –0.526, p<0.001 and STC r= –0.476, p<0.001]. hus, considering the inluence of these variables on tests of attention, multivariate analysis models were created to investigate which variables were most relevant.
Gender was not found to be signiicant on the mo-del, but age and education maintained their interferen-ce. Older participants needed more time to complete tasks while education showed neuroprotective efects (Table 2).
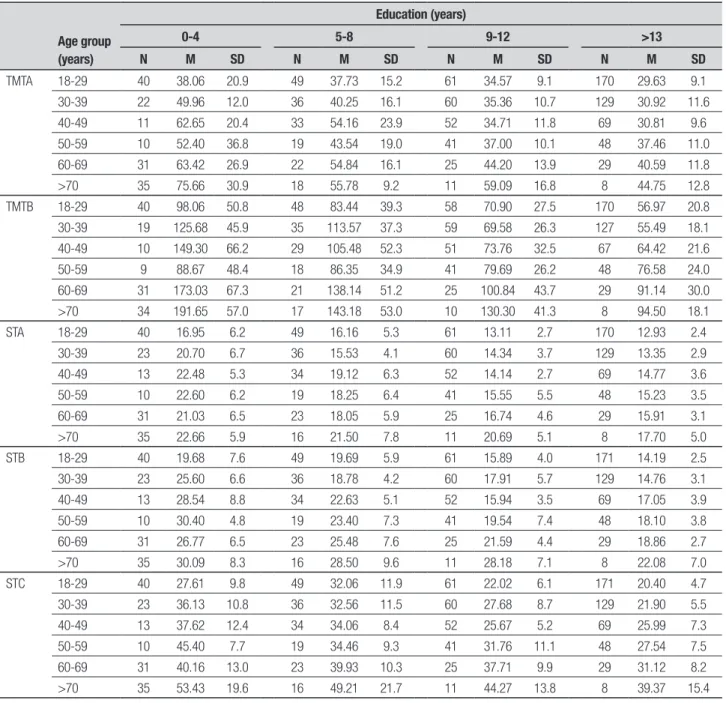
Given that both age and education proved signii-cant on the model, these variables were considered in the normative table. Table 3 shows the means and stan-dard deviations of the total scores (in seconds) for the TMTA, TMTB, STA, STB and STC applied to subjects.
DISCUSSION
he aims of the current study were to investigate the efects of age, education and gender on TMT and ST scores in a sample of Brazilian adults. he analysis of so-ciodemographic variables showed the efect of age and educational level of the individuals on normative data.
pre-Table 3. Means and Standard Deviation for TMT and ST scores (seconds) according to age and years of education.
Age group (years)
Education (years)
0-4 5-8 9-12 >13 N M SD N M SD N M SD N M SD
TMTA 18-29 40 38.06 20.9 49 37.73 15.2 61 34.57 9.1 170 29.63 9.1
30-39 22 49.96 12.0 36 40.25 16.1 60 35.36 10.7 129 30.92 11.6
40-49 11 62.65 20.4 33 54.16 23.9 52 34.71 11.8 69 30.81 9.6
50-59 10 52.40 36.8 19 43.54 19.0 41 37.00 10.1 48 37.46 11.0
60-69 31 63.42 26.9 22 54.84 16.1 25 44.20 13.9 29 40.59 11.8
>70 35 75.66 30.9 18 55.78 9.2 11 59.09 16.8 8 44.75 12.8
TMTB 18-29 40 98.06 50.8 48 83.44 39.3 58 70.90 27.5 170 56.97 20.8
30-39 19 125.68 45.9 35 113.57 37.3 59 69.58 26.3 127 55.49 18.1
40-49 10 149.30 66.2 29 105.48 52.3 51 73.76 32.5 67 64.42 21.6
50-59 9 88.67 48.4 18 86.35 34.9 41 79.69 26.2 48 76.58 24.0
60-69 31 173.03 67.3 21 138.14 51.2 25 100.84 43.7 29 91.14 30.0
>70 34 191.65 57.0 17 143.18 53.0 10 130.30 41.3 8 94.50 18.1
STA 18-29 40 16.95 6.2 49 16.16 5.3 61 13.11 2.7 170 12.93 2.4
30-39 23 20.70 6.7 36 15.53 4.1 60 14.34 3.7 129 13.35 2.9
40-49 13 22.48 5.3 34 19.12 6.3 52 14.14 2.7 69 14.77 3.6
50-59 10 22.60 6.2 19 18.25 6.4 41 15.55 5.5 48 15.23 3.5
60-69 31 21.03 6.5 23 18.05 5.9 25 16.74 4.6 29 15.91 3.1
>70 35 22.66 5.9 16 21.50 7.8 11 20.69 5.1 8 17.70 5.0
STB 18-29 40 19.68 7.6 49 19.69 5.9 61 15.89 4.0 171 14.19 2.5
30-39 23 25.60 6.6 36 18.78 4.2 60 17.91 5.7 129 14.76 3.1
40-49 13 28.54 8.8 34 22.63 5.1 52 15.94 3.5 69 17.05 3.9
50-59 10 30.40 4.8 19 23.40 7.3 41 19.54 7.4 48 18.10 3.8
60-69 31 26.77 6.5 23 25.48 7.6 25 21.59 4.4 29 18.86 2.7
>70 35 30.09 8.3 16 28.50 9.6 11 28.18 7.1 8 22.08 7.0
STC 18-29 40 27.61 9.8 49 32.06 11.9 61 22.02 6.1 171 20.40 4.7
30-39 23 36.13 10.8 36 32.56 11.5 60 27.68 8.7 129 21.90 5.5
40-49 13 37.62 12.4 34 34.06 8.4 52 25.67 5.2 69 25.99 7.3
50-59 10 45.40 7.7 19 34.46 9.3 41 31.76 11.1 48 27.54 7.5
60-69 31 40.16 13.0 23 39.93 10.3 25 37.71 9.9 29 31.12 8.2
>70 35 53.43 19.6 16 49.21 21.7 11 44.27 13.8 8 39.37 15.4
TMTA: Traill Making Test Part A; TMTB: Traill Making Test Part B; STA: Stroop Test Card A; STB: Stroop Test Card B; STC: Stroop Test Card C.
sented better outcomes than women on the attention tests but were signiicantly younger than the women. In the literature, there is no consensus regarding inluence of gender on attention, where some studies had similar results to the present study,23,24 while others showed the
opposite25,26 or demonstrated little inluence of gender
on performance.27-29
For both instruments, older age was associated with longer execution time, a inding consistent with earlier studies showing lower processing speed is correlated with older age.30,32 Similar indings were reported in
Korean23,31 Greek,25 French,28 Dutch26,33 American,30 and
Portuguese34 populations.
Regarding education, our study demonstrated that lower educational level was linked to longer execution time for the tasks, corroborating the results of other studies.23,24,31,35,36
with aging, education continues to exert an important neuroprotective efect. hese results are supported by theories of cognitive reserve in previous studies con-irming that subjects with greater education sufer less impact in terms of cognitive decline.37,38
Hence, based on our indings, we can conclude that gender did not exert a major inluence on the proposed attention tasks, while age and education showed sig-niicant correlations with performance. hese indings
demonstrate the importance of carrying out normati-ve studies that are both culture and language-speciic, using large samples of individuals of diferent ages and educational levels. he current results suggest that the use of the TMT and ST might be more appropriate for clinical application in populations with higher levels of education. Nevertheless, future studies should con-irm the clinical validity of these measures in patient populations.
REFERENCES
1. Halligan PW, Kischka U, Marshall JC. Handbook of Clinical Neuropsy-chology. New York: Oxford University Press; 2004.
2. Gazzaniga MS, Ivry RB, Mangun GR. Neurociência cognitiva: a biologia da mente. Porto Alegre: Artmed; 2006.
3. Mesulam MM. Principles of Behavioral and Cognitive Neurology. New York: Oxford University Press; 2000.
4. Lima RF. Compreendendo os mecanismos atencionais. Ciências e Cognição 2005;6:113-121.
5. Nabas TR, Xavier GF. Neurobiologia da atenção visual. In: Andrade VM, Santos FH, Bueno OFA, editors. Neuropsicologia Hoje. São Paulo: Artes Médicas; 2004:101-124.
6. Strauss E, Sherman EMS, Spreen O. A compendium of neuropsycho-logical tests. Administration, norms and commentary.3th ed. New York: Oxford University Press; 2006.
7. Miotto EC, Campanholo KR, Machado MAR, et al. Cognitive perfor-mance and mood in patients on the waiting list for liver transplantation and their relation to the model for end-stage liver disease. Arq Neurop-siquiatr 2010;68:62-66.
8. Duncan MT. Obtenção de dados normativos para desempenho no teste de stroop num grupo de estudantes do ensino fundamental em Niterói. J Bras Psiquiatr 2006;55:42-48.
9. Charchat-Fichman H, Oliveira RM. Performance of 119 Brazilian chil-dren on StrooP Paradigm – Victoria Version. Arq Neuropsiquiatr 2009; 67:445-449.
10. Pinho M, Cerqueira R, Peixoto B. Psychometric hepatic encephalopa-thy score normalization data for the Portuguese population. Acta Med Port 2011;24(Suppl 2):319-326.
11. Ihle-Hansen H, Thommessen B, Fagerland MW, et al. Impact of White Matter Lesions on Cognition in Stroke Patients Free from Pre-Stroke Cognitive Impairment: A One-Year Follow-Up Study. Dement Geriatr Cog Desord 2012;2:38-47.
12. Lezak MD, Howieson DB, Bigler ED, Trane, D. Neuropsychological As-sessment . New York: Oxford University Press; 2004.
13. Partington JE, Leiter RG. Partington’s Pathway Test. Psychological Ser-vice Center Bulletin 1949;168:111-117.
14. Delis DC, Kaplan E, Kramer JH. D-KEFS Delis-Kaplan Executive Func-tion System. San Antonio: Pearson; 2011.
15. Reynolds CR. Comprehensive Trail-Making Tes. Austin: PRO-ED; 2002.
16. Rabelo IS, Pacanaro SV, Rosseti MO, Leme IFAS. Teste de Trilhas Colo-ridas. São Paulo: Casa do Psicólogo; 2010.
17. JR Stroop. Studies of interference in serial verbal reactions. J Exp Psy-chol 1935;18:643-662.
18. Regard M. Cognitive rigidity and flexibility: a neuropsychological study. [dissertation] Victoria: University of Victoria; 1981.
19. Brucki SMD, Nitrini R, Caramelli P, Bertolucci PHF, Okamoto IH. Sug-estões para uso do mini-exame do estado mental no Brasil. Arq Neu-ropsiquiatr 2003:61:777-781.
20. Zigmond AS, Snaith RP. The Hospital Anxiety and Depression Scale. Acta Psychiatr Scand 1983;67:361-370.
21. Nascimento E. Escala de Inteligência Wechsler para Adultos: Manual David Weschsler; Adaptação e padronização de uma amostra brasilei-ra. 1a. ed. São Paulo: Casa do Psicólogo; 2004.
22. Ringe WK, Saine KC, Lacritz LH, Hynan LS, Cullum CM. Dyadic short forms of the Wechesler adult intelligence scale-III. Assessment. 2002;9: 254-260.
23. Seo EH, Lee DY, Kim KW, et al. A normative study of the Trail Making Test in Korean elders. Int J Geriatr Psychiatry 2006;21:844-852. 24. Pavão Martins I, Maruta C, Freitas V, Mares I. Executive Performance in
Older Portuguese Adults with Low Education. Clin Neuropsychologist 2013;27:410-425.
25. Messinis L, Malegiannaki AC, Christodoulou T, Panagiotopoulos V, Pa-pathanasopoulos P. Color Trails Test: Normative data and criterion va-lidity for the Greek adult population. Arch Clin Neurospychol 2011;26: 322-330.
26. Elst WV, Van Boxtel MPJ, Van Breukelen GJP, Jolles J. The Concept Shifting Test: Adult Normative Data. Psychol Assess 2006;18:424-432. 27. Drane DL, Yuspeh RL, Huthwaite JS, Klingler, LK. Demografic char-acteristics and normative observations for derived-Trail Making Test Indices. Neuropsychiatry Neuropsychol Behav Neurol 2001;15:39-43. 28. Bayard S, Erkes J, Moroni C. Victoria Stroop Test: Normative Data in a
Sample Group of Older People and the Study of Their Clinical Applica-tions in the Assessment of Inhibition in Alzheimer’s Disease. Arch Clin Neuropsychol 2011;26:653-661.
29. Rognoni T, Casals-Coll M, Sanchez-Benavides G, et al. Estudios Normativos españoles em poblacíon adulta joven (Proyecto NEU-RONORMA Jóvenes): normas para las pruebas Stroop Color – Word Interference Test y Tower of London – Drexel University, Neurología, 2013;28:73-80.
30. Norman MA, Moore DJ, Taylor M, et al. Demographically Corrected Norms for African Americans and Caucasians on the Hopkins Verbal Learning Test-Revised, Brief Visuospatial Memory Test-Revised, Stroop Color and Word Test, and Wisconsin Card Sorting Test 64-Card Ver-sion. J Clin Exp Neuropsychol 2011;33:793-804.
31. Seo EH, Lee DY, Choo IH, et al. Normative study of the Stroop Color and Word Test in an educationally diverse elderly population. Int J Geriatr Psychiatry 2008;23:1020-1027.
32. Albinet CT, Boucard G, Bouquet CA, Audiffren M. Processing speed and executive functions in cognitive aging: How to disentangle their mu-tual relationship? Brain Cogn 2012;79:1-11.
33. Elst WV, Boxtel MPJV, Breukelen GJPV, Jolles J. The Stroop Color-Word Test Influence of Age, Sex, and Education; and Normative Data for a Large Sample Across the Adult Age Range. Assessment 2006;13:62-79. 34. Cavaco S, Pinto C, Almeida E, et. al. Trail Making Test: Regression
Based Norms for the Portuguese population. Arch Clin Neuropsychol 2013;28:189-198.
35. Troyer AK, Leach L, Strauss E. Aging and response inibition norma-tive data for the victoria stroop test. Aging Neuropshychol Cogn 2006; 13:20-35.
36. Tamayo F, Casals-Col M, Sánchez-Beavides G, et. al., Estudios Norma-tivos españoles em población adulta joven (Proyecto NEURONORMA Jóvenes): normas para las pruebas span verbal, span visuoespacial, Letter-number sequencing, Trail Making Test y Symbol Digit Modalities Test. Neurología 2012;27:319-329.
37. Zahodne LB, Glymour MM, Sparks C, et. al. Education Does Not Slow Cognitive Decline with Aging: 12-Year Evidence from the Victoria Longi-tudinal Study. J Int Neuropsychol Soc 2011;17:1039-1046.