AR
TICLE
1 Curso de graduação em Medicina, UniEvangélica Centro de Ensino. Av. Universitária KM 3,5, Cidade Universitária. 75083-515 Anápolis GO Brasil. [email protected] 2 Departamento de Saúde Coletiva, Instituto de Patologia Tropical e Saúde Pública, Universidade Federal de Goiás.
Trends in premature mortality due to chronic non-communicable
diseases in Brazilian federal units
Abstract Chronic non-communicable diseases (NCDs) have a high mortality rate, mainly in lower and middle income countries. The major groups are cardiovascular disease (CVD), chron-ic respiratory disease (CRD), cancer and diabe-tes. The Action Plan to reduce NCDs in Brazil, 2011-2022 established a 2% yearly reduction in the NCD premature mortality rate as a goal. The aim of the study was to analyze trends in prema-ture mortality rates and also show goal achieve-ment scenarios for each Federal Unit (FU). A time series analysis of the standardized mortality rate between2000-2011 was performed using the linear regression model. The average annual rate of increase and the 95% confidence interval were estimated. Each FU was classified as being likely or unlikely to achieve the goal. The FUs likely to achieve the goal were: for CVD – Federal District, Santa Catarina, Mato Grosso, Rio Grande do Sul, Minas Gerais, Bahia, Espírito Santo and Paraná states; for CRD – Amazonas, Federal District and Paraná. For neoplasms and diabetes, none of the FUs are likely to achieve the goal. The articula-tion of the three levels of government will allow the strengthening of interventions to reduce the determinants of NCDs and to improve access and quality in health care.
Key words Chronic disease, Epidemiology,
Pre-mature mortality
Carla Guimarães Alves 1
A
lv
es CG,
M
o
rais N
Introduction
In the context of epidemiological, demographic, and nutritional transitions, as well as the glo-balization of consumption and eating patterns and living habits, chronic non-communicable diseases (CNCDs) are a major health problem worldwide, especially in middle-and low-in-come countries. The World Health Organization (WHO) estimates that of the 36 million deaths in 2008, 63% were caused by this group of diseases1.
The low- and middle-income countries account for approximately 80% of deaths worldwide and affect men and women equally2.
In Brazil, CNCDs accounted for 72% of deaths in 2007, particularly those caused by dis-eases of the circulatory system (DCS) (31.3%), cancer (16.3%), and diabetes mellitus (5.2%)3. In
2004, CNCDs accounted for 62.8% of all deaths due to known causes in Brazil, and the propor-tion of deaths due to these diseases increased by
more than three-fold between 1930 and 20064.
The increase of CNCDs affects mostly people with lower income and education levels, whether due to exposure to risk factors or less access to health information and services, which ultimate-ly further accentuate social inequalities5.
The impact of the high burden of chronic diseases is expressed in the high rate of years of life lost, in the large volume of work-related dis-abilities and inability to perform activities of dai-ly living, and also in the large economic impact in the lives of affected people and their families, even leading to impoverishment and social im-pairment2.
Individuals who suffer from chronic diseas-es end up removed from the workforce, which results in losses to the Brazilian production sec-tor. Estimates for Brazil suggest that from 2006 to 2015, these losses may reach USD 4.18 billion. Losses related to disability, direct materials costs to patients and families, and impoverishment of families without disregarding the financial im-pacts on the health system also stand out5.
Given the magnitude of the problem world-wide, in September 2011, the United Nations (UN) held a high-level meeting to establish com-mitments of heads of state for combating CNCDs, with actions to prevent its main risk factors and guarantee adequate care of patients with these dis-eases6. At the World Health Assembly in 2013,the
WHO approved a global action plan for the pre-vention and control of CNCDs with a focus on the control of DCS, neoplasms, chronic respirato-ry diseases (CRDs),and diabetes mellitus, as well
as the prevention of the following modifiable risk factors: smoking, unhealthy diet, physical inactiv-ity, and harmful use of alcohol7. The Global Plan
outlined nine goals that national plans should ad-dress; it also established a general goal for a rela-tive reduction of 25% in the premature mortality rate (30 - 69 years of age) from CNCDs, which the countries should reach by 20257.
In 2011, the Brazilian government, under the coordination of the Ministry of Health, built the Plan to Combat Chronic Non-communicable Diseases (Plano de Enfrentamento das Doenças Crônicas Não Transmissíveis) 2011-2022, which defined targets for the control of CNCDs and the prevention of major risk factors. The Plan is focused on the four main groups of chronic diseases (DCS, neoplasms, CRDs, and diabetes mellitus) and their most common risk factors (smoking, alcohol, physical inactivity, unhealthy diet, and obesity), and its main goal is to reduce premature mortality rates (30 - 69 years old) by 2% per year until 20228,9.
The aim of the present study is to analyze the trend of premature mortality from CNCDs and the four main groups of causes from 2000 to 2011 in the Federal Units (FUs) and to identify scenarios that comply with the premature mor-tality reduction goal established by the Plan to Combat CNCDs.
Methods
The present study is an analytical time-series study of mortality rates from CNCDs. The ref-erence population used in the study was the adult population from 30 to 69 years of age who lived in FUs of Brazil, including 26 states and the Federal District. The study population was com-posed of individuals living in the 27 FUs, aged from 30 to 69 years, who died of an underlying cause coded in the following chapters or groups of causes in the International Classification of Diseases and Related Health Problems - Tenth
Revision (ICD-10)10 (neoplasms (Chapter II -
ICD-10: C00 - D48); DCS (Chapter IX - ICD-10: I00 - I99); chronic pulmonary disease (ICD-10: J40- J44); and subgroup of causes diabetes mel-litus (ICD-10 E10-E14)) and were registered in the Mortality Information System of the Unified Health System (Sistema de Informações sobre Mortalidade do Sistema Único de Saúde – SIM/ SUS) from 2000 to 2011.
e C
ole
tiv
a,
20(3):641-654,
2015
Search of Deaths and Births in the Northeast and Amazon regions were used; these factors were available on the Datasus (Information Technol-ogy Department of the Unified Health System) website for the Chapters of ICD-1011. To
reallo-cate deaths with ill-defined underlying cause, the deaths were reallocated proportionally to groups of ill-defined causes, excluding Chapter XX - Ex-ternal causes.
The populations of residents in the FUs used in the study were from the Censuses of 2000 and
201012; the populations for years 2001 through
2009 and for 2011 were estimated using the in-terpolation method and the projection of the Ministry of Health, respectively, available on the Datasus website13.
The mortality measures were the specific mortality rates by age range and the mortality rate by a group of causes standardized by age us-ing the direct method. The standard population used was the estimated population of Brazil in 2011.
For the time-series analysis, the Prais-Win-sten autoregressive linear regression method was used14. This technique displays advantages over
simple linear regression because it controls the serial autocorrelation phenomenon between the values of the rates in the years of the time series. To control for existing noise due to random vari-ation, the rates used were smoothed using the moving average of order 3 of the annual rates, and a logarithmic transformation was applied (log base 10) to the moving average of the rates. The Stata Version 11 software was used15. Using
the regression model, the regression coefficient (beta), its respective 95% confidence interval (95% CI), and the standard error of beta were calculated. With these parameters, the mean an-nual growth rates of the mortality rates were cal-culated using the formula described by Antunes and Waldman14.
To interpret the time-series trend, a station-ary trend was considered when the zero value was within the lower and upper limits of the 95% CI of the mean annual growth rate; an increas-ing trend was considered when both limits of the 95% CI were positive, and a decreasing trend was considered when both limits of the 95% CI were negative.
To analyze the compliance scenarios of the goals from the Strategic Action Plan to Combat CNCDs in Brazil, 2011-2022, the FUs were real-located according to gender into two strata (fa-vorable and unfa(fa-vorable). The first stratum rep-resents the FUs that displayed a trend toward the
reduction of mortality from CNCDs during the time series and whose upper limit of the 95% CI of the mean annual growth rate was lower than or equal to -2%; the second stratum comprised the FUs that demonstrated increasing, decreasing, or stationary mean annual growth rates (values of the upper limit of the 95% CI greater than -2%).
The present study has no ethical implica-tions because it uses secondary and grouped data available on the official website of the Ministry of Health, which does not contain information that allows individuals to be identified13.
Results
In 2000, the number of deaths in the four groups was 292,665;in 2011,this number reached 322,040 deaths, representing 65.3% and 63.7% of the total deaths from all causes in both years, re-spectively. Considering the mortality per groups of causes from 2000 to 2011 in individuals aged from 30 to 69 years in Brazil, we obtained the following results: (i) neoplasms were the un-derlying cause of death in 1,186,121 deaths, of which 631,274 (53.22%) were males and 554,847 (46.78%) were females; (ii) diabetes mellitus was the cause of 236,311 deaths, of which 116,634 (49.35%) were males and 119,677 (50.65%) were females; (iii) DCS were the underlying cause of 1,787,322 deaths, of which1,086,921 (60.81%) were males and 700,401 (39.19%) were females; and (iv) CRDs were the underlying cause of 453,472 deaths, of which 280,941 (61.95%) were males and 172,531 (38.05%) were females.
Tables 1 and 2 show the results of the time-se-ries analysis for the groups of causes and per gen-der in the FUs.
For DCS in males, all FUs revealed a decreasing trend, except for Acre and Paraíba, which showed a stationary trend. The greatest decreasing mean annual growth rates were observed in the Feder-al District (-3.63%), Minas Gerais (-3.54%), and Rio Grande do Sul and Paraná (-2.91%); the low estrates were those found in the states of Paraí-ba (-0.75%), Tocantins (-1.32%), and Alagoas (-1.45%) (Table 1). In females, a stationary trend was observed in the states of Acre and Roraima and a decreasing trend was observed in the re-maining states, notably Amapá (-3.97%), Paraná (-3.55%),and Minas Gerais (-3.45%), which demonstrated the highest percentages of mean annual decrease (Table 2).
A lv es CG, M o rais N
the FUs Paraíba (2.02%), Tocantins (1.61%), Piauí (1.44%), Bahia (0.70%), Rio Grande do Norte (0.61%),and Minas Gerais (0.59%); a de-creasing trend was observed for Amapá (-2.88%), the Federal District (-2.14%), Rio de Janeiro (-1.63%), Amazonas (-1.48%), Pará (-1.13%), Ceará (-1%), Santa Catarina (-0.92%), São Pau-lo (-0.89%), Rio Grande do Sul (-0.54%), and Rondônia (-0.33%); the remaining FUs demon-strated a stationary trend (Table 1).For females, the FUs with an increasing trend were Paraíba (1.42%), Roraima (1.41%), Piauí (0.53%), and Acre and Bahia (0.38%); the FUs with a decreas-ing trend were Amapá (-1.96%), the Federal District (-1.87%), Rondônia (-1.10%), Espírito Santo (-1.01%), Ceará (-0.95%), Rio Grande do Norte (-0.84%), Rio de Janeiro (-0.71%), Maran-hão, Pernambuco (-0.45%), Mato Grosso do Sul
(-0.41%),and São Paulo (-0.36%); the remaining FUs demonstrated a stationary trend (Table 2).
For CRDs, the trend in males exhibited an in-crease in Pernambuco (2.05%), and there was a decreasing trend in the FUs of Roraima (-12.29%), Santa Catarina (-6.06%), Amapá (-5.77%), Rio Grande do Sul (-5.29%), Amazonas (-4.54%), Pará (-4.15%), Rio de Janeiro (-3.88%), Minas Gerais (-3.82%), the Federal District (-3.70%), Paraná (-3.69%), São Paulo (-3.24%), Mara-nhão (-3.03%), Ceará (-2.97%), Espírito San-to (-2.78%), Piauí (-2.58%), Paraíba (-2.11%), Goiás (-2.10%), Rondônia (-1.84%), Mato Gros-so do Sul (-1.71%),and Bahia (-1.49%); a sta-tionary trend was observed in the remaining FUs (Table 1).In females, the state of Sergipe (5.10%) exhibited an increasing trend. There was a de-creasing trend in the FUs of Amapá (-7.82%), the
FU Rondônia Acre Amazonas Roraima Pará Amapá Tocantins Maranhão Piauí Ceará
Rio Grande do Norte Paraíba Pernambuco Alagoas Sergipe Bahia Minas Gerais Espírito Santo Rio de Janeiro São Paulo Paraná Santa Catarina Rio Grande do Sul Mato Grosso do Sul Mato Grosso Goiás
Federal District Brazil
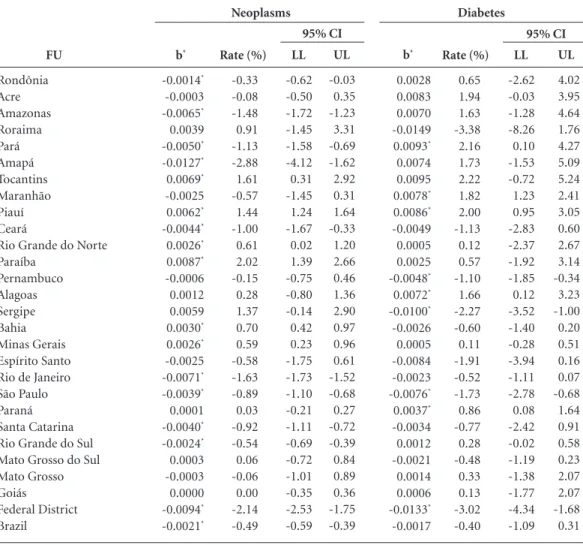
Table 1. Regression coefficient (b),mean annual growth rate of standardized mortality rates per groups of causes
(%), and corresponding 95% CI. Males. Brazil and FUs, 2000 to 2011.
b* -0.0014* -0.0003 -0.0065* 0.0039 -0.0050* -0.0127* 0.0069* -0.0025 0.0062* -0.0044* 0.0026* 0.0087* -0.0006 0.0012 0.0059 0.0030* 0.0026* -0.0025 -0.0071* -0.0039* 0.0001 -0.0040* -0.0024* 0.0003 -0.0003 0.0000 -0.0094* -0.0021* Rate (%) -0.33 -0.08 -1.48 0.91 -1.13 -2.88 1.61 -0.57 1.44 -1.00 0.61 2.02 -0.15 0.28 1.37 0.70 0.59 -0.58 -1.63 -0.89 0.03 -0.92 -0.54 0.06 -0.06 0.00 -2.14 -0.49 LL -0.62 -0.50 -1.72 -1.45 -1.58 -4.12 0.31 -1.45 1.24 -1.67 0.02 1.39 -0.75 -0.80 -0.14 0.42 0.23 -1.75 -1.73 -1.10 -0.21 -1.11 -0.69 -0.72 -1.01 -0.35 -2.53 -0.59 UL -0.03 0.35 -1.23 3.31 -0.69 -1.62 2.92 0.31 1.64 -0.33 1.20 2.66 0.46 1.36 2.90 0.97 0.96 0.61 -1.52 -0.68 0.27 -0.72 -0.39 0.84 0.89 0.36 -1.75 -0.39 b* 0.0028 0.0083 0.0070 -0.0149 0.0093* 0.0074 0.0095 0.0078* 0.0086* -0.0049 0.0005 0.0025 -0.0048* 0.0072* -0.0100* -0.0026 0.0005 -0.0084 -0.0023 -0.0076* 0.0037* -0.0034 0.0012 -0.0021 0.0014 0.0006 -0.0133* -0.0017 Rate (%) 0.65 1.94 1.63 -3.38 2.16 1.73 2.22 1.82 2.00 -1.13 0.12 0.57 -1.10 1.66 -2.27 -0.60 0.11 -1.91 -0.52 -1.73 0.86 -0.77 0.28 -0.48 0.33 0.13 -3.02 -0.40 LL -2.62 -0.03 -1.28 -8.26 0.10 -1.53 -0.72 1.23 0.95 -2.83 -2.37 -1.92 -1.85 0.12 -3.52 -1.40 -0.28 -3.94 -1.11 -2.78 0.08 -2.42 -0.02 -1.19 -1.38 -1.77 -4.34 -1.09 UL 4.02 3.95 4.64 1.76 4.27 5.09 5.24 2.41 3.05 0.60 2.67 3.14 -0.34 3.23 -1.00 0.20 0.51 0.16 0.07 -0.68 1.64 0.91 0.58 0.23 2.07 2.07 -1.68 0.31
95% CI 95% CI
Neoplasms Diabetes
e C ole tiv a, 20(3):641-654, 2015
Federal District (-4.67%), Amazonas (-4.28%), Paraná (-3.25%), Pará (-3.13%), Minas Gerais (-3.08%), Santa Catarina (-2.73%), Rio Grande do Sul (-2.68%), Piauí (-2.46%), Rondônia (-2.43%), Alagoas (-2.15%), Goiás (-1.96%), São Paulo (-1.46%), Rio de Janeiro (-1.11%), and Ba-hia (-1.03%); a stationary trend was observed in the remaining FUs (Table 2).
For diabetes mellitus, the trend analysis in males showed an increase in the states of Pará (2.16%), Piauí (2.00%), Maranhão (1.82%), Ala-goas (1.66%),and Paraná (0.86%); a decreasing trend in the Federal District (-3.02%), Sergipe (-2.27%), São Paulo (-1.73%),and Pernambuco (-1.10%); and a stationary trend in the remain-ing states (Table 1).For females, an increasremain-ing trend was observed in the state of Piauí (1.40%), whereas a decreasing trend was observed in São
Paulo (-3.70%), the Federal District (-3.61%), Sergipe (-2.63%), Santa Catarina (-2.44%), Mato Grosso do Sul (-2.43%), Bahia (-1.92%), Pernambuco (-1.69%), Rio de Janeiro (-1.55%), Espírito Santo (-1.51%), and Minas Gerais (-1.23%); a stationary trend was observed in the remaining FUs (Table 2).
The trend analysis for CNCDs (considering all four groups of causes) in males exhibited a mean annual decrease rate of -1.8% between 2000 and 2011 for Brazil as a whole. A stationary trend was observed for three FUs. The remaining FUs demonstrated a decreasing trend, and the highest mean annual decreasing rates were ob-served in the Federal District (-3.08%), Amapá (-2.52%), Santa Catarina (-2.14%), Rio de Ja-neiro (-2.04%), and Espírito Santo (-2.01%). For females, a mean annual decrease rate of
FU Rondônia Acre Amazonas Roraima Pará Amapá Tocantins Maranhão Piauí Ceará
Rio Grande do Norte Paraíba Pernambuco Alagoas Sergipe Bahia Minas Gerais Espírito Santo Rio de Janeiro São Paulo Paraná Santa Catarina Rio Grande do Sul Mato Grosso do Sul Mato Grosso Goiás
Federal District Brazil
Tabela 1. continuation
b* -0.0109* -0.0065 -0.0089* -0.0114* -0.0089* -0.0121* -0.0058* -0.0093* -0.0100* -0.0074* -0.0086* -0.0033 -0.0086* -0.0063* -0.0065* -0.0118* -0.0156* -0.0127* -0.0103* -0.0102* -0.0128* -0.0122* -0.0128* -0.0093* -0.0104* -0.0094* -0.0161* -0.0110* Rate (%) -2.49 -1.49 -2.02 -2.58 -2.02 -2.76 -1.32 -2.12 -2.28 -1.70 -1.97 -0.75 -1.97 -1.45 -1.48 -2.68 -3.54 -2.87 -2.35 -2.31 -2.91 -2.76 -2.91 -2.11 -2.37 -2.15 -3.63 -2.49 LL -2.99 -3.06 -2.39 -3.25 -2.74 -4.46 -1.71 -2.45 -2.76 -2.28 -2.18 -1.50 -2.04 -1.87 -1.77 -3.22 -3.69 -3.34 -2.66 -2.80 -3.03 -3.00 -3.68 -2.63 -2.66 -2.82 -4.80 -2.71 UL -1.99 0.11 -1.64 -1.91 -1.29 -1.03 -0.92 -1.79 -1.80 -1.11 -1.76 0.00 -1.90 -1.02 -1.18 -2.15 -3.39 -2.41 -2.05 -1.82 -2.80 -2.52 -2.14 -1.59 -2.07 -1.48 -2.45 -2.27 b* -0.0081* -0.0005 -0.0202* -0.0570* -0.0184* -0.0258* -0.0022 -0.0133* -0.0114* -0.0131* -0.0017 -0.0093* 0.0088* 0.0006 -0.0082 -0.0065* -0.0169* -0.0122* -0.0172* -0.0143* -0.0163* -0.0271* -0.0236* -0.0075* 0.0035 -0.0092* -0.0164* -0.0159* Rate (%) -1.84 -0.12 -4.54 -12.29 -4.15 -5.77 -0.50 -3.03 -2.58 -2.97 -0.40 -2.11 2.05 0.13 -1.88 -1.49 -3.82 -2.78 -3.88 -3.24 -3.69 -6.06 -5.29 -1.71 0.82 -2.10 -3.70 -3.59 LL -2.72 -4.23 -6.86 -15.68 -6.65 -10.12 -5.94 -5.18 -3.55 -4.54 -2.89 -2.58 0.78 -1.82 -3.84 -1.97 -4.80 -4.12 -4.31 -4.22 -4.00 -6.55 -6.42 -3.03 -1.90 -3.62 -4.63 0.00 UL -0.94 4.16 -2.16 -8.78 -1.58 -1.20 5.27 -0.82 -1.60 -1.37 2.15 -1.64 3.34 2.12 0.12 -1.00 -2.83 -1.42 -3.45 -2.25 -3.37 -5.56 -4.15 -0.36 3.61 -0.56 -2.75 -2.97
95% CI 95% CI
Diseases of the Circulatory System Chronic Respiratory Diseases
A lv es CG, M o rais N
-1.76% was also observed in the mortality rates from CNCDs in Brazil. Only two FUs exhibited a stationary trend (Acre and Roraima). The FUs with the greatest mean annual decreases were the Federal District (-3.10%), Amapá (-2.59%), Rondônia (-2.26%), Espírito Santo (-2.18%), and Rio Grande do Norte (-1.98%). These data are not shown in the figures.
The scenario analysis for compliance with the goal of reducing the premature mortality rate defined by the “Strategic Action Plan to Combat Chronic Non-communicable Diseases (CNCDs) in Brazil 2011 - 2022” can be viewed in Figures 1 and 2 and in Table 1.
For the group of DCS, the following FUs exhibited a favorable scenario for males: Ba-hia, Minas Gerais, Espírito Santo, Rio de Ja-neiro, Paraná, Santa Catarina, Rio Grande do
Sul, Mato Grosso, and the Federal District. For females, the FUs with a favorable scenario were Rondônia, Amazonas, Pará, Maranhão, Rio Grande do Norte, Pernambuco, Sergipe, Bahia, Minas Gerais, Espírito Santo, São Paulo, Paraná, Santa Catarina, Rio Grande do Sul, Mato Grosso, Goiás, and the Federal District.
For neoplasms, all FUs exhibited an unfavor-able scenario for both genders.
For CRDs, Amazonas, Roraima, Minas Gerais, Rio de Janeiro, São Paulo, Paraná, San-ta CaSan-tarina, Rio Grande do Sul, and the Federal District exhibited a favorable scenario for males. For females, the FUs with a favorable scenario were Amazonas, Minas Gerais, Paraná, and the Federal District.
For the group of diabetes mellitus, all FUs ex-hibited an unfavorable scenario for meeting the
FU Rondônia Acre Amazonas Roraima Pará Amapá Tocantins Maranhão Piauí Ceará
Rio Grande do Norte Paraíba Pernambuco Alagoas Sergipe Bahia Minas Gerais Espírito Santo Rio de Janeiro São Paulo Paraná Santa Catarina Rio Grande do Sul Mato Grosso do Sul Mato Grosso Goiás
Federal District Brazil
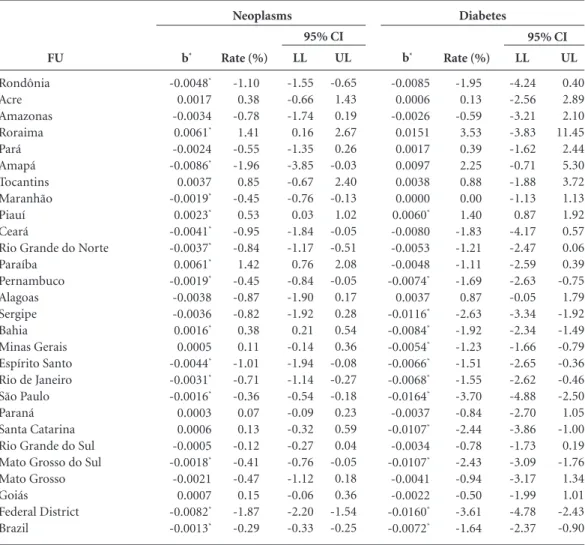
Table 2. Regression coefficient (b), mean annual growth rate of standardized mortality rates per groups of causes
(%), and corresponding 95% CI. Females. Brazil and FUs, 2000 to 2011.
b* -0.0048* 0.0017 -0.0034 0.0061* -0.0024 -0.0086* 0.0037 -0.0019* 0.0023* -0.0041* -0.0037* 0.0061* -0.0019* -0.0038 -0.0036 0.0016* 0.0005 -0.0044* -0.0031* -0.0016* 0.0003 0.0006 -0.0005 -0.0018* -0.0021 0.0007 -0.0082* -0.0013* Rate (%) -1.10 0.38 -0.78 1.41 -0.55 -1.96 0.85 -0.45 0.53 -0.95 -0.84 1.42 -0.45 -0.87 -0.82 0.38 0.11 -1.01 -0.71 -0.36 0.07 0.13 -0.12 -0.41 -0.47 0.15 -1.87 -0.29 LL -1.55 -0.66 -1.74 0.16 -1.35 -3.85 -0.67 -0.76 0.03 -1.84 -1.17 0.76 -0.84 -1.90 -1.92 0.21 -0.14 -1.94 -1.14 -0.54 -0.09 -0.32 -0.27 -0.76 -1.12 -0.06 -2.20 -0.33 UL -0.65 1.43 0.19 2.67 0.26 -0.03 2.40 -0.13 1.02 -0.05 -0.51 2.08 -0.05 0.17 0.28 0.54 0.36 -0.08 -0.27 -0.18 0.23 0.59 0.04 -0.05 0.18 0.36 -1.54 -0.25 b* -0.0085 0.0006 -0.0026 0.0151 0.0017 0.0097 0.0038 0.0000 0.0060* -0.0080 -0.0053 -0.0048 -0.0074* 0.0037 -0.0116* -0.0084* -0.0054* -0.0066* -0.0068* -0.0164* -0.0037 -0.0107* -0.0034 -0.0107* -0.0041 -0.0022 -0.0160* -0.0072* Rate (%) -1.95 0.13 -0.59 3.53 0.39 2.25 0.88 0.00 1.40 -1.83 -1.21 -1.11 -1.69 0.87 -2.63 -1.92 -1.23 -1.51 -1.55 -3.70 -0.84 -2.44 -0.78 -2.43 -0.94 -0.50 -3.61 -1.64 LL -4.24 -2.56 -3.21 -3.83 -1.62 -0.71 -1.88 -1.13 0.87 -4.17 -2.47 -2.59 -2.63 -0.05 -3.34 -2.34 -1.66 -2.65 -2.62 -4.88 -2.70 -3.86 -1.73 -3.09 -3.17 -1.99 -4.78 -2.37 UL 0.40 2.89 2.10 11.45 2.44 5.30 3.72 1.13 1.92 0.57 0.06 0.39 -0.75 1.79 -1.92 -1.49 -0.79 -0.36 -0.46 -2.50 1.05 -1.00 0.19 -1.76 1.34 1.01 -2.43 -0.90
95% CI 95% CI
Neoplasms Diabetes
e C ole tiv a, 20(3):641-654, 2015 FU Rondônia Acre Amazonas Roraima Pará Amapá Tocantins Maranhão Piauí Ceará
Rio Grande do Norte Paraíba Pernambuco Alagoas Sergipe Bahia Minas Gerais Espírito Santo Rio de Janeiro São Paulo Paraná Santa Catarina Rio Grande do Sul Mato Grosso do Sul Mato Grosso Goiás
Federal District Brazil
Tabela 2. continuation
b* -0.0135* -0.0007 -0.0121* -0.0002 -0.0122* -0.0176* -0.0128* -0.0117* -0.0107* -0.0104* -0.0146* -0.0101* -0.0119* -0.0093* -0.0127* -0.0141* -0.0152* -0.0142* -0.0102* -0.0117* -0.0157* -0.0147* -0.0131* -0.0109* -0.0147* -0.0125* -0.0185* -0.0129* Rate (%) -3.06 -0.16 -2.76 -0.05 -2.78 -3.97 -2.91 -2.65 -2.43 -2.37 -3.31 -2.31 -2.71 -2.11 -2.89 -3.20 -3.45 -3.22 -2.33 -2.66 -3.55 -3.32 -2.98 -2.48 -3.32 -2.83 -4.18 -2.93 LL -3.38 -2.70 -3.12 -3.57 -3.02 -6.04 -4.25 -2.99 -3.30 -3.25 -4.02 -2.90 -3.27 -2.69 -3.41 -3.45 -3.74 -4.09 -2.81 -3.16 -3.95 -3.81 -3.73 -3.29 -3.49 -3.25 -4.91 -3.05 UL -2.75 2.45 -2.40 3.59 -2.54 -1.85 -1.55 -2.31 -1.54 -1.47 -2.59 -1.71 -2.14 -1.53 -2.37 -2.94 -3.16 -2.34 -1.84 -2.17 -3.15 -2.83 -2.21 -1.66 -3.16 -2.41 -3.44 -2.82 b* -0.0107* -0.0045 -0.0190* 0.0000 -0.0138* -0.0354* 0.0026 -0.0031 -0.0108* -0.0035 -0.0021 -0.0078 -0.0027 -0.0094* 0.0216* -0.0045* -0.0136* -0.0067 -0.0049* -0.0064* -0.0144* -0.0120* -0.0118* -0.0050 -0.0007 -0.0086* -0.0208* -0.0097* Rate (%) -2.43 -1.03 -4.28 0.00 -3.13 -7.82 0.59 -0.72 -2.46 -0.81 -0.49 -1.79 -0.63 -2.15 5.10 -1.03 -3.08 -1.52 -1.11 -1.46 -3.25 -2.73 -2.68 -1.15 -0.15 -1.96 -4.67 -2.20 LL -4.24 -7.60 -5.21 -6.91 -4.67 -13.82 -4.05 -2.14 -3.16 -1.99 -2.87 -3.88 -1.37 -2.75 2.19 -1.79 -3.45 -3.63 -1.45 -2.48 -3.63 -3.99 -3.44 -2.69 -1.58 -2.75 -6.69 -2.82 UL -0.58 6.01 -3.35 7.42 -1.57 -1.40 5.45 0.72 -1.75 0.38 1.95 0.35 0.11 -1.54 8.08 -0.27 -2.70 0.64 -0.77 -0.42 -2.87 -1.44 -1.91 0.41 1.30 -1.17 -2.61 -1.57
95% CI 95% CI
Diseases of the Circulatory System Chronic Respiratory Diseases
* p-value < 0,05.
goal for males. For females, São Paulo and the Federal District exhibited a favorable scenario and the remaining FUs exhibited an unfavorable scenario.
For the combination of all four CNCD groups, a favorable scenario for meeting the goal was observed in the FUs of Amapá, Rio de Janei-ro, Minas Gerais, Santa Catarina, and the Federal District for males and in the Federal District and Espírito Santo for females (Chart 1).
Discussion
The results of the present study show the trend of risk for premature mortality from CNCDs in Brazil and in the FUs and detail the analysis ac-cording to gender and to the four main groups of causes.
Some limitations must be emphasized. Ini-tially, the use of SIM secondary data, which dis-plays different levels of underreporting of deaths in the FUs, and the large fluctuations in the mor-tality rates in states with a very small population, such as those in the North region of the country, were limitations. However, the limitation regard-ing the underreportregard-ing of deaths was minimized using correction factors from the Active Search of Deaths, as well as by the reallocation of deaths with ill-defined causes for the analysis and calcu-lation of specific mortality rates according to the group of cause and gender for each FU. The fluc-tuation of mortality rates in FUs with small pop-ulation sizes were smoothed using their moving average.
A
lv
es CG,
M
o
rais N
The time-series analysis of the group of causes of DCS in Brazil showed a decrease for both gen-ders. All FUs, except Acre, Roraima, and Paraíba,
exhibited a decreasing trend of premature mor-tality rates. The magnitude of the mean annual growth rates for DCS was greater than that of the
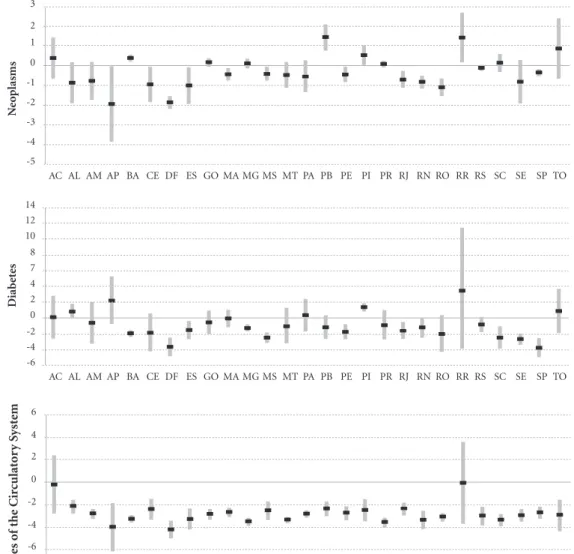
Figure 1. Mean annual growth rate of the standardized mortality rates per groups of causes (%) and
corresponding 95% CI. Males. Brazil and FUs, 2000 to 2011.
Mean Annual Growth Rate (%)
UL (95% CI) LL (95% CI) -5
-4 -3 -2 -1 0 1 2
AC AL AM AP BA CE DF ES GO MA MG MS MT PA PB PE PI PR RJ RN RO RR RS SC SE SP TO
N
eo
plasms
-10 -8 -6 -4 -2 0 2 4 6
AC AL AM AP BA CE DF ES GO MA MG MS MT PA PB PE PI PR RJ RN RO RR RS SC SE SP TO
Diab
et
es
-6 -5 -4 -3 -2 1 0 1
AC AL AM AP BA CE DF ES GO MA MG MS MT PA PB PE PI PR RJ RN RO RR RS SC SE SP TO
Dise
ases o
f the C
ir
culat
o
ry S
yst
em
-20 -15 -10 -5 0 5 10
AC AL AM AP BA CE DF ES GO MA MG MS MT PA PB PE PI PR RJ RN RO RR RS SC SE SP TO
C
hr
o
nic R
espir
at
o
ry Dise
e C
ole
tiv
a,
20(3):641-654,
2015
Figure 2. Mean annual growth rate of standardized mortality rates per groups of causes (%) and corresponding
95% CI. Females. Brazil and FUs, 2000 to 2011.
Mean Annual Growth Rate (%)
UL (95% CI) LL (95% CI) -5
-4 -3 -2 -1 0 1 2 3
AC AL AM AP BA CE DF ES GO MA MG MS MT PA PB PE PI PR RJ RN RO RR RS SC SE SP TO
N
eo
plasms
-6 -4 -2 0 4 7 10 12 14
AC AL AM AP BA CE DF ES GO MA MG MS MT PA PB PE PI PR RJ RN RO RR RS SC SE SP TO
Diab
et
es
-8 -6 -4 -2 0 2 4 6
AC AL AM AP BA CE DF ES GO MA MG MS MT PA PB PE PI PR RJ RN RO RR RS SC SE SP TO
Dise
ases o
f the C
ir
culat
o
ry S
yst
em
-15 -10 -5 0 5 10
AC AL AM AP BA CE DF ES GO MA MG MS MT PA PB PE PI PR RJ RN RO RR RS SC SE SP TO
C
hr
o
nic R
espir
at
o
ry Dise
ases
2 8
remaining groups of causes in both genders in the period analyzed. When analyzing mortality from cardiovascular disease in Brazil and in the
metropolitan region of São Paulo from 1990 and
2009, Mansur and Favarato16 found decreasing
A
lv
es CG,
M
o
rais N
especially in the subgroups of causes Ischemic Heart Diseases and Cerebrovascular Diseases. The study from Cesse17 analyzed a historical
se-ries from 1950 to 2000 and observed a decreas-ing mortality trend from DCS in capitals from
the Southeast region from 1970 to 2000. In the Northeast region, the trend was stationary before the year 2000 and decreased after this period. A study from Schmidt et al.18 showed an important
decrease in the mortality rates from
cardiovascu-Chart 1. Distribution of Federal Units regarding favorable and unfavorable scenarios of meeting the premature
mortality reduction goal of the Action Plan to Combat CNCDs, according to groups of causes of CNCDs and gender.
Group of Causes
Neoplasms
Diabetes Mellitus
Diseases of the Circulatory System
Chronic Respiratory Diseases
All Groups of Causes of CNCDs
Gender
Male Female
Male Female
Male
Female
Male
Female
Male
Female
Favorable Scenario
No Federate Units No Federate Units
No Federate Units São Paulo and the Federal District
Bahia, Minas Gerais, Espírito Santo, Rio de Janeiro, Paraná, Santa Catarina, Rio Grande do Sul, Mato Grosso, and the Federal District
Rondônia, Amazonas, Pará, Maranhão, Rio Grande do Norte, Pernambuco, Sergipe, Bahia, Minas Gerais, Espírito Santo, São Paulo, Paraná, Santa Catarina, Rio Grande do Sul, Mato Grosso, Goiás, and the Federal District
Amazonas, Roraima, Minas Gerais, Rio de Janeiro, São Paulo, Paraná, Santa Catarina, Rio Grande do Sul, and the Federal District Amazonas, Minas Gerais, Paraná, and the Federal District
Amapá, Rio de Janeiro, Minas Gerais, Santa Catarina, and the Federal District
Federal District and Espírito Santo
Unfavorable Scenario
All Federate Units All Federate Units
All Federate Units
Rondônia, Acre, Amazonas, Roraima, Pará, Amapá, Tocantins, Maranhão, Piauí, Ceará, Rio Grande do Norte, Paraíba, Pernambuco, Alagoas, Sergipe, Bahia, Espírito Santo, Rio de Janeiro, Minas Gerais, Paraná, Santa Catarina, Rio Grande do Sul, Mato Grosso do Sul, Mato Grosso, and Goiás
Rondônia, Acre, Amazonas, Roraima, Pará, Amapá, Tocantins, Maranhão, Piauí, Ceará, Rio Grande do Norte, Paraíba, Pernambuco, Alagoas, Sergipe, São Paulo, Mato Grosso do Sul, and Goiás
Acre, Roraima, Amapá, Tocantins, Piauí, Ceará, Paraíba, Alagoas, Rio de Janeiro, and Mato Grosso do Sul
Rondônia, Acre, Pará, Amapá, Tocantins, Maranhão, Piauí, Ceará, Rio Grande do Norte, Paraíba, Pernambuco, Alagoas, Sergipe, Bahia, Espírito Santo, Mato Grosso do Sul, Mato Grosso, and Goiás Rondônia, Acre, Roraima, Pará, Amapá, Tocantins, Maranhão, Piauí, Ceará, Rio Grande do Norte, Paraíba, Pernambuco, Alagoas, Sergipe, Bahia, Espírito Santo, Rio de Janeiro, São Paulo, Santa Catarina, Rio Grande do Sul, Mato Grosso do Sul, Mato Grosso, and Goiás
All the remaining Federate Units
e C
ole
tiv
a,
20(3):641-654,
2015
lar disease between 1996 and 2007;however, the authors highlight that despite the decrease, these rates are still high when compared to those of high-income countries and even to countries in South America. A study by Stevens et al.19 showed
that the group of cardiovascular disease showed the greatest percentage of reduction in a time se-ries from 1991 to 2010.
The present study observed a continuation of the decreasing trend in the Southeast region and a decreasing trend in the Northeast region in the series between the years 2000 and 2011. For DCS, the FUs with an unfavorable scenario for meet-ing the goals of the Plan to Combat CNCDs are concentrated in the North and Northeast regions. Similarly, a study from Nascimento and Morais
Neto20showed a stationary trend for mortality
from Ischemic Heart Disease in the North region and a decreasing trend in the Northeast region but with much lower mean annual growth rates than those of the South and Southeast regions. For the group of cerebrovascular diseases, there was a de-creasing trend in all regions for both genders20.
In the present study in Brazil, there was a de-creasing trend for mortality from neoplasms for both genders in the period from 2000 to 2011, but the mean annual growth rate was much lower than that of DCS. The findings of Fonseca et al.21
showed a decrease of 4.6% for men and 10.5% for women in the Brazilian capitals between 1980 and 2004. However, a study by Silva et al.22
con-ducted in Brazilian capitals between 1980 and 2006 showed that the general mortality rate from neoplasms demonstrated an increasing trend for males and a stationary trend for females. A study from Schmidt et al.18 showed a small reduction in
mortality rates between 1996 and 2007.
The time-series analysis of premature mor-tality from neoplasms in the FUs showed a de-creasing trend in Rondônia, Amapá, Ceará, Rio de Janeiro, São Paulo, and the Federal District in both genders. An increasing trend was identified in Paraíba, Piauí, and Bahia.
For neoplasms, the analysis results showed that all FUs faced an unfavorable scenario to meet the goals of the Action Plan.
There was a decreasing trend of mortali-ty rates from CRDs in Brazil for females and a stationary trend for males. A study by Stevens et al.19 showed a decreasing trend in mortality rates
from CRDs for both genders in Brazil in a time series from 1996 to 2010.
Based on the analysis of a time series for mortality from CRDs in both genders, the pres-ent study showed a decreasing trend in FUs from
the following regions: North (Amapá, Rondônia, Amazonas, Pará); Northeast (Piauí, Bahia); Southeast (Minas Gerais, Rio de Janeiro, Bra-zil ); South (Santa Catarina, Rio Grande do Sul, and Paraná); and Midwest (the Federal District); there was an increasing trend in Pernambuco and Sergipe for males and females, respectively.
The stationary trend of premature mortality from CRDs in the states of Acre and Mato Gros-so may be asGros-sociated with the air quality resulting from agricultural burning practices. According to some previous studies, the increased morbid-ity and mortalmorbid-ity rates from CRDs in a FU from the North and Midwest is related to agricultural burning practices in the region of the “arc of de-forestation”, which ranges from Paragominas/state of Pará (PA) to Rio Branco/state of Acre (AC)23-25.
For CRDs, the vast majority of FUs faced an unfavorable scenario for meeting the goals for both genders, except for Amazonas, Minas Gerais, Paraná and the Federal District.
For diabetes mellitus, the trend in mortal-ity rates in Brazil was stationary for males and decreasing for females. According to a study by Lessa26, which analyzed data from the 1980s and
1990s, there was an increasing trend for mortal-ity from diabetes mellitus in Brazil in this peri-od, and women faced the highest risk. A study by Stevens et al.19 shows a stationary trend between
the years 1991 and 2010 for both genders in stan-dardized mortality rates.
In the present study, the time-series analysis for diabetes mellitus in males showed an increas-ing trend in FUs in the Northeast (Piauí, Mara-nhão, and Alagoas) and in Pará and Paraná. A decreasing trend was observed for both genders in the Federal District, Sergipe, and Pernambuco, and for females there was a decrease in ten FUs. These findings are in agreement with the results presented in a study by Mattos et al.27, which
ana-lyzed trends for mortality from diabetes mellitus in Brazilian state capitals from 1980 to 2007 and found that the highest rates were always observed in state capitals from the Northeast region. When analyzing the time series from 1980 to 2007, these authors showed an increasing trend in most Bra-zilian state capitals, except for Belo Horizonte, which demonstrated a decreasing trend, and for Macapá, Rio de Janeiro, and São Paulo, which demonstrated stationary trends.
A
lv
es CG,
M
o
rais N
The trend analysis of mortality rates in the FUs standardized according to groups of causes and gender allowed the identification of those FUs with a favorable scenario for meeting the goal and those FUs that will likely have difficulty meeting the reduction of 2% per year in the mor-tality rate from CNCDs.
The present study determines the scenari-os of strata of FUs with different pscenari-ossibilities of meeting the goals of the Plan to Combat CNCDs, using the mean annual growth rates estimated by the time-series analysis for each group of causes as parameters.
Recent studies on the time-series analysis of mortality from CNCDs are mainly restricted to minicipalities28,groups of states29-31, regions19,20,
other countries including Cuba32, Nigeria33,
Mexi-co and Colombia34, India35, and Portugal36 or even
studies on monitoring risk and protection factors for CNCDs in Brazil37,38 and in other countries1.
However, none of these studies analyzed the trend of CNCDs in all 27 FUs in Brazil, which character-izes the innovative approach of the present study.
The comparison of FUs with unfavorable sce-narios for DCS with some indicators of the health supplement of the National Research by House-hold Sample (Pesquisa Nacional por Amostra de Domicílios - PNAD) of 2008 shows consistency with FUs with higher rates of smoking and phys-ical inactivity, such as Acre, Alagoas, Ceará, Piauí, and Paraíba39. For Malta et al.40, the balance of the
first year of the Plan to Combat CNCDs in Brazil points to important advances through the imple-mentation of regulatory measures regarding to-bacco, alcohol, and processed food, as well as the investment in preventive and health promotion actions implemented jointly by federal entities. Additionally, the strengthening of primary care and investments in the health services network favor the control of CNCDs nationwide.
To achieve the reduction goal for premature mortality from CNCDs, the most important in-terventions should be focused on reducing the prevalence of modifiable risk factors. A success-ful example in Brazil is the National Policy for Tobacco Control.
Tobacco control measures lead to a reduction in the percentage of smokers, a decrease from
34.8% in 1989 to 12.1% in 201241. According to
Monteiro et al.42, a mean annual reduction of
2.5% was observed between 1989 and 2003, a much higher value than that obtained by other countries around the world that implemented tobacco control policies. However, this impact has not been markedly felt in reducing
prema-ture mortality from CRDs and neoplasms due to the birth cohort effect that still exists in the adult Brazilian population.
Despite the positive results regarding smok-ing and the reduction of premature mortality from CNCDs in Brazil, the present study shows that the country needs to intensify its actions to achieve the goals of the Action Plan.
The plan is under way at the federal level, and several FUs have been producing their own plans and implementing actions focused on the major risk factors common to all four disease groups. These actions include surveillance, expansion and qualification of the comprehensive care of people living with chronic diseases, as well as health promotion interventions on the determi-nants of these diseases.
However, a major challenge is the required increased investments in the healthcare network focusing on the prevention, diagnosis, and treat-ment of neoplasms and diabetes mellitus, espe-cially in the North and Northeast regions of the country43.
Conclusions
The trend analysis of premature mortality from CNCDs shows great advances in the decrease of DCS as well as in the other groups of caus-es in some FUs. However, major challengcaus-es such as the reduction of premature mortality from neoplasms and diabetes mellitus should be pri-oritized, whether regional differences, social inequities in health, prevention of major modi-fiable risk factors for CNCDs, access and quali-ty of healthcare services, and other aspects still need additional studies for further clarification. These additional aspects include differentiating the determinants of premature mortality in the FUs from the South and Southeast regions when compared to the North and Northeast and find-ing the determinants involved in the production of gender differentials.
Conversely, the study strengths include the ability to estimate mortality trends according to the four main groups of causes in the FUs, the use of qualified mortality data, and the ability to identify scenarios for meeting the goals of the Plan to Combat CNCDs.
e C
ole
tiv
a,
20(3):641-654,
2015
supports the review of inequities between FUs and gender, which should be two priorities that are more emphatically considered in the Action Plan to Combat CNCDs.
Collaborations
CG Alves and OL Morais Neto participated in the conception, design, analysis, and interpreta-tion of data, as well as in writing and revising the article.
Szwarcwal DCL, Morais Neto OL, Frias PG, Souza Ju-nior PRB, Almeida WS, Morais Neto OL. Correction of vital statistics based on a proactive search of deaths and live births: evidence from a study of the North and Northeast regions of Brazil. Popul Health Metr 2014; 12:16.
Instituto Brasileiro de Geografia e Estatística (IBGE).
CensosDemográfico 2000 e 2010. Rio de Janeiro: IBGE;
2010 [acessado 2013 maio 18]. Disponível em: http:// www.censo2010.ibge.gov.br/sinopse/index.php?da-dos=6&uf=00
Brasil. Ministério da Saúde (MS). Departamento de Informática do SUS – Datasus. Informações em Saúde –
Tabnet. Estatísticas Vitais 2013 [acessado 2013 Ago 15].
Disponível em: http://www2.datasus.gov.br/Datasus/ index.php?area=0205
Antunes JLF, Waldman EA. Trends and spatial distri-bution of deaths of children aged 12-60 months in São Paulo, Brazil, 1989-98. Bull World Health Organ 2002; 80(5):391-398.
Stata Corporation. Stata Statistical Software [compu-ter program]. Version 11.0. Stata Corporation:College Station. Texas. [acessado 2014 jan 8]. Disponível em: http:www.stata.com
Mansur AP, Favarato D. Mortalidade por Doenças Car-diovasculares no Brasil e na Região Metropolitana de São Paulo: Atualização 2011. Arq. Bras. Cardiol. 2012; 99(2):755-761.
Cesse EAP. Epidemiologia e determinantes sociais das
doenças crônicas não transmissíveis no Brasil [tese].
Re-cife: Centro de Pesquisas Aggeu Magalhães; 2007. Schmidt MI, Duncan BB, Azevedo SG, Menezes AM, Monteiro CA, Barreto SM, Chor D, Menezes PR. Chro-nic non-commuChro-nicable diseases in Brazil: burden and current challenges. Lancet 2011; 377(9781):1949-1979. Stevens A, Schmidt MI, Duncan BB. Gender inequali-ties in non communicable disease mortality in Brazil.
Cien Saude Colet 2012; 17(10):2627-2634.
11.
12.
13.
14.
15.
16.
17.
18.
19. References
World Health Organization (WHO). Global status
report on non communicable diseases 2010. Geneva:
WHO;2011.
World Health Organization (WHO). Preventing
chro-nic diseases a vital investment. Geneva: WHO; 2005.
Schmidt MI, Duncan BB, Azevedo SG, Menezes AM, Monteiro CA, Barreto SM, Chor D, Menezes PR. Chro-nic non-commuChro-nicable diseases in Brazil: burden and current challenges. Lancet 2011; 377(9781):1949-1979. Malta DC, Morais Neto, OL, Cezário AC, Silva Junior JB, Moura L. A construção da vigilância e prevenção das doenças crônicas não transmissíveis no contexto do Sistema Único de Saúde. Epidemiol. Serv. Saúde 2006; 15(3):47-65.
Malta DC, Silva Junior JB. O Plano de Ações Estratégi-cas para o Enfrentamento das Doenças CrôniEstratégi-cas Não Transmissíveis no Brasil e a definição das metas globais para o enfrentamento dessas doenças até 2025: uma re-visão. Epidemiol. Serv. Saúde 2013; 22(1):151-164. United Nations (UN). Resolutions adopted by the Ge-neral Assembly. 66/2. Political declaration of the High -level Meeting of the General Assembly on the Prevention
and Control of Non-communicable diseases 2011.
Wa-shington: UN; 2011.
World Health Organization (WHO). Global Action Plan 2013 for the prevention and control of
noncommu-nicable diseases 2013-2020. Geneva: WHO; 2013.
Brasil. Ministério da Saúde (MS). Secretaria de Vigilân-cia em Saúde. Departamento de Análise de Situação de Saúde. Plano de ações estratégicas para o enfrentamento das doenças crônicas não transmissíveis (DCNT) no
Bra-sil 2011-2022. Brasília: MS; 2011.
Malta DC, Morais Neto OL, Silva JB. Plano de ações estratégicas para enfrentamento das doenças crônicas não transmissíveis (DCNT) no Brasil: 2011-2022.
Epi-demiol. Serv. Saúde 2011; 2(1):425-438.
Organização Mundial da Saúde (OMS). Centro Colabo-rador da OMS para Classificação de Doenças em Portu-guês. 2ª Edição. São Paulo: Editora da Universidade de São Paulo; 1994.
1.
2. 3.
4.
5.
6.
7.
8.
9.
A
lv
es CG,
M
o
rais N
Nascimento AF, Morais Neto OL. Como morrem os brasileiros: ranking e tendências das taxas de mortali-dade por grupos de causas no Brasil e regiões – 2000 a 2011. In: Ministério da Saúde. Secretaria de Vigilância em Saúde. Departamento de Análise de Situação em Saúde. Saúde Brasil 2012. Brasília: MS; 2013.
Fonseca LAM, Eluf-Neto J, Filho VW. Tendência da Mortalidade por Câncer nas Capitais dos Estados do Brasil, 1980-2004. Revista da Associação Médica
Brasi-leira 2010; 56(3):309-312.
Silva GA, Gamarra CJ, Girianelli VR, Valente JG. Ten-dência da Mortalidade por Câncer nas capitais e in-terior do Brasil entre 1980 e 2006. Rev Saude Publica 2011;45(6):1009-1018.
Gonçalves KS, Castro HA, Hacon SS. As queimadas na região Amazônica e o adoecimento respiratório. Cien
Saude Colet 2012; 17(6):1523-1532.
Mascarenhas ADM, Vieira LC, Lanzieri TM, Leal APPR, Duarte AF, Hatch DL. Poluição atmosférica de-vida à queima de biomassa florestal e atendimentos de emergência por doença respiratória em Rio Branco – Setembro, 2005. J Bras Pneumol. 2008; 34(1):42-46. Souza LSN. Análise de Impactos das Queimadas sobre a Saúde Humana: um estudo de caso do Município de
Rio Branco - Acre. 2008 [dissertação]. Recife: Centro de
Pesquisas Aggeu Magalhães; 2008.
Lessa I. Doenças crônicas não-transmissíveis no Brasil: um desafio para a complexa tarefa da vigilância. Cien
Saude Colet 2004; 9(4):931-943.
Mattos PE, Luz LL, Santiago LM, Mattos IE. Tendência da mortalidade por diabetes melito em capitais brasi-leiras, 1980-2007. Arquivo Brasileiro de Endocrinologia
Metabólica 2012; 56(1):39-46.
Bassanesi Sl, Azambuja MI, Achutti A. Mortalidade Precoce por Doenças Cardiovasculares e Desigualdades Sociais em Porto Alegre: da Evidência à Ação. Sociedade
Brasileira de Cardiologia 2008; 90(6):403-412.
Cervi A, Hermsdorff HHM, Ribeiro RCL. Tendência da mortalidade por doenças neoplásicas em 10 capitais brasileiras, de 1980 a 2000. Rev Bras Epidemiol 2005; 8(4):407-418.
Soares GP, Brum JD, Oliveira GMM, Klein CH, Silva NAS. Mortalidade por todas as causas e por doenças cardiovasculares em três estados do Brasil, 1980 a 2006.
Rev Panam Salud Publica 2010; 28(4):258-266.
Soares GP, Brum JD, Oliveira GMM, Klein CH, Silva NAS. Evolução de Indicadores Socioeconômicos e da Mortalidade Cardiovascular em três Estados do Brasil.
Arq Bras Cardiol 2013; 100(2):147-156.
Soberats FJS, Galbán PA, Vidal RMT. Mortalidad por câncer en Cuba. Rev Cubana de Salud Pública 2010; 36(1):78-94.
Desalu OO, Oluwafemi JA, Ojo O. Morbidade e morta-lidade relacionadas a doenças respiratórias em adultos atendidos em um hospital terciário na Nigéria. J Bras
Pneumol. 2009; 35(8):745-752.
20.
21.
22.
23.
24.
25.
26.
27.
28.
29.
30.
31.
32.
33.
Dávila CCA, Botero MA, Hernández LEG. Diabetes en México y Colombia: Análisis de La tendência de años de vida perdidos, 1998-2007. Salud Publica 2011; 13(4):560-571.
Joshi R, Cardona M, Iyengar, S, Sukumar A, Raju CR, Raju KR, Raju K, Reddy KS, Lopez A, Neal B. Chronic diseases now a leading cause of death in rural India – mortality data from the Andhra Pradesh Rural Health Initiative. Int J Epidemiol 2006; 35(6):1522-1529. Boavida JM, Pereira M, Ayala, M. A mortalidade por Diabetes em Portugal. Rev Científica da Ordem dos
Mé-dicos Acta Médica Portuguesa 2013; 26(4):315-317.
Brasil. Ministério da Saúde (MS). Vigitel Brasil 2012: vigilância de fatores de risco e proteção para doenças
crô-nicas por inquérito telefônico. Brasília: MS; 2013.
Duncan BB, Chor D, Aquino EML, Bensenor IM, Mill, JG, Schmidt MI, Lotufo PA, Vigo A, Barreto SM. Doen-ças Crônicas Não Transmissíveis no Brasil: prioridade para enfrentamento e investigação. Rev Saude Publica 2012; 46(Supl. 1):126-134.
Instituto Brasileiro de Geografia e Estatística (IBGE). Pesquisa Nacional por Amostra de Domicílios. Um panorama da saúde no Brasil. Acesso e utilização dos serviços, condições de saúde e fatores de risco e proteção à
saúde 2008. Rio de Janeiro: IBGE; 2010.
Malta DC, Dimech CPN, Moura L, Silva Junior JB. Balanço do primeiro ano da implantação do Plano de Ações Estratégicas para o Enfrentamento das Doenças Crônicas Não Transmissíveis no Brasil, 2011 a 2022.
Epidemiol Serv Saude 2013;22(1):171-178.
Malta DC. Doenças Crônicas Não Transmissíveis, um grande desafio da sociedade contemporânea. Cien
Sau-de Colet 2014; 19(1):4-5.
Monteiro CA, Cavalcante TM, Moura EC, Claro RM, Szwarcwald CL. Population-based evidence of a strong decline in the prevalence of smokers in Brazil (1989-2003). Bull World Health Organ 2007; 85(7):527-534. Silva Junior JB, Magalhães Junior HM. Iniciatives in cancer control from Brazil´s Ministry of Health. Lancet 2013; 14(5):385-386.
Article submitted on 10/01/2014 Approved on 10/21/2014
Final version presented on 11/02/2014 34.
35.
36.
37.
38.
39.
40.
41.
42.