AR
TICLE
1 Instituto de Comunicação e Informação Científica e Tecnológica em Saúde, Fundação Oswaldo Cruz. Av. Brasil 4.365/225, Manguinhos. 21040-360 Rio de Janeiro RJ Brasil. [email protected] 2 Universidade Federal de Minas Gerais. Belo Horizonte MG Brasil.
Alcohol abuse and involvement in traffic accidents
in the Brazilian population, 2013
Abstract This article aims to analyze alcohol abuse and frequent consumption according to so-ciodemographic characteristics and investigate the risk of greater involvement in traffic accidents, us-ing data from the National Health Survey (PNS), 2013, Brazil. Events investigated were alcohol abuse and frequent consumption and if the indi-vidual was involved in a traffic accident and sus-tained an injury in the last 12 months. We inves-tigated both events according to sociodemographic characteristics and assessed the association among them through multivariate logistic regression. The prevalence of alcohol abuse and frequent consumption was 6.1% for the population aged 18 years and over, 8.9% among men and 3.6% among women. The prevalence of involvement in traffic accidents was 3.1% in the general popula-tion and 6.1% among those who reported alco-hol abuse. After controlling for sociodemographic factors, alcohol abuse and frequent consumption was significantly associated with traffic accidents. Considering a higher risk of involvement in traffic accidents among individuals who reported alco-hol abuse and frequent consumption, monitoring blood alcohol concentration of drivers becomes a strategic possibility of intervention.
Key words Health survey, Alcoholic beverages, Traffic accidents, Brazil
Giseli Nogueira Damacena 1
Deborah Carvalho Malta 2
Cristiano Siqueira Boccolini 1
Paulo Roberto Borges de Souza Júnior 1
Wanessa da Silva de Almeida 1
Lucas Sisinno Ribeiro 1
Dama
ce
na GN
Introduction
Alcohol is a widely used drug classified as a law-ful drug and known for its psychotropic charac-teristics that promote sociability and integration among individuals. Moreover, in many cultures, its consumption is promoted during social events, celebrations, religious ceremonies, among other occasions1,2. According to recent data from the World Health Organization published in the Global Status Report on Alcohol and Health 20143, alcohol is consumed practically all over the world. It is estimated that individuals aged 15 years or older consumed, in 2010, about 6.2 liters of pure alcohol, equivalent to about 13.5 g daily3. While countries like Brazil, Argentina and Venezuela have a relatively high proportion of individuals who do not consume alcohol (over 40% of the population over 15 years), the per capita consumption of those who consume was considerably higher than the global average in 2010 (Brazil 8.7 liters, Argentina 9.3 liters and Venezuela 8.9 liters)3,4. In Brazil, estimated con-sumption among men is 13.6 liters and 4.2 liters among women3.
Alcohol consumption has become a serious public health problem since it is a risk factor for chronic noncommunicable diseases and causes other issues, such as problems at work and with family, involvement in accidents and violence, causing, sometimes, legal losses5-7.
In small quantities, alcohol consump-tion causes a state of euphoria and disinhibiconsump-tion. However, high blood alcohol concentrations cause a decreased attention, false speed percep-tion, euphoria, increased reaction time, sleep-iness, decreased peripheral vision and neuro-motor changes, which in varying levels result in loss of capacity of driving a motor vehicle and becomes an important specific cause of death among traffic accidents victims8-11. To check the effect of the substantial and frequent intake, the Centers for Disease Control and Prevention (CDC) established the “heavy drinking” indica-tor, which considers a weekly intake greater than or equal to 8 doses of alcoholic drinks for women and 15 doses for men by week12.
Studies in recent decades point to a clear trend of increased risk for the occurrence of traf-fic accidents among drunk drivers compared to those who do not drink alcohol when about to drive9,10,13, which led Brazil to adopt, since 2008, a law known as the Lei Seca (Prohibition), which stated that motor vehicle drivers would commit offense and receive a traffic ticket if they were
caught in the breathalyzer test driving with more than 0.1 milligrams of alcohol per liter of air in the body, and also determined it would be a crime if the level of milligrams of alcohol per li-ter of air in the body was equal to or greali-ter than 0.34 ml14. In 2013, the law became stricter, with zero tolerance for the level of alcohol in the body, that is, drivers who are caught driving with any quantity alcohol in the body are fined. Howev-er, crime-characterizing alcohol concentration remained at 0.34 milligrams of alcohol per liter of air15.
The monitoring of the alcohol abuse and frequent consumption is necessary to the extent that it seeks to understand these patterns of con-sumption and most vulnerable population seg-ments, which are some of the key aspects to sub-sidize public health promotion and risk behavior prevention policies16,17.
Thus, we intended to analyze alcohol abuse and frequent consumption according to sociode-mographic characteristics and investigate the risk of greater involvement in traffic accidents, using data from the National Health Survey (PNS) held in 2013 in Brazil.
Methodology
The National Health Survey (PNS) is a nation-al household-based research carried out by the Oswaldo Cruz Foundation and the Ministry of Health, in partnership with the Brazilian Insti-tute of Geography and Statistics (IBGE). The study was approved in June 2013 by the National Research Ethics Commission (CONEP) under Opinion No 328.159 and fieldwork was carried out between August 2013 and February 2014.
e C
ole
tiv
a,
21(12):3777-3786,
2016
In the present study, we analyzed the relation-ship between alcohol abuse and frequent con-sumption and traffic accidents. Both events were obtained by applying the individual PNS ques-tionnaire conducted with adult residents selected in the household. To characterize alcohol abuse and frequent consumption, we used the “heavy drinking” indicator proposed by CDC, which considers the weekly intake greater than or equal to 8 doses for women and 15 doses for men12. We considered two PNS issues to calculate this in-dicator: “How many days a week do you usually drink some alcohol beverages?” and “In general, when you actually drink, how many alcoholic beverages do you consume? (1 dose of alcohol is equivalent to one can of beer, 1 glass of wine or 1 shot of cachaça, whiskey or other distilled spirits).” The results of the two questions were multiplied, and to characterize alcohol abuse and frequent consumption, we considered outcomes greater than or equal to 8 doses a week for women and 15 doses a week for men.
Regarding traffic accidents, we used the ques-tion: “In the last 12 months, were you involved in a traffic accident in which you have suffered bodily injury (injuries)?” Besides investigating the traffic accident in the general population, in the present study, we investigated this event in the population who reported alcohol abuse and frequent consumption.
We also investigated the individual’s condi-tion at the time of the accident: Car/van, bus, truck, motorcycle or bicycle driver; car/van, bus, truck, motorcycle or bicycle passenger; pedestri-an; or other status. In addition, we investigated the prevalence of involvement in a traffic acci-dent in the general population and among indi-viduals who reported alcohol abuse and frequent consumption by Federal Unit.
Regarding sociodemographic analysis, we considered the following characteristics: gender (male, female); age group (18-29; 30-39; 40-49; 50-59; 60-69; 70+ years); level of schooling (in-complete secondary school, (in-complete secondary school and over); skin color/race (white, brown, black); and marital status (single, married, sepa-rated/divorced, widower/widow). We performed bivariate logistic regressions with a confidence level of 95% between each of the sociodemo-graphic variables and the corresponding depen-dent variable, either alcohol abuse and frequent consumption or traffic accident event.
For multivariate analysis, we used logistic re-gression model with 95% confidence level, using the dependent variable of traffic accidents events
in the last 12 months prior to the survey and age, gender, schooling level, color skin/race, marital status and alcohol abuse and frequent consump-tion as independent variables.
We performed analyses using the statistical SPSS version 21.020, taking into account the im-pact of the sampling plan.
Results
We analyzed 60,202 interviewed individuals in the PNS. The prevalence of alcohol abuse and frequent consumption was 6.1% for the popu-lation aged 18 years and over and 8.9% among males and 3.6% among females. The highest in-cidence of alcohol abuse and frequent consump-tion were among younger men (8.1% - 18-29 years old). Regarding females, there was a sta-tistically significant gradient in the distribution of the prevalence of alcohol abuse and frequent consumption, with higher rates among younger women, decreasing with age (Table 1).
Results by level of schooling show that there was no difference in the prevalence of alcohol abuse and frequent consumption among men. However, among women, there was a statistical-ly significant difference at 5%, and the highest prevalence of alcohol abuse and frequent con-sumption was 4% among those who have com-pleted secondary school and over. (Table 1).
With regard to skin color/race, the highest prevalence of alcohol abuse were among individ-uals who reported having black skin (12.4% for males and 5.9% for females). Odds ratios indi-cated that both men and women who reported having white skin are less likely prone to alcohol abuse and frequent consumption. In the analysis by marital status, regardless of gender, the highest prevalence was among single individuals: 11.4% among men and 6.1% among women. Both the results for married or widowed men and wom-en have indicated a protective effect for alcohol abuse and frequent consumption (Table 1).
Dama
ce
na GN
general population and among those with alco-hol abuse and frequent consumption. Regarding the analysis by age group, in the general popu-lation, the prevalence of involvement in a traffic accident decreases with age (Table 2).
With regard to schooling level, there was no statistically significant difference among men, both in the general population and among in-dividuals who reported alcohol abuse and fre-quent consumption. However, women who had completed secondary school and over had great-er involvement in traffic accidents. Among indi-viduals who reported alcohol abuse and frequent consumption, the only statistically significant difference was among white men over black men. Single men were the ones who were involved the most in traffic accidents in the general popula-tion. Separated or divorced women did not show statistically significant differences in relation to single in the general population with respect to involvement in traffic accidents. However, among those who reported alcohol abuse and frequent consumption, this relationship was significant
and with lower odds of involvement than single women (Table 2).
Of the people who were involved in traffic accidents, 45.2% were motorcycle drivers and, among those who reported alcohol abuse, this percentage increases to 54% (Table 3).
In the analysis of the prevalence of traffic ac-cidents per Federal Unit, we observed that, for most FUs, prevalence rates were higher among those who reported alcohol abuse than for the general population, except in Pará, Maranhão, Espírito Santo, Paraná and the Federal District. The highest prevalence rates among individuals with alcohol abuse were in Roraima (14.6%), Mato Grosso (14%) and Santa Catarina (11.7%). In the general population, these percentages reached 8.7% in Roraima and 5.7% in Piauí and Mato Grosso. The states with lower traffic acci-dent prevalence rates in the general population were Rio de Janeiro and Rio Grande do Sul, both with a prevalence of 1.9%, and among those with alcohol abuse, Espírito Santo (0.4% ) (Figure 1).
Results of multivariate logistic regression
Sociodemographic characteristics
Total Age group
18 to 29 years 30 a 39 years 40 a 49 years 50 years and over Schooling level
Incomplete secondary school Secondary school completed and over Skin color/race
White Brown Black Marital status
Married
Separated/Divorced Widower/Widow Single
Table 1. Prevalence of abuse and frequent alcohol consumption and their respective odds ratios by sociodemographic characteristics. PNS, Brazil, 2013.
* Odds ratio (OR) estimated by bivariate logistic regression between the prevalence of alcohol abuse and frequent consumption with each of the sociodemographic variables.
%
8.9
10.3 10.0 10.7 6.2
9.4 8.3
7.6 9.6 12.4
6.6 9.7 5.5 11.4
OR
-1.745 1.689 1.823 1.000
1.000 0.880
0.594 0.766 1.000
0.555 0.841 0.451 1.000
p-value
-0.000 0.000 0.000
-0.099
0.000 0.015
-0.000 0.274 0.009
-Male
Alcohol abuse and frequent consumption
%
3.6
6.0 4.3 3.5 1.5
3.2 4.0
2.6 4.2 5.9
1.7 4.9 0.9 6.1
OR
-4.229 2.945 2.414 1.000
1.000 1.241
0.464 0.762 1.000
0.265 0.804 0.142 1.000
p-value
-0.000 0.000 0.000
-0.021
0.000 0.054
-0.000 0.199 0.000
e C ole tiv a, 21(12):3777-3786, 2016
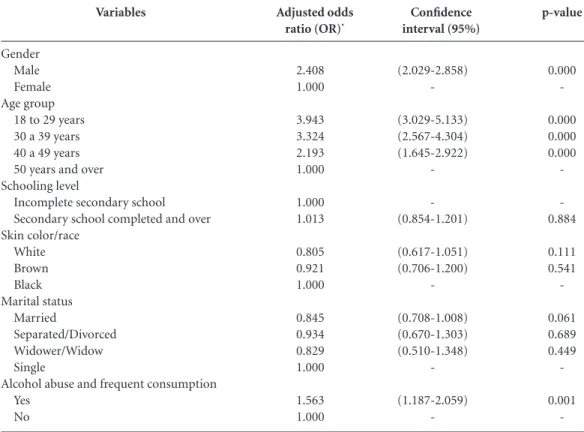
model shown in Table 4, with the dependent variable of involvement in a traffic accident with
bodily injury in the last 12 months preceding the survey show that, after controlling for
sociode-Table 2. Prevalence of involvement in a traffic accident with injuries in the last 12 months preceding the survey and their respective odds ratios by general population and individuals who reported alcohol abuse and frequent consumption by sociodemographic characteristics. PNS, Brazil, 2013.
Odds ratio (OR) estimated between the occurrence of traffic accidents or between the general population, or between individuals who reported abusive and frequent alcohol use with each of the sociodemographic variables.
Sociodemographic characteristics
Total Age group
18 to 29 years 30 a 39 years 40 a 49 years 50 years and over Schooling level
Incomplete secondary school Secondary school completed and over Skin color/race White Brown Black Marital status Married Separated/Divorced Widower/Widow Single % 4.5 7.1 6.1 3.7 1.7 4.2 4.9 3.9 4.9 5.5 3.2 2.8 2.3 6.1 OR* -4.491 3.847 2.278 1.000 1.000 1.171 0.737 0.925 1.000 0.502 0.444 0.354 1.000 p-value -0.000 0.000 0.000 -0.140 0.071 0.643 -0.000 0.000 0.006 -Male General population % 1.8 3.1 2.2 1.7 0.7 1.5 2.2 1.5 2.1 1.9 1.4 1.7 0.7 2.5 OR* -4.655 3.180 2.411 1.000 1.000 1.489 0.802 1.069 1.000 0.575 0.663 0.266 1.000 p-value -0.000 0.000 0.000 -0.001 0.330 0.744 -0.000 0.112 0.000 -Female Traffic accidents Sociodemographic characteristics Total Age group
18 to 29 years 30 a 39 years 40 a 49 years 50 years and over Schooling level
Incomplete secondary school Secondary school completed and over Skin color/race White Brown Black Marital status Married Separated/Divorced Widower/Widow Single % 7.5 12.0 8.2 5.1 2.8 8.5 6.1 5.8 7.6 13.1 6.1 2.7 0.4 9.1 OR* -4.830 3.166 1.911 1.000 1.000 0.699 0.447 0.590 1.000 0.644 0.273 0.044 1.000 p-value -0.002 0.025 0.280 -0.164 0.041 0.117 -0.133 0.038 0.003 -Male % 2.8 4.3 2.7 1.4 0.9 1.9 3.6 2.6 3.2 1.8 1.6 0.6 0.0 3.6 OR* -5.179 3.148 1.583 1.000 1.000 1.911 1.107 1.396 1.000 0.442 0.161 0.000 1.000 p-value -0.014 0.103 0.540 -0.027 0.763 0.351 -0.037 0.006 0.739 -Female
Dama
ce
na GN
mographic factors, alcohol abuse and frequent consumption show statistically significant asso-ciation with the outcome.
Discussion
In this work, we used the PNS information held in 2013 to investigate the association of alcohol abuse with the prevalence of traffic accidents with bodily injury in the last 12 months prior to the survey. First, we investigated these two events according to sociodemographic characteristics, and we verified the association between them by multivariate logistic regression.
With regard to alcohol abuse, according to sociodemographic characteristics, the highest prevalence rates were among young single black men. Generally speaking, the same sociodemo-graphic pattern was observed for individuals who were involved in a traffic accident and who reported alcohol abuse and frequent consump-tion. Also with regard to traffic accidents, among men, prevalence rates were higher when subjects reported alcohol abuse and frequent consump-tion when compared to men in the general pop-ulation.
These findings corroborate results of a study conducted with 138,100 U.S. adults who re-sponded to the National Survey on Drug Use and Health from 2009 to 2011, in which the preva-lence of alcohol abuse (in the last month before
the survey) was higher among men aged 18-24 years21. In the same study, abuse prevalence of 10.2% alcohol was found in general (CI 95%, 9.8-10.6), 10.9% (CI 95%, 10.3-11.5) among men and 9.2% (CI 95%, 8.6-9.8) among women, greater than those found in this study
In Brazil, in a study conducted by the Minis-try of Health in the counMinis-try’s state capitals and called Vigitel (Chronic Diseases Risk and Pro-tective Factors Surveillance Telephone Survey), in 2010, alcohol abuse stood at 16.4% (CI 95%, 15.7-17.0), where study defined abuse as the con-sumption of 5 or more doses for men and 4 for women on a single occasion in the last 30 days6. However, both measures were taken through in-dicators with different settings than the adopt-ed in this paper, in which prevalence was lower (6.1%), because the weekly frequency of intake of large alcohol amounts was considered abuse.
Traffic accidents are a major public health problem, since the bodily injury caused by them are a leading cause of injuries and deaths world-wide. According to the WHO13, every year, about 1.2 million people die and millions are injured or become disabled from traffic accidents, especially in low- and middle-income countries. In addition to the limitations that injuries cause to the indi-viduals involved, complications caused by traffic accidents generate a heavy burden on health ser-vices and the economy of nations. According to the WHO Global Report on Road Safety22, traf-fic accidents will rise from ninth cause of death
Condition in the accident
Car/van driver Bus driver Truck driver Motorcycle driver Bicycle driver Car/van passenger Bus passenger Truck passenger Motorcycle passenger Bicycle passenger Pedestrian Other
Table 3. Condition in the most serious traffic accident occurred in the last 12 months prior to the survey and their respective confidence intervals of 95% second general population and individuals who reported alcohol abuse and frequent consumption. PNS, Brazil, 2013.
%
19.0 0.7 0.8 45.2 3.9 8.0 2.0 0.0 12.9 1.8 4.8 0.9
CI95%
(16.0-22.4) (0.3-1.5) (0.4-1.6) (41.1-49.4)
(2.7-5.7) (6.2-10.2)
(1.3-3.1) -(10.4-15.8)
(0.6-4.6) (3.7-6.3) (0.5-1.7)
General population (n = 1,840)
%
17.3 0.0 1.7 54.0 6.5 5.8 2.2 0.0 8.6 1.4 2.5 0.0
CI95%
(10.5-27.1) -(0.4-5.9) (43.8-63.8)
(3.4-11.9) (2.1-14.8) (0.7-6.3)
-(5.1-13.9)
(0.3-5.7) (1.1-5.4)
e C
ole
tiv
a,
21(12):3777-3786,
2016
Figure 1. Prevalence (%) of involvement in traffic accidents in the 12 months prior to the survey and their respective 95% confidence intervals according to the general population and individuals who reported excessive and frequent consumption of alcohol by Federal Unit. PNS, Brazil, 2013.
2 4 28
22 24 26
6 8 10 12 14 16 18 20
0 %
Rondônia
Acre
Amaz onas
Roraima P
ará Amapá
Tocant
ins
Mar
anhão PiauíCeará
Rio G rand
e do N
orte
Paraíba
Pernamb
uco
Alag oas
Serg
ipe
Bahia
Minas Ge
rais
Espír ito S
anto
Rio d
e Jane
iro
São P aulo
Paraná
Santa C
atarina
Rio G rand
e do S
ul
Mato G
rosso d
o Sul
Mato G
rossoGoiás
Dist
rito F
eder
al
General Population Individuals with alcohol abuse and frequent consumption
Variables
Gender Male Female Age group
18 to 29 years 30 a 39 years 40 a 49 years 50 years and over Schooling level
Incomplete secondary school Secondary school completed and over Skin color/race
White Brown Black Marital status
Married
Separated/Divorced Widower/Widow Single
Alcohol abuse and frequent consumption Yes
No
Table 4. Bivariate and multivariate analysis of association between the study variables and the traffic accident. PNS, Brazil, 2013.
Adjusted odds ratio (OR)*
2.408 1.000
3.943 3.324 2.193 1.000
1.000 1.013
0.805 0.921 1.000
0.845 0.934 0.829 1.000
1.563 1.000
Confidence interval (95%)
(2.029-2.858)
-(3.029-5.133) (2.567-4.304) (1.645-2.922)
-(0.854-1.201)
(0.617-1.051) (0.706-1.200)
-(0.708-1.008) (0.670-1.303) (0.510-1.348)
-(1.187-2.059)
-p-value
0.000
-0.000 0.000 0.000
-0.884
0.111 0.541
-0.061 0.689 0.449
-0.001
Dama
ce
na GN
worldwide in 2004 to fifth in 2030, second only to heart, cerebrovascular, chronic pulmonary diseases and lower respiratory infections.
In the United States, a major cause of prema-ture mortality is alcohol abuse. A study aiming at updating national estimates of deaths attrib-utable to alcohol in the United States found that, among adults of working age, 9.8% of all deaths in the country between 2006 and 2010 were at-tributable to excessive alcohol consumption, and motor vehicle traffic accidents accounted for 36% of all deaths attributable to alcohol consump-tion23. In this paper, results showed alcohol abuse potentiation on traffic accidents. In the general population, the prevalence of traffic accidents was 3.1% (CI 95%, 2.8-3.3); among individuals who reported alcohol abuse, this prevalence was nearly twice (6.1 % - CI 95%, 4.9-7.4).
It is essential to broaden the debate about the sociodemographic characteristics of the groups with higher prevalence of involvement in traffic accidents with bodily injuries. Males are in ev-idence when compared to women, both com-pared to the general population and to subjects who reported alcohol abuse. However, one must be attentive to young people as focus of public policies needs on the issue of traffic accidents and alcohol abuse.
The level of schooling can also influence the consumption of alcoholic beverages and the traf-fic accidents. According PNS data analysis with regard to the general population, slightly higher prevalence rates were in those strata with com-plete secondary school and over, which shows a greater purchasing power for the use of pri-vate motor vehicles. When we refer to individ-uals who reported alcohol abuse, men with in-complete secondary education have the highest prevalence, reversing this fact when dealing with women. Black skin color and race also has the highest prevalence compared to white / brown skin color and race.
Regarding the condition of the accident, we wish to emphasize that, among those involved in accidents, 45% in the general population and 54% in those with alcohol abuse and frequent consumption were motorcycle riders. Given that these are more likely to suffer car accidents with injuries, campaigns regarding the importance of helmet use and more focused interventions for this type of driver could help reduce accident rates.
In Thailand, 70% of deaths from traffic acci-dents are associated with the use of motorcycles. A study on approximately one thousand
motor-cycle accidents revealed that alcohol consump-tion was a determining factor in 36% of cases. Drunk bikers were five times more likely of dying than riders who had not consumed alcohol. The greatest risk of accidents among motorcyclists who were under the influence of alcohol were ex-ponentially increased in the following situations: driving at night, driving on curves and out of roads crossing zones, losing control, skidding off the road, not stopping at red traffic lights and not paying attention24.
There is a clear trend of increased risk of ac-cidents among drunk drivers compared to those who do not consume alcohol before driving13. This gave rise to the need to enact and implement nationally Law Nº 11.705, also known as Prohi-bition Law, which was later updated in 2013, es-tablishing zero tolerance for the level of alcohol in the blood of motor vehicle drivers, and even criminalizing and penalizing drivers with 6 deci-grams or more of alcohol per liter in the blood or 0.34 ml or more of alcohol in the body, measured by the breathalyzer test9,14,15,25.
Nationally, when the analysis of traffic ac-cidents was performed comparing the Federal Units, the state of Rio de Janeiro stood out with low prevalence of traffic accidents: 1.9% for the general population, and 4% among individuals with alcohol abuse. These figures may reflect the functionality of Prohibition, which is extensive-ly mainextensive-ly in the municipality of Rio de Janeiro, punishing drivers who are driving under the in-fluence of alcohol. International accounts of a law that entered into force in Japan also show the success of this type of legislation regarding the most effective measures on the control of alcohol consumption in relation to traffic accidents26-28.
e C
ole
tiv
a,
21(12):3777-3786,
2016
Collaborations
Dama
ce
na GN
Barreto ML. O conhecimento científico e tecnológico como evidência para políticas e atividades regulatórias em saúde. Cienc saude colet 2004; 9(2):329-338. Malta DC, Leal MC, Costa MFL, Morais Neto OL. In-quéritos Nacionais de Saúde: experiência acumulada e proposta para o inquérito de saúde brasileiro. Rev bras
epidemiol 2008; 11(Supl. 1):159-167.
Souza-Junior PRB, Freitas MPS, Antonaci GA, Szwar-cwald CL. Desenho da amostra da Pesquisa Nacional de Saúde 2013. Epidemiol Serv Saude 2015; 24(2):207-216.
Damacena GN, Szwarcwald CL, Malta DC, Souza-Ju-nior PRB, Vieira MLFP, Pereira CA, Morais Neto OL, Silva Júnior JB. O processo de desenvolvimento da Pes-quisa Nacional de Saúde no Brasil, 2013. Epidemiol Serv
Saude 2015; 24(2):197-206.
IBM SPSS Statistics for Windows [computer program]. Version 21.0. Armonk: IBM Corp; 2012.
Esser MB, Hedden SL, Kanny D, Brewer RD, Gfroer-er JC, Naimi TS. Prevalence of Alcohol Dependence Among US Adult Drinkers, 2009 2009. Prev Chronic Dis 2014; 11:E206.
World Health Organization (WHO). Global status
report on road safety: time for action. Geneva: WHO;
2009.
Stahre M, Roeber J, Kanny D, Brewer RD, Zhang X. Contribution of Excessive Alcohol Consumption to Deaths and Years of Potential Life Lost in the United States. Prev Chronic Dis 2014; 11:E109.
Peden M, Scurfield R, Sleet D, Mohan D, Hyder AA, Ja-rawan E, Mathers C. World report on road trafic injury
prevention. Geneva: World Health Organization; 2004.
Laranjeira R, Romano M. Consenso brasileiro sobre políticas públicas do álcool. Rev Bras Psiquiatr 2004; 26(Supl. 1):68-77.
Hitosugi M, Sorimachi Y, Kurosu A, Nagai T, Toku-dome S. Risk of death due to alcohol-impaired driving in Japan. Lancet 2003; 361(9363):1132.
Imai H. The new traffic law and reduction of alcohol related fatal crashes in Japan. Inj Prev 2003; 9:382. Martins RHG, Ribeiro CBH, Fracalossi T, Dias NH. A lei seca cumpriu sua meta em reduzir acidentes relacio-nados à ingestão excessiva de álcool? Rev Col Bras Cir
2013; 40(6):438-442.
Article submitted 24/09/2015 Approved 08/12/2015
Final Version submitted 10/12/2015 16.
17.
18.
19.
20. 21.
22.
23.
24.
25.
26.
27. 28. References
World Health Organization (WHO). International guide for monitoring alcohol consumption and related harm. Geneva: WHO; 2002.
World Health Organization (WHO). Strategies to re-duce the harmful use of alcohol. Geneva: WHO; 2008. [acessado 2015 nov 10]. Disponível em: http://apps. who.int/gb/ebwha/pdf_files/A61/A61_13-en.pdf World Health Organization (WHO). Global status
re-port on alcohol and health 2014. Genebra: WHO; 2014.
Babor T, Caetano R, Casswell S, Edwards G, Giesbrecht N, Graham K, Grube J, Gruenewald P, Hill L, Holder H, Homel R, Österberg E, Rehm J, Room R, Rossow
I. Alcohol: no ordinary commodity: The global burden
of alcohol consumption. New York: Oxford University
Press; 2003.
Andrade AG, Anthony JC, Silveira CM. Álcool e suas
conseqüências: uma abordagem multiconceitual. São
Paulo: Minha Editora; 2009.
Malta DC, Silva JB. Plano de Ações Estratégicas para o Enfrentamento das Doenças Crônicas Não Transmis-síveis no Brasil após três anos de implantação, 2011-2013. Epidemiol Serv Saude 2014; 23(3):389-398. Laranjeira R, Pinsky I, Zaleski M, Caetano R. I Levanta-mento Nacional sobre os Padrões de Consumo de Álcool
na População Brasileira. Brasília: Secretaria Nacional
Antidrogas; 2007.
Brewer RD, Swahn MH. Binge Drinking and Violence.
JAMA 2005; 294(5):616-618.
Moura EC, Malta DC, Morais Neto OL, Penna GO, Temporão JG. Direção de veículos motorizados após consumo abusivo de bebidas alcoólicas, Brasil, 2006 a 2009. Rev Saude Publica 2009; 43(5):891-894. Mello Jorge MHP, Adura FE. Álcool e direção veicular.
Revista USP 2013; 96:23-36.
Costa JSD, Silveira MF, Gazelle FK, Oliveira SS, Hallal PC, Menezes AMB, Gigante DP, Olinto MTA, Mace-do S. Consumo abusivo de álcool e fatores associa-dos: estudo de base populacional. Rev Saude Publica
2004; 38(2):284-291.
Centers for Disease Control and Prevention (CDC). Fact Sheets - Preventing Excessive Alcohol Use. [aces-sado 2015 set 10]. Disponível em: http://www.cdc.gov/ alcohol/fact-sheets/prevention.htm
World Health Organization (WHO). Beber e Dirigir: Manual de Segurança de Trânsito para Profissionais de
Trânsito e Saúde. Genebra: Global Road Safety
Partner-ship; 2007.
Brasil. Lei nº 11.705, de 19 de junho de 2008. Dispõe sobre o consumo de bebida alcoólica por condutor de veículo automotor, e dá outras providências. Diario
Oficial da União 2008; 20 jun.
Brasil. Lei nº 12.760, de 20 de dezembro de 2012. Altera a Lei no 9.503, de 23 de setembro de 1997, que institui o Código de Trânsito Brasileiro. Diario Oficial da União
2012; 21 dez. 1.
2.
3. 4.
5.
6.
7.
8. 9.
10. 11.
12.
13.
14.