REVISTA
BRASILEIRA
DE
ANESTESIOLOGIA
PublicaçãoOficialdaSociedadeBrasileiradeAnestesiologiawww.sba.com.br
REVIEW
ARTICLE
Importance
of
using
basic
statistics
adequately
in
clinical
research
夽
Célio
Fernando
de
Sousa
Rodrigues
a,
Fernando
José
Camello
de
Lima
b,
Fabiano
Timbó
Barbosa
b,∗aUniversidadeFederaldeAlagoas,Morfologia,Maceió,AL,Brazil bUniversidadeFederaldeAlagoas,CiênciadaSaúde,Maceió,AL,Brazil
Received10June2016;accepted17January2017 Availableonline1July2017
KEYWORDS
Biostatistics; Anesthesia; Samplesize
Abstract
Backgroundandobjective: Theinadequateuseofbasicstatisticsisthemainresponsiblefor
scientificarticlemisinterpretation.Thepurposeofthisreviewarticlewastoreviewsomebasic statisticaltopicstoalertauthorsandreadersabouttheimportanceofbasicstatisticsproper reporting.
Content: A bibliographical andcross-sectionalstudy wascarried out, which analyzed
publi-cationsinbooksandarticlesinthefollowingdatabases:SciELO(ScientificElectronicLibrary Online)andPubMed(AvailablefromtheNationalCenterforBiotechnologyInformation). Medi-calresearchisnotfreefromtheriskoffalsepositive andfalsenegativeresultsduetothe choiceofstatisticaltestsandpresenceofsmallsamplesizes.
Conclusion: Understandingthecorrectuseofbasicstatisticsleadstofewererrorsinreporting
theresultsofstudiesperformedandintheinterpretationoftheirconclusions.
©2017PublishedbyElsevierEditoraLtda.onbehalfofSociedadeBrasileiradeAnestesiologia. ThisisanopenaccessarticleundertheCCBY-NC-NDlicense(http://creativecommons.org/ licenses/by-nc-nd/4.0/).
PALAVRAS-CHAVE
Bioestatística; Anestesia;
Tamanhodaamostra
Importânciadousoadequadodaestatísticabásicanaspesquisasclínicas
Resumo
Justificativaeobjetivo: Ouso inadequadodaestatística básica é omaior responsávelpelo
errodeinterpretac¸ãodosartigoscientíficos.Oobjetivodesteartigoderevisãofoireveralguns tópicos básicosde estatísticapara alertar autores eleitores sobre aimportância dorelato adequadodaestatísticabásica.
夽 StudyperformedatUniversidadeFederaldeAlagoas.
∗Correspondingauthor.
E-mail:fabianotimbo@yahoo.com.br(F.T.Barbosa).
http://dx.doi.org/10.1016/j.bjane.2017.01.011
Conteúdo: Foifeitapesquisa bibliográficae transversalque analisoupublicac¸ões em livros, artigosnasbasesdedadosSciELO(ScientificElectronicLibraryOnline)ePubMed,doNational
CenterforBiotechnologyInformation.Pesquisasnaáreamédicanãoestãolivresdoriscode
resultadosfalsopositivosefalsonegativosdevidoàescolhadostestesestatísticoseàpresenc¸a depequenostamanhosdeamostra.
Conclusão:Acompreensãoacercadousoadequadodaestatísticabásicapropiciamenoreserros
nosrelatosdosresultadosdeestudosexecutadosenainterpretac¸ãodassuasconclusões. ©2017PublicadoporElsevierEditoraLtda.emnomedeSociedadeBrasileiradeAnestesiologia. Este ´e um artigo Open Access sobuma licenc¸a CC BY-NC-ND(http://creativecommons.org/ licenses/by-nc-nd/4.0/).
Introduction
Statisticsis a sciencethat uses data analysis totest sta-tisticalhypotheses,assessthestrengthofclinicalevidence andthuswhethertherearetrueassociationsorphenomena betweengroups.1Researchersmustformulatehypotheses,
note the biological phenomena occurring in the popula-tionanddrawasample fromthatpopulationtotesttheir hypotheses.Thesamplesimilaritywiththeoriginal popula-tionallowstheresultsofdataanalysistobemorereliable intheelucidationofhypotheses.1
Statistical analysis, which is present in scientific researchesandreportedinoriginalarticles,allowsreaders, patientsandhealthproviderstointerpret theinformation derivedfromdatacollectedduringaresearchanduseitfor thebenefitof society.2 Concernsabout adequately
repor-tingtheresultsofbiomedicalresearcheshavebeenpresent intheworldliteraturesincepastdecades.3
Thefrequencyoftheadequateuseofstatisticaltestscan beseeninanumberofmedicalfields,suchasoncology, radi-ology,surgery,andanesthesiology.2,4---6Consequencescanbe
seriousifthescientificcontentanalysisisinadequate,such asfalseresultswithunwarrantedassumptionsand conclu-sionslackingbiologicalsupport.3
There are several guidelines available for data repor-tingandstatisticalmeasurementsthathavebeenpublished by various authors of scientific articles, indicating which items are important to be used in scientific research reports.7,8Despitetheavailabilityofsuchguidelines,errors
in the use of statistics in research reports stillexist and aredue toboth the use of basic statistics and advanced statistics,butthegreater frequencyof errorsoccurswith the use of basic statistics, contrary to what one might think.2,9
The presentreview isan attempttomake anesthesiol-ogistsaware of thevarious aspectsof statistical methods usedinclinicalresearch,aswellastoattemptthroughthis narrativereviewtoreduceasmuchaspossible the statis-ticalerrorsthatarestillcommittedinbasicstatistics.The objectiveofthispaperwastoreviewsomebasicstatistical topicstoalertscientificresearchauthorsandreadersabout the importance of adequately reporting basic statistical data.
Method
A bibliographic and transversal search of books and sci-entific articles published in electronic media was carried outinthefollowingdatabases:SciELO(ScientificElectronic Library Online) andPubMed (National Centerfor Biotech-nologyInformation).ThefollowingmeSHtermswereused: ‘‘biostatistics’’,‘‘anesthesia’’,‘‘andsamplesize’’.
Literature
review
Basicconceptsofdescriptivestatistics
Cliniciansshouldbeabletomakethebestdecisionsbefore the patient in their routine practice, and acquiring new knowledge will only be possible if they are able to read and critically analyzearticles publishedin scientific jour-nals.Descriptivestatisticsisapartofstatisticsthathelps researchersandreadersunderstandtheinformationofdata collected through its organization and summarization.10
Descriptive statistics is the only statistic usedin descrip-tiveworksandsomeepidemiologicalstudies.10 Theuse of
rawdatainscientificarticles,thatis,dataascollectedin thesurvey,isuncommonandmayimpairitsinterpretation andmakereadinguninteresting.
Descriptivestatisticsisusedtodescribedatausing num-bersorstatisticalmeasuresthatmaybestrepresentalldata collectedduringaresearch.Itisconsideredaninitialstep for the appropriate choice and use of statistical tests of hypotheses.11 Itisessentialtoknowwhichstatisticismost
appropriateforthemostdifferentlevelsofmeasurement.12
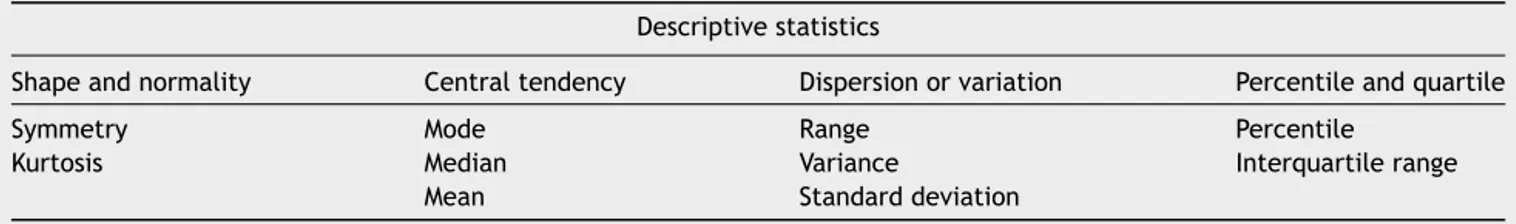
The mostusedinpublishedhealtharticlesmaybeseen in Table1.
Descriptive statistics can be divided into measures of central tendency and dispersion.13 The first uses a value
that representswhat is moretypical and maybe usedto represent all other values collected in a research.13 The
second uses a value that reveals howdata varies around thatvaluethatismoretypical.11Themainmeasuresof
cen-tral tendency are: mean, mode, and median.13 The main
Table1 Summaryofthemostcommonlyuseddescriptivestatisticsinhealthpublications.12
Descriptivestatistics
Shapeandnormality Centraltendency Dispersionorvariation Percentileandquartile
Symmetry Mode Range Percentile
Kurtosis Median Variance Interquartilerange
Mean Standarddeviation
The meanis an importantmeasurebecauseit incorpo-ratesthescorefromeverysubjectintheresearchstudy.12
The requiredsteps for itscalculation are:countthe total numberofcases----referredinstatisticsasn;addupallthe scoresanddividebythetotalnumberofcases.13This
advan-tageofthemeanisalsoitsproblem,asitisaffectedbyhigh orlowdiscrepantscoresthatdistortthedesiredinformation onewishestotransmitabouttheanalyzeddata.12
Mediandiffersfrommeanbecauseitisthemiddlevalue in distributionwhen thevaluesare arrangedinascending order.14Ifwetakerandomvalues,suchas88,89,90,91and
92,wewillhaveamedianof90.
Mode is the value that occurs most often and does not provide an indication of all the valuescollected in a research,butratheritexpressesthemostrepeatedvalue.13
Ifwetakerandomvalues,suchas88,88,90,91and92,we willhaveamodeof88.
Medianandquartilesarevaluesthatrepresentthe posi-tion, in percentage scale, of the values distributed in ascendingorder.Themedianrepresentsthe50%positionin thedistributionscale.14 Tofindoutwherethemedian
posi-tionis, simplydividethe totalscore ofcases bytwo.12 A
simplewaytofindoutthenumericalvaluesortingthe val-ues inascending order,graduallyeliminating theextreme values,andthenidentifyingthevaluethatremainedinthe center.12 This valuewillbethemedian.Insomecases,all
theendvaluesareeliminatedandnocentralvalueremains. When thisoccurs, one shouldaverage the lasttwovalues andthus calculate the centralvalue.12 The median is not
influencedbythediscrepantvaluesandshouldbepreferred whentheyarepresent.14Ifwetakerandomvalues,suchas
85,89,90,91and97,wewillhave90asmedian.
Measures of central tendency have their applicability. Table2showstheindicationfortheapplicationofeach mea-sure.Takingtwosetsofrandomvalues,thefirstbeing88, 89,90,91and92andthesecond30+70+90+120+140,we willhave two setsof 90 asthe mean.By noting only the mean,onedoesnotperceivetheinformationabouttherest ofthevaluesand,therefore,itisnecessarytousedispersion measurestorealizethatdatafromgroupsarenotequal.
Table2 Applicabilityofmeasuresofcentraltendency.12
Measuresofcentraltendency
Characteristics Mean Median Mode
Intervalandscalardata Yes Yes Yes
Ordinaldata No Yes Yes
Nominaldata No No Yes
Distortionwithdiscrepantvalues Yes No No
Valuesmaybe nearor farfromthe meanandthis dis-tancefromthevaluetothemeanisknownasdiscrepancy.12
Thesumofalldiscrepanciescanbezero,soinordertouse thesediscrepancies itisadvisable tosquareeach discrep-ancyvalue beforeusing it mathematically.12 The average
squareofthesevaluesisknownasvariance.12Theanalyzed
variableunitofmeasurementisalsosquare,soinsomecases itisdifficulttounderstanditsmeaning.12
Standard deviation is one of the most commonly used statistical measures to demonstrate data variability.15 It
estimatesthedegreetowhichthevalueofaparticular vari-abledeviatesfromthemean.12Mathematically,thesquare
rootofthevarianceisthestandarddeviation.12Theunitof
measureofavariableremainsinitsoriginalform.12
Total range of a variable is the distance between the highestandlowestvalues.12 Itiscalculatedbysubtraction
betweenthehighestandlowestvaluesfromasetofdata.12
The measuredoes not tellwhether thevalues areevenly distributed,iftherearegroupsofvaluesneareachother,or ifthereareabsentgroupsofvaluesbetweenthecollected data.12
Interquartilerangeisameasurementpositionrelatedto themedian.12Quartilesrepresentthe25%and75%positions
inthescale,sothatthefirstquartilerepresentsthevalue correspondingtothefirstquartileofthedistribution(25%of thevaluesbelowthatposition)andthethirdquartile rep-resentsthevaluecorrespondingtothethirdquartileofthe distribution(75%ofthevaluesabovethatposition).
Dispersionmeasureshavetheirapplicability.Reanalyzing thetwosetsofprevious randomvalues,we cannotethat forthefirstsetthemeanwas90,standarddeviation1.15, andtotalrange88---92andforthesecondsetthemeanwas 90,standard deviation43.01, and totalrange 30---140. By theuseofdispersionmeasures,wecannotethatthesetsof valuesaredifferent.Indicationofwhereeachmeasuremay beusedisinTable3.
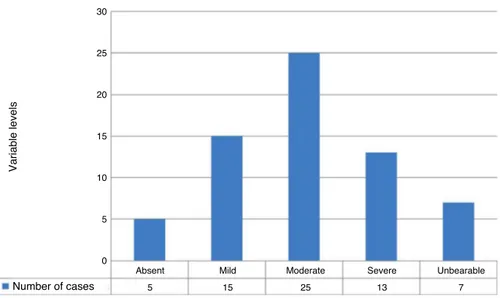
Mean and standard deviation arebest usedwhen data are normally and symmetrically distributed, as well as median and interquartile range for data asymmetrically distributed.12Onewaytoidentifywhethersymmetryoccurs
in data distribution is to create the histogram graph and observeitsshape.12 Graphcreationbeginswiththe
distri-butionof thenumberof casesonthey-axis andthelevel oftheanalyzedvariableonthex-axis(Fig.1).Iftheshape resemblesa bell,thereisalreadyastrong indicationthat dataisnormallydistributed.
Table3 Applicabilityofdispersionmeasures.11---13
Dispersionmeasures
Characteristics Range Interquartilerange Standarddeviation
Intervalandscalardata Yes Yes Yes
Ordinaldata Yes Yes No
Samplevariabilitydescription Yes Yes Yes
Statisticalinferenceparticipation No No Yes
Basicconceptsofinferentialstatistics
Inferentialstatisticsisusedtodrawconclusionsandmake inferencesafteranalyzingdatacollectedinsurveys.13
Infer-entialstatisticsincludehypothesis testsandestimationto make comparisons and predictions and draw conclusions thatwillservepopulationsbasedonsampledata.1
Statisti-calinferencesmaybe:bivariateanalysisandmultivariate analysis.1 The first analyzes the relationship between a
dependentvariableandanindependentvariable.The sec-ondanalyzestherelationshipbetweenadependentvariable andmultipleindependentvariablesandverifiesthe poten-tialconfoundingeffectofthelatteronthefirst.1
Statistical inference is only possible after testing the statistical hypotheses.16 Hypothesis is a numerical
state-ment about an unknown parameter to the researcher.16
The two statistical hypotheses are: null and alternative hypotheses.16Nullhypothesisreferstotheabsenceofeffect
orassociation.1Alternative hypothesisstatesthatthereis
adifferencebetweenatleasttwopopulationsstudiedand whenpositivestatesthat thereisdifferencebetweenthe groupsanalyzed.16
Researchersmayhavetwoerrorswhentheyrelyonthese twohypothesestoformulateconclusions:typeIandtypeII errors.1TypeIerrorreferstoafalsepositiveresult;thatis,
rejectingthenullhypothesiswheninfactitistrue.1 Type
IIerrorreferstoafalsenegativeresult;thatis,accepting thenullhypothesis wheninfactitis false.1 The
probabil-ityofmakingatypeIerrorisknownaslevelofsignificance oralpha.1Theacceptablelevelofsignificancemostusedin
thehealthfieldis5%.1Statisticalhypothesistestscalculate
theprobabilityofaneventoccurringassumingthatthenull hypothesis istrue.17 This probabilityisknownasp-value.1
Ifthep-valueislessthanthelevelofsignificance,thenull hypothesismayberejectedandthealternativehypothesis thatsaysthereisa differenceor associationbetween the analyzed groupsmaybeaccepted.1 Thisreasoningapplies
tosuperiorityclinicaltrials.Themostcommonerroramong readersistobelievethatp-valuerepresentstheprobability that a nullhypothesis is true.17 Non-inferiorityor
equiva-lenceclinicaltrialsassesstheexact opposite,thelogic of interpretationisopposite,asnullhypothesisrepresentsthe differencebetweentheobservedvalues.
Kurichi et al.2 performed a research in 2006,
analyz-ingpublicationsinseveralscientificjournalsinthefieldof surgeryand demonstratedthatStudent’s tandchi-square tests were the most used for hypotheses. This finding is supportedbyotherresearchesinotherareasofmedicine.4---6
Student’s t-test is a parametric test which compares the mean of twosamples.18 The use of this test requires
some conditions18: sampled population must have
sym-metrical distribution, sample variances must be equal or approximate,andsamplesmustbeindependent.18Thistest
statisticsmaybeobtainedaccordingtothefollowingsteps: calculate the sample means and the respective standard deviations, find the difference between the two sample means,calculatethestandarderroranddividethevalueof thedifferencebetweenmeansbythestandarderrorvalue.19
Oncethet-valueisfound,atable ofcriticalvaluesofthe t-statistic must be consulted according to the degrees of
30
25
25 20
15
15 13 7
10
5
5 0
Absent
Number of cases
Variable levels
Mild Moderate Severe Unbearable
freedom appropriate toeach case.18 If the t-value found
isgreater thanorequal tothetabulated t-value,thenull hypothesis may be rejected.18 The statistical t-value can
alsobe convertedtop-value.19 Ifp-valueis less than the
levelofsignificanceadoptedforthestudy,thenull hypoth-esisshouldberejected.19
Medical research generally involves more than two groups. The Anova test isused tosimultaneously test the equalitybetweenmorethantwogroups.20TheAnovavarious
forms of testing are: one-way for an independent vari-able,two-wayfortwoindependentvariables,andrepeated measuresfor patientsservingastheirowncontrols.20 The
useofAnovarequiressomeconditions:sampleshouldhave symmetrical distribution, samples should be chosen ran-domly,andhomoscedasticityshouldbeevaluated.Variance represents the dispersion of data that will be analyzed. Homoscedasticityrepresentsthevariancehomogeneityand is apresupposition that mustbe observedtoperform the test.20
Chi-square testis anonparametric testusedtoanswer study questions involving rates, ratios, or frequencies.21
Itdoes not requiredatasymmetricaldistribution.21 There
aretwotests:chi-squareofindependenceandgoodnessof fit.21Theindependencetestisthemostcommonlyusedand
assessthefrequencyofdatafromtwoormoregroups.21The
goodnessoffittestisusedtocomparesampledatawithdata fromknownpopulations.21
Chi-square test statistics for two samples may be obtained according to the following steps: calculate the sampleproportions,findthedifferencebetweenthesetwo proportions,calculate the generalsample proportion that will be used in the standard error calculation, calculate the standard errorand dividethe value of thedifference betweentheproportionsbythestandarderrorvalue.19The
nullhypothesis mayberejectedifthep-valueisless than thesignificance leveladopted inthe studyor ifthevalue found is greater than or equal toa tabulated value asis occursint-test.19
Theuseofnon-parametricstatisticaltestshasincreased overtheyears.2 Astudyanalyzing publicationsinthefield
of surgeryfound thatin Archives of Surgerytherewasan increase from 0% in 1985 to 33% in 2003 and Annals of Surgeryfrom12% in1985to49%in 2003.2Non-parametric
methods are used for data with asymmetric distribution or from ordinal and nominal scales.21 The most common
andtheirindicationsare:chi-squareandFisher’sexacttest forproportionsorfrequencies;Mann---WhitneyU,Wilcoxon, Kruskal---Wallis and Friedman tests for ordinal data; and Kruskal---Wallisand Friedman for intergroup comparison.21
Datafromsmalltotalsamplesizemaybebetterevaluated withnon-parametrictests.1
The professionaltrainingof physicians generallyoffers a basic knowledge in statistics, but many are not apt to usethisknowledgeintheinterpretationofthedata.1The
decisionof which testtouse for eachparticular situation requires clarification of some points: data measurement scale;numberofgroups;relationshipbetweenparticipants, thatis,whetherthegroupsareindependentorrelatedand theresearcher’sintentiontoestablishadifferenceor rela-tionshipbetween groups.22 A hypotheticalexample would
betoevaluatecomplicationsinthepost-anesthetic recov-eryunit.Thefirststepistocounttheeventofinterestand
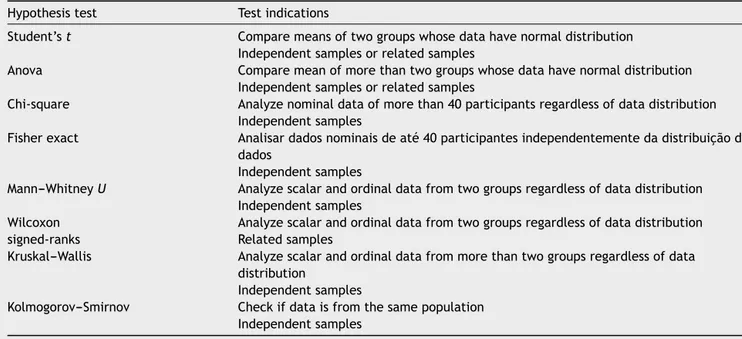
divideit bythe total numberof patients tofind the pro-portionand,bymultiplyingthatproportionby100,wehave thepercentage.Then,thegenderdifferencecanbeverified bythechi-squaretest,ortheamountofanestheticusedby each patient can be checked and the mean extracted. A generalguideforchoosingtestsisshowninTable4.
Howtocalculatethesamplesize
Statisticsareusedforcomparisonsbetweengroups andto makepredictionsforpopulationsusingthesampledata,asit isgenerallynotfeasibletoanalyzethedataofallmembers ofapopulation.1Thehypothesisisformulatedbyobserving
thepopulation testedinthesample. Anadequatenumber ofparticipants shouldbecalculated beforethestudy.23 If
thesamplesizeissmallerthannecessary,theactualeffect analyzedmaybeneglectedbytheresearcher,andifthissize istoolarge,resourceandanimalwastewilloccurifitisan experimentalresearch.23
Sample size calculation can be performed through computerapplications(apps). Therearesome freeonline appsthatusethestatisticalpowermethod.Someexamples
are: http://www.openepi.com/Menu/OEMenu.htm;
http://www.biomath.info/power/index.htm;
http://homepage.stat.uiowa.edu/∼rlenth/Power/#
Downloadtorunlocally; http://statpages.org;
http://biostat.mc.vanderbilt.edu/ twiki/bin/view/Main/PowerSampleSize;
http://tinyurl.com/timbocalculo.
Commonerrorsinanesthesia
Statisticalerror identificationwasinvestigatedinthe bib-liographic material of the Anesthetic Research Society.24
Thecategories pointedoutin thisresearchwere:method presentation or choice of statistical test, variability and probability.The most common errors were:no identifica-tionofinferentialstatisticstests,inadequatepresentation ofdatatoallowp-valueinterpretation,andinadequate pre-sentationofmeanstandarddeviation.
Commonerrors foundin anesthesiaare3:wrongchoice
ofahypothesistestthatdisregardsdatadistribution;wrong choice of a hypothesis test that disregards the clinical hypothesis,which leads totypeIerror duringanalyzes of significance;useofchi-squarewhentheexpectedfrequency ofacellis <5;useofchi-squarewithout Yates’correction insmallsample;useoft-testforpairedsamplesinunpaired samplesandpairsamplestoanalyzewitht-test.
Final
considerations
Proper use of basic statistics allows the clinician to feel moreconfidentwiththestudyresultsandthusimplantnew interventionsordrugsinclinicalpractice.
The main recommendations to minimize errors in sci-entific reports are7,8: describe the research hypothesis;
Table4 Generalguideforchoosingstatisticaltests.1,20,21
Hypothesistest Testindications
Student’st Comparemeansoftwogroupswhosedatahavenormaldistribution Independentsamplesorrelatedsamples
Anova Comparemeanofmorethantwogroupswhosedatahavenormaldistribution Independentsamplesorrelatedsamples
Chi-square Analyzenominaldataofmorethan40participantsregardlessofdatadistribution Independentsamples
Fisherexact Analisardadosnominaisdeaté40participantesindependentementedadistribuic¸ãodos dados
Independentsamples
Mann---WhitneyU Analyzescalarandordinaldatafromtwogroupsregardlessofdatadistribution Independentsamples
Wilcoxon signed-ranks
Analyzescalarandordinaldatafromtwogroupsregardlessofdatadistribution Relatedsamples
Kruskal---Wallis Analyzescalarandordinaldatafrommorethantwogroupsregardlessofdata distribution
Independentsamples
Kolmogorov---Smirnov Checkifdataisfromthesamepopulation Independentsamples
technique used; describe the adjustment methods used for multiple comparisons; describe howdiscrepant values weretreated; describe the level of significance;describe the parameters used to for sample size calculation so that calculations can be repeated; describe the software or statistical package usedin the analysis; use meanand standard deviation for data withnormal distribution; use median and interquartile range for asymmetrically dis-tributeddata;donotreplacestandarddeviationbystandard error.
The greatest errors in the interpretation of data from scientific studies are due to the inadequate use of the basic statistics addressed in this narrative review.Health professionals should be able to critically evaluate the resultsofstudiessothatinformationintheliteraturecan positivelyinfluence patientcare. Understandingthe valid-ity of the conclusions favors the findings applicability to patients.
Understandingtheproperuseofbasicstatisticsprovides lesserrorinreportingtheresultsofstudiesandinterpreting theirfindings.
Conflicts
of
interest
Theauthorsdeclarenoconflictsofinterest.
References
1.WindishDM,Diener-WestM.Aclinician-educator’sroadmapto choosingand interpretingstatisticaltests.JGenInternMed. 2006;21:656---60.
2.KurichiJE,SonnadSS.Statisticalmethodsinthesurgical liter-ature.JAmCollSurg.2006;202:476---84.
3.BajwaSJ.Basics,commonerrors,andessentialsofstatistical toolsandtechniquesinanesthesiologyresearch.JAnaesthesiol ClinPharmacol.2015;31:547---53.
4.Barbosa FT, Sousa DA. Frequency of the adequate use of statistical tests of hypothesis in original articles published in the Revista Brasileira de Anestesiologia between Jan-uary2008andDecember2009. RevBrasAnestesiol.2010;60: 528---36.
5.HokansonJA,LuttmanDJ,WeissGB.Frequencyanddiversityof useofstatisticaltechniquesinoncologyjournals.CancerTreat Rep.1986;70:589---94.
6.GoldinJ,ZhuW,SayreJW.Areviewofthestatisticalanalysis usedinpaperspublishedinClinicalRadiologyandBritishJournal ofRadiology.ClinRadiol.1996;51:47---50.
7.AltmanDG,GoreSM,GardnerMJ,etal.Statisticalguidelines forcontributors tomedical journals.Br MedJ(ClinResEd). 1983;7:286---93,1489.
8.BailarJC,MostellerF.Guidelinesforstatisticalreportingin arti-clesformedicaljournals.Amplificationsandexplanations.Ann InternMed.1988;108:266---73.
9.KimM.Statisticalmethodsinarthritis&rheumatism:current trends.ArthritisRheum.2006;54:3741---9.
10.McHughML.Descriptivestatistics.PartI:levelofmeasurement. JSpecPediatrNurs.2003;8:35---47.
11.Twycross A, Shields L. Statistics made simple. Part 2. Standarddeviation,varianceand range.PaediatrNurs.2004; 16:24.
12.McHugh ML. Descriptive statistics. Part II: most commonly used descriptive statistics. J Spec Pediatr Nurs. 2003;8: 111---6.
13.TwycrossA, ShieldsL. Statisticsmade simple.Part1:mean, medians,andmode.PaediatrNurs.2004;16:32.
14.Gaddis GM,Gaddis ML. Introduction to biostatistics.Part 2: descriptivestatistics.AnnEmerMed.1990;19:309---15.
15.CleggF.IntroductiontostatisticsI:descriptivestatistics.BrJ HospitalMed.1987;37:356---67.
16.GaddisGM,GaddisML.Introductiontobiostatistics.Part3, sen-sitivity,specificity,predictivevalue,andhypothesistesting.Ann EmergMed.1990;19:591---7.
18.GaddisGM,GaddisML.Introductiontobiostatistics.Part4: sta-tisticalinferencetechniquesinhypothesistesting.AnnEmerg Med.1990;19:820---5.
19.RumseyD.Testesdehipótesesmaisutilizados.In:RumseyD, editor.EstatísticaparaLeigos.RiodeJaneiro:AltaBooks;2010. p.237---47.
20.GaddisML. Statisticalmethodology: IV.Analysis of variance, analysisofcovariance,and multivariateanalysisofvariance. AcadEmergMed.1998;5:258---65.
21.Gaddis GM, Gaddis ML.Introduction to biostatistics. Part5: statisticalinferencetechniquesforhypothesistestingwith non-parametricdata.AnnEmergMed.1990;19:1054---9.
22.TwycrossA,ShieldsL.Statisticsmadesimple.Part4:choosing therighttest.PaediatrNurs.2004;16:24.
23.CharanJ,KanthariaND.Howtocalculatesamplesizeinanimal studies?JPharmacolPharmacother.2013;4:303---6.