Flávio Ricardo Guilherme
I, Carlos Alexandre Molena-Fernandes
II, Vânia Renata Guilherme
III,
Maria Teresa Martins Fávero
IV, Eliane Josefa Barbosa dos Reis
IV, Wilson Rinaldi
II Maringá State University, Physical Education Graduate Program. Maringá, Paraná, Brazil.
II Paraná State University, Paranavaí Campus, Nursing Graduate Program. Maringá, Paraná, Brazil.
III College of Ingá, Department of Medicine. Maringá, Paraná, Brazil.
IV Paraná State University, Paranavaí Campus, Department of Physical Education. Paranavaí, Paraná, Brazil.
How to cite this article:
Guilherme FR, Molena-Fernandes CA, Guilherme VR, Fávero MTM, Reis EJB, Rinaldi W. Body mass index, waist circumference, and arterial hypertension in students. Rev Bras Enferm. 2015;68(2):190-4.
DOI: http://dx.doi.org/10.1590/0034-7167.2015680205i
Submitted: 12-13-2014 Approved: 02-11-2015
ABSTRACT
Objective: to investigate what is the best anthropometric predictor of arterial hypertension among private school students. Method: this was a cross-sectional study with 286 students between the ages of 10 and 14 from two private schools in the city of Paranavaí, Paraná, Brazil. The following variables were analyzed: body mass index, waist circumference and blood pressure. Statistical analysis was conducted with Pearson’s partial correlation test and multivariate logistic regression, with p<0.05. Results: both anthropometric indicators displayed weak correlation with systolic and diastolic levels, with coeffi cients (r) ranging from 0.27 to 0.36 (p< 0.001). Multivariate analysis showed that the only anthropometric indicator associated with arterial hypertension was waist circumference (OR= 2.3; 95% CI: 1.1-4.5), regardless of age or gender. Conclusion: in this age group, waist circumference appeared to be a better predictor for arterial hypertension than body mass index.
Key words: Anthropometry; Arterial Pressure; Adolescent Health.
RESUMO
Objetivo: investigar qual o melhor preditor antropométrico de hipertensão arterial em alunos de escolas privadas. Método: estudo transversal, com amostra composta por 286 alunos com idade de 10 a 14 anos de duas escolas privadas de Paranavaí-Paraná. As variáveis analisadas foram: índice de massa corporal, circunferência de cintura e pressão arterial. Na análise estatística foram utilizados os testes de correlação parcial de Pearson e a regressão logística multivariada, considerando-se p<0,05. Resultados: os dois indicadores antropométricos demonstraram fracas correlações com os níveis sistólicos e diastólicos, com coefi cientes (r) variando de 0,27 à 0,36 (p< 0,001). Na análise multivariada, o único indicador antropométrico associado ao risco de hipertensão arterial foi a circunferência de cintura (OR= 2,3; IC 95%: 1,1-4,5) independente da idade e gênero. Conclusão: nesta faixa etária, a circunferência de cintura parece ser melhor do que índice de massa corporal como preditor de hipertensão arterial.
Descritores: Antropometria; Pressão Arterial; Saúde do Adolescente.
RESUMEN
Objetivo: investigar cuál es el mejor predictor antropométrico de la hipertensión arterial en los alumnos de escuelas particulares. Métodos: estudio transversal con muestra compuestas por 286 alumnos con edad de 10 a 14 años de dos escuelas privadas de Paranavaí-Paraná. Las variables analizadas fueron: índice de masa corporal, circunferencia de la cintura y la presión arterial
Body mass index, waist circumference,
and arterial hypertension in students
Flávio Ricardo Guilherme E-mail: [email protected] CORRESPONDING AUTHOR
INTRODUCTION
Obesity has become a great global health problem over the last decades. Recent data have demonstrated a substantial increase in overweight and obese children and adolescents in the last twenty years. Increased food consumption and lack of physical activity, factors associated with obesity, contribute to at least 300,000 deaths per year in the United States(1).
One of the main causes of death in the world among adults are cardiovascular diseases, usually progressive and with their roots in the early years of life. Childhood and adolescence are important phases in this process, as they are marked by bio-logical changes in the human body. Furthermore, adolescents begin to adopt patterns and independent behaviors which in-fluence the risks for such diseases(2).
Among the numerous diseases of this type, one of the most prevalent among the general population is systemic arterial hypertension, characterized by high and sustained levels of blood pressure. Moreover, hypertension is no longer exclusive to adults, as obese children and adolescents can potentially develop such altered hemodynamics(3).
It is known that alterations such as obesity and excessive central fat precede increased blood pressure in children and adolescents. For this reason, researchers have investigated the predictive capacity of anthropometric qualities, in the context of using simple, practical and low-cost methods, to assess risk factors for cardiovascular diseases among this age group(4).
Detecting risk indicators among the youth population is es-sential for monitoring individuals who present greater chances of developing altered blood pressure in adulthood(5).
OBJECTIVE
This study aimed to investigate what is the best anthro-pometric predictor for arterial hypertension among private school students in the city of Paranavaí, Paraná, Brazil.
METHOD
This was a cross-sectional study conducted between July and August 2013. The sample consisted of students between the 6th and 9th grades, aged 10 to 14, at two private schools in Paranavaí, Paraná, Brazil. The classes were selected through systematized random allocation in two steps: 1) by using the lottery method, one class from each year from both schools
were drawn; and 2) students from the selected classes were invited to participate and received an explanation on the na-ture of the study.
Sample size calculation was obtained by considering the total number of students in the studied population (n=417), an outcome prevalence of 50% (arterial hypertension) with a 95% confidence interval and 5% sampling error. Based on these parameters, we aimed to collect data from 200 students. Assessments were conducted only with students who agreed to participate in the study and who presented the Free and Informed Consent Form signed by their parents or legal guard-ians (n=298). Of these, 12 were excluded because: 1) they did not fall in the 10 to 14 age group; and 2) they did not participate in all the assessments. The final sample comprised 286 children and adolescents; 149 boys and 137 girls. The margin of sampling error calculated post hoc was 3.3% to 3.4%, a result below the level established a priori (5%).
The assessments were carried out during school hours by trained evaluators and with calibrated instruments. Height was measured using a wall stadiometer (Wisoâ, Brazil) with 0.1 cm resolution, and body mass with a digital scale (G-Tech) with 100-gram resolution and 150 kg maximum capacity. Participants wore only their school uniform, with or without objects in their pockets. Body mass index (kg/m2) was used to categorize the students as eutrophic or overweight(6). Data from students with low weight (0.3%; n =1) were included in the eutrophic category.
Waist circumference was measured using a flexible and non-elastic tape measure (Gullikâ, Brazil), with 0.1 cm reso-lution, applied immediately above the iliac crest. To classify abdominal obesity (central), we established P≥ 75° as the cutoff point for all ethnicities(7).
Blood pressure was measured according to the techniques recommended by the Brazilian Society of Cardiology(8), using a mercury sphygmomanometer (Wan Medâ, Brazil). Measure-ments were collected at three points, with a minimum two-minute interval between them. For data analysis we used the mean value of the two last measurements. Values of systolic or diastolic blood pressure equal to or greater than the 90º percen-tile or 120 mmHg and/or 80 mmHg were considered high(9).
For statistical analysis, the Kolmogorov-Smirnov test was used to identify the normality of the data and the existence of outliers was verified using box plots. Outliers were included in the analyses because they corresponded to data from over-weight students, which were of interest to this study.
sistólica y diastólica. En el análisis de estadísticas fueron utilizadas las pruebas de correlación parcial de pearson y regresión logística multivariada considerándose p<0.05. Resultados: los dos indicadores antropométricos han mostrado débiles correlaciones con los niveles sistólicos y diastólicos, con Coeficientes (r) variando de 0,27 a 0,36 (p<0,001). En el análisis multivariado el único indicador antropométrico asociado al riesgo de hipertensión arterial fue la circunferencia de la cintura (OR=2,3; IC 95%: 1,1- 4,5) independiente de la edad y el género. Conclusión: en este grupo de edad, la circunferencia de la cintura parece ser mejor de que el índice de masa corporal como predictor de la hipertensión arterial.
Student’s t-test was used to compare the anthropometric and hemodynamic characteristics between genders; Levene’s test was used to test for equality of variances between the in-vestigated groups.
Pearson’s test for partial correlations was used to analyze the relation between body mass index (BMI) and waist circum-ference (WC), and of both measures with regards to systolic blood pressure (SBP) and diastolic blood pressure (DBP), ad-justed for gender and age.
Exploratory data analysis demonstrated a non-linear re-lationship between x and y, from a determined point of its distribution, demonstrating a logistic S-curve. Thus, bino-mial multivariate regression was conducted to determine the odds ratio (OR) and the respective confidence intervals (95%) used to analyze the independent association between arterial hypertension (dependent variable) and BMI and WC (independent variables). All the studied variables were cat-egorized, and inclusion criterion of the independent vari-ables in the multivariate models was an association level of p ≤ 0.20 with the dependent variable, according to the chi-square test.
Analyses were conducted using the Statistical Package for the Social Sciences (SPSS) software, version 20.0, with p<0.05. The research proposal was approved by the research ethics committee of Maringá State University, under resolu-tion number 353.552 and in accordance with the Declararesolu-tion of Helsinki.
RESULTS
The mean values for BMI, height and WC were higher among boys than in girls (p≤0.05). In terms of age, mean BMI, SBP and DBP values were equal between the two groups (Table 1).
Table 1 - Age and anthropometric characteristics of private school students in Paranavaí, Paraná, Brazil, 2013
Mean ± SD
Variables Male (n=149) Female (n=137) p-value
Age (years) 12.3 ± 1.23 12.0 ± 1.14 0.245
Mass (kg) 53.0 ± 11.70 48.4 ± 11.84 0.031*
Height (cm) 1.58 ± 0.10 1.54 ± 0.08 0.043*
BMI (kg/m2) 21.23 ± 3.61 20.3 ± 3.86 0.296
WC (cm) 75.3 ± 10.92 69.6 ± 9.51 0.004*
SBP (mmHg) 110.9 ± 17.4 108.4 ± 14.6 0.581
DBP (mmHg) 64.2 ± 8.47 61.0 ± 8.43 0.728
SD, standard deviation; BMI, body mass index, WC, waist circumference; SBP, systolic blood pressure; DBP, diastolic blood pressure. *Significant values for p≤0.05.
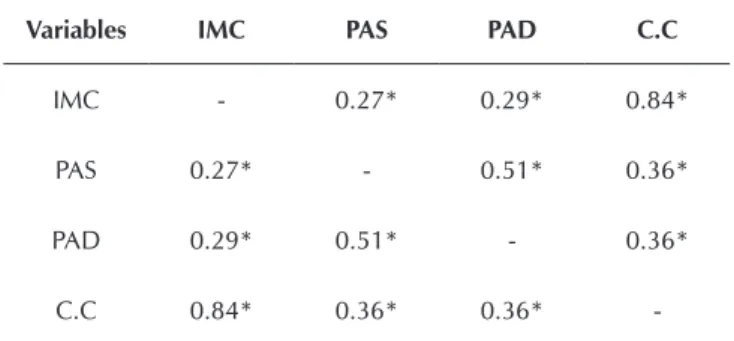
Table 2 - Pearson’s partial correlation (r) for the studied vari-ables adjusted for age and gender among private school students in Paranavaí, Paraná, Brazil, 2013
Variables IMC PAS PAD C.C
IMC - 0.27* 0.29* 0.84*
PAS 0.27* - 0.51* 0.36*
PAD 0.29* 0.51* - 0.36*
C.C 0.84* 0.36* 0.36*
-BMI, body mass index; SBP, systolic blood pressure; DBP, diastolic blood pres-sure; WC, waist circumference.
*Significant correlations at p≤ 0.001.
Table 3 - Odds Ratio for risk of high blood pressure adjusted for age and gender among private school students in Paranavaí, Paraná, Brazil, 2013
Variables Adjusted odds ratio (95% CI)
Gender Male 1
Female 1.1 (0.6 - 2.0)
Age 10 years 1
11 years 0.7 (0.2 - 1.9) 12 years 1.1 (0.4 - 3.2) 13 years 1.8 (0.7 - 5.0) 14 years 1.5 (0.5 - 4.4)
BMI Eutrophic 1
Overweight 1.8 (0.9 - 3.6)
WC < 75° 1
≥ 75° 2.3 (1.1 - 4.5)* BMI, body mass index; WC, waist circumference; CI, confidence interval. *Significant association at p≤ 0.05.
Table 2 presents an analysis of the relationship among the studied variables and shows that the anthropometric measure-ments presented weak correlations with SBP and DBP, with coefficients ranging between 0.27 and 0.36. However, two anthropometric indicators (BMI and WC) presented strong correlation (r=0.84 p<0.001), indicating collinearity be-tween them.
(130% greater chance) to present high blood pressure (95% CI: 1.1-4.5), when compared to those with adequate measure-ments. Gender, age and BMI were not associated with risk for high blood pressure (Table 3).
DISCUSSION
The frequency of high blood pressure among children and adolescents has increased worldwide(5). In particular, over-weight individuals have presented higher proportions of hy-pertensive measurements and cardiovascular risks(10-11).
Studies have attempted to identify the best anthropometric indicator for high blood pressure among children and adoles-cents, but the results have been conflicting(1,4,12–14). The pres-ent study aimed to highlight such divergences, analyzing the relationship between blood pressure with two anthropometric indicators of obesity (BMI and WC), which are easy to use among this population.
The results showed weak correlations between both an-thropometric parameters and SBP and DBP, a finding that cor-roborates those of previous studies(4,9). The magnitude of these correlations may have been compromised due to the multifac-torial characteristic of high blood pressure, influenced by en-vironmental factors or by the logistic behavior of the data. It is worth noting that blood pressure measurements were taken at only one point (during school hours), representing a possible classification bias and a limitation of this study.
Another important finding was the positive association of waist circumference as an anthropometric indicator inde-pendently associated with arterial hypertension. The students classified with central obesity (P≥75°) were 130% more like-ly (OR=2.3) to have high blood pressure in comparison with students who were not diagnosed with abdominal obesity.
Some studies have pointed to obesity as a risk factor for in-creased blood pressure in children and adolescents, however, the best anthropometric parameter is still contradictory; some studies showed WC as the best predictor(5,15), while others in-dicated BMI as having a higher association among this age group(13,16). In the present research, there was a strong correla-tion between BMI and WC (r=0.84; p<0.001). This finding could explain the existing conflict in the literature, as among this population, it is possible that high BMI values are directly related to excess body fat. This is because the lean-fat propor-tion among this age group is not very expressive, especially
among prepubescents and pubescents. An analysis of the stu-dents’ sexual maturation could have provided more details on the issue, but due to bureaucratic problems and school proce-dures, we were not able to conduct such an analysis.
The use of Brazilian criteria and cutoff points to classify BMI(6) conferred greater reliability to analyses of this variable in this study, as they were more precise in determining high blood pressure among boys and girls aged 10 to 17 in com-parison to international references(17).
Notwithstanding, the lack of regression-based association between high blood pressure and BMI in the present study does not dismiss its importance in predicting arterial hyper-tension among children and adolescents, as it was correlated with systolic and diastolic levels. This finding suggests that it is a potential indicator of arterial hypertension. A possible explanation for such lack of association may be the period in which the students were exposed to excess weight, which was not enough to provoke hemodynamic alterations.
On the other hand, the association found between blood pressure and waist circumference may have been negatively influenced, distorting the estimates of the risk for high blood pressure, due to the use of international criteria. Such criteria are not sensitive and specific enough to identify high blood pressure among Brazilian children and adolescents due to the strong miscegenation of this population, which requires spe-cific critical values(18). In this sense, Brazilian cutoff points for this age group must be validated in order to confer greater reliability to studies with students.
CONCLUSIONS
Conducting appropriate routine blood pressure measure-ments at school is hindered by lack of adequate equipment and, in particular, lack of trained evaluators to perform the technique. Anthropometric indicators are simple and yet liable options for hypertension risk stratification. In this re-search, waist circumference was the best predictor for high blood pressure among the students, regardless of BMI, gender and age. However, further studies with this population that in-clude stages of puberty must be conducted, as different matu-ration classifications can interfere in data interpretation.
REFERENCES
1. Basiratnia M, Derakhshan D, Ajdari S, Saki F. Prevalence of childhood obesity and hypertension in south of Iran. Iran J Kidney Dis [Internet]. 2013 Jul [cited 2014 Jan 01];7(4):282-9. Available from: http://www.ncbi.nlm.nih. gov/pubmed/23880805
2. Tsioufis C, Kyvelou S, Tsiachris D, Tolis P, Hararis G, Koufakis N, et al. Relation between physical activity and blood pressure levels in young Greek adolescents:
the Leontio Lyceum Study. Eur J Public Health [Internet]. 2011 Feb [cited 2014 Jan 01];21(1):63-8. Available from: http://www.ncbi.nlm.nih.gov/pubmed/20142399 DOI: 10.1093/eurpub/ckq006
2014 Jan 01];58(6):666-72. Available from: http://www. ncbi.nlm.nih.gov/pubmed/23250094
4. Moser DC, Giuliano ICB, Titski ACK, Gaya AR, Coelho Silva MJ, Leite N. Anthropometric measures and blood pressure. J Pediatr (Rio J) [Internet]. 2013 May-Jun [cited 2014 Jan 01];89(3):243-9. Available from: http://www.ncbi.nlm.nih. gov/pubmed/23684458 DOI: 10.1016 / j.jped.2012.11.006 5. Araújo TL, Lopes MVO, Cavalcante TF, Guedes NG,
Moreira RP, Chaves ES, et al. [Analysis of risk indicators for the arterial hypertension in children and teenagers]. Rev Esc Enferm USP [Internet]. 2008 Mar [cited 2014 Jan 01];42(1):120-6. Available from: http://www.ncbi.nlm. nih.gov/pubmed/18450156 Portuguese.
6. Conde WL, Monteiro CA. Body mass index cutoff points for evaluation of nutritional status in Brazilian children and adolescents. J Pediatr (Rio J) [Internet]. 2006 Jul-Aug [cited 2014 Jan 01];82(4):266-72. Available from: http:// www.ncbi.nlm.nih.gov/pubmed/16858504
7. Fernández JR, Redden DT, Pietrobelli A, Allison DB. Waist circumference percentiles in nationally representative sam-ples of African-American, European-American, and Mexi-can-American children and adolescents. J Pediatr [Internet]. 2004 Oct [cited 2014 Jan 01];145(4):439-44. Available from: http://www.ncbi.nlm.nih.gov/pubmed/15480363 8. Sociedade Brasileira de Cardiologia-SBC; Sociedade
Brasileira de Hipertensão-SBH; Sociedade Brasileira de Nefrologia-SBN. [V Brazilian Guidelines in Arterial Hy-pertension]. Arq Bras Cardiol [Internet]. 2007 Sep [cited 2014 Jan 01];89(3):e24-79. Available from: http://www. ncbi.nlm.nih.gov/pubmed/17906811 Portuguese. 9. National High Blood Pressure Education Program
Work-ing Group on High Blood Pressure in Children and Ado-lescents. The fourth report on the diagnosis, evaluation, and treatment of high blood pressure in children and ado-lescents. Pediatrics [Internet]. 2004 Aug [cited 2014 Jan 01];114(2 Suppl 4th Rep):555-76. Available from: http:// www.ncbi.nlm.nih.gov/pubmed/15286277
10. Carneiro G, Faria AN, Ribeiro Filho FF, Guimarães A, Lerário D, Ferreira SR, et al. [Influence of body fat dis-tribution on the prevalence of arterial hypertension and other cardiovascular risk factors in obese patients]. Rev Assoc Med Bras [Internet]. 2003 Jul-Sep [cited 2014 Jan 01];49(3):306-11. Available from: http://www.ncbi.nlm. nih.gov/pubmed/14666357 Portuguese.
11. Kleiser C, Schienkiewitz A, Schaffrath Rosario A, Prinz-Langenohl R, Scheidt-Nave C, Mensink GBM. Indicators of overweight and cardiovascular disease risk factors among 11- to
17-year-old boys and girls in Germany. Obes Facts [Internet]. 2011 [cited 2014 Jan 01];4(5):379-85. Available from: http:// www.ncbi.nlm.nih.gov/pubmed/22166758 DOI: 10.1159/ 000333428
12. Freedman DS, Katzmarzyk PT, Dietz WH, Srinivasan SR, Berenson GS. Relation of body mass index and skinfold thicknesses to cardiovascular disease risk factors in chil-dren : the Bogalusa Heart Study. Am J Clin Nutr [Internet]. 2009 Jul [cited 2014 Jan 01];90(1):210-6. Available from: http://www.ncbi.nlm.nih.gov/pubmed/19420092 DOI: 10.3945/ajcn.2009.27525
13. Queiroz VM, Moreira PVL, Vasconcelos THC, Vianna RPT. Prevalence and anthropometric predictors of high blood pressure in schoolchildren from João Pessoa - PB, Brazil. Arq Bras Cardiol [Internet]. 2010 [cited 2014 Jan 01];95(5):629-34. Available from: http://www.scielo.br/ pdf/abc/v95n5/en_v95n5a11.pdf
14. González Jiménez E, Aquilar Cordeiro MJ, García García CJ, García López PA, Álvarez Ferré J, Padilha López CA. [Prevalence of nutritional overweight and obesity and hy-pertension as well as their relationship with anthropometric indicators in a population of students in Granada and its provinces]. Nutr Hosp [Internet]. 2011 Sep-Oct [cited 2014 Jan 01];26(5):1004-10. Available from: http://www.ncbi. nlm.nih.gov/pubmed/22072345 Spanish. DOI: 10.1590/ S0212-16112011000500013
15. Chuang SY, Pan WH. Predictability and implications of anthropometric indices for metabolic abnormalities in children: nutrition and health survey in Taiwan elemen-tary children, 2001-2002. Asia Pac J Clin Nutr [Internet]. 2009 [cited 2014 Jan 01];18(2):272-9. Available from: http://www.ncbi.nlm.nih.gov/pubmed/19713188
16. Kuschnir MCC, Mendonça GA. Risk factors associated with arterial hypertension in adolescents. J Pediatr (Rio J) [Inter-net]. 2007 Jul-Aug [cited 2014 Jan 01];83(4):335-42. Avail-able from: http://www.ncbi.nlm.nih.gov/pubmed/17627321 17. Christofaro DGD, Fernandes RA, Polito MD, Romanzini
M, Ronque ERV, Gobbo LA, et al. A comparison between overweight cutoff points for detection of high blood pres-sure in adolescents. J Pediatr (Rio J) [Internet]. 2009 [cited 2014 Jan 01];85(4):353-8. Available from: http://www.sci elo.br/pdf/jped/v85n4/en_v85n4a14.pdf