O
ri
gi
na
l
a
rt
ic
le
s
Anthropometric, functional and foot trajectory determinants
of stride length in self-reliant community-dwelling elderly persons
in Talca, Chile
Paul Medina González1
1 Universidad Católica del Maule, Facultad de Ciencias de la Salud, Departamento de Kinesiología. Talca, Chile.
Correspondence Paul Medina González E-mail: [email protected]
Abstract
Objective: To analyze anthropometric, muscle performance and foot trajectory determinants
of stride length (SL) during walking at a comfortable pace among self-reliant community-dwelling elderly persons in Talca, Chile. Method: A total of 63 self-reliant elderly persons participated in this observational and cross-sectional study. They were characterized by the anthropometric measures of mass, height and body mass index. Dorsiflexor muscle strength performance (DF-MS) and rate of force development were quantified. Finally, the elderly persons were asked to walk comfortably around a 40 meter elliptical circuit, using determined SL and maximum foot clearance (MaxFC) and minimum foot clearance (MFC) trajectory parameters. The SL determinants were evaluated by calculating the coefficient of determination (r2) considering a level of significance of p≤0.05. Results:
The anthropometric variables demonstrated significant correlations (r>0.41) with the explanation of SL remaining incipient (r2<0.20). Muscle performance, meanwhile, was
significantly correlated (r>0.52), with DF-MS standing out (r2=0.342). MaxFC represented
a significant explanation for the data (r2=0.396), while the low correlation of MFC was
not significant (r=0.24, r2=0.058). Conclusion: MaxFC and DF-MS are determinants of SL
in self-reliant elderly Chileans. It is proposed that gait parameters could be normalized in accordance with trajectory and muscular performance.
INTRODUCTION
The demographic changes experienced by Latin American countries has led to a systematic increase in the number of people aged 60 years or more.1 Aging is an extremely complex
process of progressive, natural and irreversible changes,2 which lead to impairments in functional
capabilities and emotional, cognitive and physical performance, all of which affect the performance of basic, instrumental and advanced activities of daily living.
The ability to walk independently has been defined as a motor skills milestone in the human life cycle. This ability is acquired in the first year of life and matures during childhood to become a fundamental element of adult functioning.3
Notwithstanding the foregoing, the aging process involves multi-factorial risks that, together with the expression of morbidities, lead to alterations in spatio-temporal gait parameters, affecting balance and stability.4 Therefore, the specific and timely
measurement of these risks has become more and more important in professional and disciplinary practice.
Gait assessments tend to be generic in nature, mostly based on the measurement of parameters that depend on time and space. Researchers have analyzed indicators related to the distance covered during the six-minute walk test,5 physiological effort6 and speed in both comfortable and
maximum demand conditions.7
Besides speed, the most robust biomechanical gait indicator is stride length (SL), due to the relevance of what its complete cycle represents in spatial terms,8 as well as the fact that it measures mechanical and physiological efficiency.9 In
this sense, it is conditioned by pre-established anthropometric characteristics10 and specific
functions.4,11 It remains unknown which of these
determinant variables has the most significant impact on the spatial expression of the gait cycle.
This data could be useful for functional diagnoses, specific interventions and disciplinary strategies aimed at community-dwelling, elderly individuals.
Therefore, the aim of the present study was to assess anthropometric, muscle performance and foot trajectory determinants of stride length (SL) during walking at a comfortable pace among self-reliant community-dwelling elderly persons in Talca, Chile.
METHODS
Participants
This observational and cross-sectional investigation contained a non-probabilistic, convenience sample of 63 elderly individuals (age
70 ± 5 years) who were members of a number of
social clubs in the community of Talca, Chile. After formal contact was made, measurements of the main variables were taken in offices of the Universidad Católica del Maule (Maule Catholic University) (UCM) in January and February of 2014 (morning appointments). All of the participants signed a free and informed consent form that was approved by the Scientific Ethics Committee of the UCM (project 2012-2014, follow-up report no. 2/2014). The inclusion criteria were controlled by the application of the Examination of Preventive Medicine for the Elderly (EMPAM),12 while
self-reliance was confirmed using the Functional Assessment for the Elderly-Chile, part A (EFAM-Chile). Normal cognition was assessed using the
abbreviated mini-mental test (≥13 points)12 and
the absence of depression was confirmed by the
Yesavage scale (<5 points).12 The following subjects
were excluded from this research: individuals with chronic wasting diseases; individuals who were at risk of falls, based on positive results in the timed up and go and leg balance tests;12 individuals
Measurements
Anthropometry
A basic anthropometric characterization involves measuring the body mass and height
(DETECTO stadimeter, model 2392) of barefoot participants, who maintain the lower edge of the orbit on the same plane as the external auditory canal (Frankfurt plane).13 Nutritional status was
established using the body mass index (BMI) and the corresponding specific categorization for elderly Chilean individuals: emaciated (BMI<23 Kg/m2); normal (BMI between 23.1 Kg/m2 and
27.9 Kg/m2); overweight (BMI between 28 Kg/m2
and 31.9 Kg/m2) and obese (BMI>32 Kg/m2).12
Dorsiflexor muscle strength (DF-MS)
Measurements of the muscle strength of the dominant dorsiflexor (DF-MS) were taken with the participant in the supine decubitus position, with the ankle joint in a free position. A strap was tightened according to the tolerance of the individual and the relevant segment of the dominant leg (unilateral) was measured to avoid compensation during the performance. The participant was informed about the specificities of the test in advance. They were then asked to perform a sub-maximal contraction, to ensure they had understood the procedure. Subsequently, their maximum strength was measured using the
“make test”,14 which translates strength through
a dynamometer (Lafayette Manual Muscle Test System, model 01165) and provides results in kilograms-strength. The time required to obtain this value was also monitored, and labelled the rate of force development (RDF-DF; Kg/s). Three consistent measurements were taken (<10% variability), with one minute rest periods between each. The maximum performance value was used in the analysis.
Kinematic analysis
The participants were asked to walk at a comfortable pace for three minutes on an elliptical 40-meter circuit. A Sony Handycam camera
(model HDR-XR550) was strategically placed in a
“recording” zone, at a distance of four meters. This camera provided a video of each stride (total of five) executed by the participant. When the test had been completed, the recordings were saved on a portable computer (Toshiba, model NB505-SP0115LL) for the subsequent transformation into analysis frames (30 images per second) using capture software (free video to jpg converter version 5.0.22, 2013, available at: http://free-video-to-jpg-converter. softonic.com). Simple kinematic analysis was conducted using a free access program.15
In the context of two-dimensional analysis of foot trajectory, clearance is understood to be the height in millimeters (mm) between the anterior inferior segment of the foot and the x-axis of the coordinates.15 Thus, maximum foot clearance (MaxFC) is assessed in the initial swing phase of gait and represents the furthest value from the ground during this stage.11,15,16 Minimum foot clearance (MFC) is the minimum height (in mm) between the anterior inferior segment of the foot and the x-axis of the coordinates, which generally occurs during the advanced swing phase.11,15-17
Stride length (SL) is understood to be the distance in millimeters that a subject requires to complete a full gait cycle, which is based on the anterior inferior apex of the marker at the beginning and end of a stride.8,15
Statistical analysis
anthropometric determinants (muscle strength and foot trajectory). The variability in SL was determined by the coefficient of determination (r2), with the
level of statistical significance set at p≤0.05.
Both the descriptive and inferential statistics
were analyzed using SPSS version 18.0. Graphical
statistics were completed using GraphPad Prism version 5.0.
RESULTS
Table 1 contains the general characteristics of the participants, with a marked predominance of females (74.6%). The majority of the participants
were aged between 65-75 years. The specific
nutritional status of the participants was at the lower limit of the overweight category.
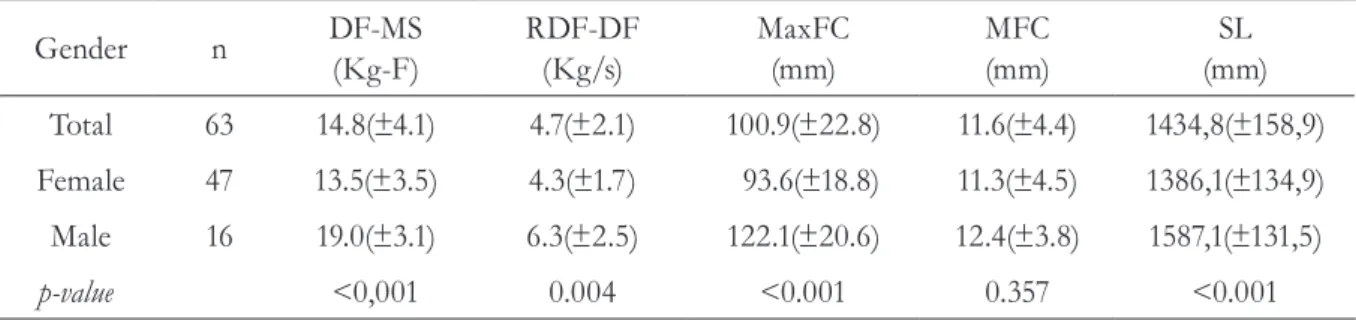
Table 2 displays the muscle performance of the ankle and the kinematics of the foot. The DF-MS
was approximately 15 Kg in the general sample and
was slightly higher among the male participants (p<0.001). The rate of force development for the dorsiflexors (RDF-DF) was approximately
5 Kg/s, with a 2kg/s higher rate among the
male participants (p=0.004). With respect to the kinematics of comfortable walking, the MaxFC
value in the early swing stage was approximately 101 mm for the total of all subjects, although it was significantly higher among the men (p<0.001). However, during the advanced swing stage, the MFC was similar for both genders, with values of approximately 12 mm (p=0.357). Stride length was
approximately 1500 mm and was longer among
the men (p<0.001).
Table 1. Demographic, anthropometric and functional characteristics of the elderly participants. Talca, Maule Region, Chile, 2014
Gender n Age
(years)
Mass (Kg)
Height (m)
BMI (Kg/m2)
EFAM-A (Score)
Total 63 69.56(±5.41) 73.54(±12.12) 1.55(±0.08) 30.50(±4.32) 50.43(±2.97)
Female 47 69.17(±4.94) 71.44(±11.35) 1.52(±0.05) 30.85(±4.43) 50.14(±3.08)
Male 16 70.88(±6.79) 80.72(±12.23) 1.66(±0.06) 29.30(±3.48) 51.41(±2.37)
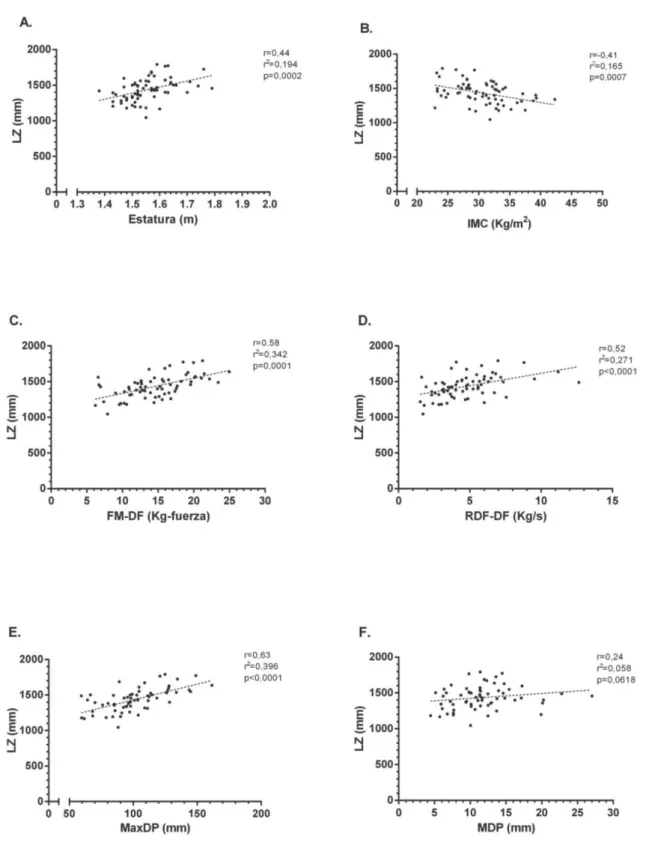
Figure 1 contains a graphic representation of the correlations between each of the SL determinants. The anthropometric variables exhibited significant correlations (Figures 1A and 1B). However, the explanation for the variability of SL was incipient. Muscle performance exhibited significant correlations (Figures 1C and 1D), particularly with the coefficient of determination for
DF-MS. The foot trajectory indicators were unequal: they were very high, significant and explained approximately 40% of the data for MaxFC (Figure 1E). Conversely, MFC exhibited a non-significant, low correlation (Figure 1F).
Table 2. Muscle strength and kinematic values for the elderly participants.Talca, Maule Region, Chile, 2014
Gender n DF-MS
(Kg-F)
RDF-DF (Kg/s)
MaxFC (mm)
MFC (mm)
SL (mm)
Total 63 14.8(±4.1) 4.7(±2.1) 100.9(±22.8) 11.6(±4.4) 1434,8(±158,9)
Female 47 13.5(±3.5) 4.3(±1.7) 93.6(±18.8) 11.3(±4.5) 1386,1(±134,9)
Male 16 19.0(±3.1) 6.3(±2.5) 122.1(±20.6) 12.4(±3.8) 1587,1(±131,5)
p-value <0,001 0.004 <0.001 0.357 <0.001
A. height; B. BMI=body mass index; C. DF-MS= dorsiflexor muscle strength; D. RDF-DF=rate of force development for dorsiflexors; E.
MaxFC=maximum foot clearance; F. MFC=minimum foot clearance;r= correlation index; r2= coefficient of determination; p= value of
statistical significance.
DISCUSSION
SL is considered an important kinematic parameter of gait, due to the fact that is a general translator of all events that occur during its complete cycle, including the support and swing phases.9 The elderly population is vulnerable to
tripping/stumbling problems,18 which can lead to falls and morbidities that negatively affect their functionality. Therefore, the opportune measurement of this variable is essential, as is the determination of the nature of indicators that can condition this variable, in order to propose safe and effective interventions for this section of the population. The most significant finding of the present study was the fact that the variables that most commonly explained the variability of SL were MaxFC and DF-MS, which are chronologically-ordered conditioners of performance in the swing phase.9,16
An analysis of SL in literature provided results consistent with those of the present study. Karst et al.17 recorded spatial gait data for 16 elderly
women using several different methodologies, with SL values of 1330±140 mm for natural cadence. These values are similar to those found in the present study (Table 2). A study of elderly men19
reported SL results of 1530±120 mm on a hard
surface, which are also similar to the results of this experiment (Table 2). The normative values for the spatial and temporal qualities of gait in the elderly have also been previously documented: Hollman et al.8 recorded a SL of 1370±120 mm for men and
1180±150 mm for women.
While it is clear that controlled laboratory conditions are preferable for the performance of gait and the validity of the data produced, they can have a negative effect on the expression of comfortable and spontaneous gait when tracks that are shorter than five meters are used. This distance is not long enough to determine the expression of gait in natural conditions.20 It has
also been reported that the minimum time required by elderly individuals to achieve a steady pace is three minutes.6 Therefore, extrapolation to
situations of functional expression should consider
neuromuscular, mechanical and physiological (adaptation) factors.
There is evidence that anthropometric indicators such as mass, height and BMI affect SL.10 It has
been recommended that the values obtained using these parameters should be corrected in order to ensure pertinent comparisons for both kinematic indicators and muscle performance.9
Although the values obtained for height and the BMI in the present study produced moderate and significant correlations (Figures 1A and 1B), they also exhibited a low explanation value for SL (coefficient of determination: r2<0.20). This
low statistical weight could be fundamentally explained by morphological factors, given that all of the subjects assessed were classified as being of normal weight or overweight (Table 1). Ko et al.10 (2010) presented the results of a study
in Baltimore, demonstrating that kinematic gait patterns in the elderly were significantly affected by obesity. These factors need to be studied among elderly individuals with a greater morphological variability.
To date, the specific association between morphological variables and SL is unknown. The present study is therefore a pioneer study in terms of the exploration of this behavior among a group of self-reliant elderly Chilean individuals.
The f indings reported herein for the performance of the dorsiflexor muscles of the ankle (Table 2) are similar to those reported in previous studies.21 The impact that this behavior
would have on SL produced a significant and direct correlation, as well as a considerable explanation for the DF-MS (Figure 1C) and RDF-DF (Figure 1D) data. Thus, it is suggested that muscle integrity predominantly conditions the balance and stability of gait.22,23 Consequently, it would
have a considerable impact on SL, despite the fact that this relationship is non-linear,24 which
indicates a relative dependence on the magnitude of gait speed.25,26 Cress & Meyer27 assessed the
elderly individuals, reporting linear functionality thresholds. Thus, future studies should analyze these critical change points in order to establish how the magnitude of the result of this variable dynamically determines the SL as an indicator of gait functionality.
The dorsiflexor muscles of the ankle are mainly active during the late swing phase of gait, avoiding contact between the anterior section of the foot and the ground.11 The results of the present study
highlight the importance of this variable during the execution of comfortable walking by elderly individuals. It has been reported that both the aging process18,21 and the expression of peripheral fatigue, caused by morbidities such as chronic obstructive pulmonary disease,28 would negatively affect performance, leading to a less effective gait and the consequent occurrence of trips/stumbles, which may eventually cause falls.
The foot trajectory results reported herein expressed an unequal impact on the magnitude of SL. The MaxFC had a high and significant correlation with SL, explaining approximately 40% of the results (Figure 1E). These findings demonstrate the importance of this phase of gait performance to self-reliant elderly individuals: this was the main determinant found in the present study. The reason for this phenomenon could be linked to the accumulation of mechanical and elastic potential energy9 in the beginning of the
swing phase on behalf of the ankle plantar flexors, which would provide enough momentum for the subsequent foot trajectory. This phenomenon should be analyzed in more detail, considering two guidelines: a) the combined measurement of the muscle performance of the ankle plantar flexors26,29
and; b) the inclusion of elderly individuals with different levels of functionality, in order to determine if this significance is maintained during different strategies of comfortable gait, including those that exhibit a significant decrease during the swing phase.
The MFC exhibited a low and non-significant correlation, as well as the most incipient explanation of data, for all of the determinants selected, with
values of less than 6% (Figure 1F). This could be explained by the low relative importance of this phase among elderly individuals who do not suffer from any functional complications (the inclusion criteria of the present study specified that the participants must not have a history of falls or trips), in order to ensure that the kinetic and kinematic analysis would not be affected.29-31
Conversely, in terms of the measurement methodology, this variable was the most complex, due to the speed of the image capture technique (three times that of the mass center),16 which
led to a high rate of dispersion in relation to the magnitude of the result (Table 2). Therefore, future studies should seek to optimize the image capture technique in order to ensure greater precision in the analysis, while also assessing this parameter by considering the different functional, demographic and anthropometric characteristics of the elderly population.
Considering the normalization of reference data for a functional diagnosis, the present study provides evidence of the specification of gait analysis among the elderly. Upon confirmation of the significant explanation of the variability of SL based on muscle performance indicators (Figures 1C and 1D) and MaxFC (Figure 1E), together with the importance of assessing the duality between movement and the environment,32 specifically in
relation to the irregular pavements found in urban contexts,33 these results could be useful in the early
recognition of eventual complications associated with the risks of trips/stumbles and falls in elderly individuals who do not exhibit a risk according to the conventional instruments established in public health policies.12 Furthermore, knowledge
of muscle performance and critical trajectory scores could guide therapeutic decisions, considering specific minimum and maximum overload values for each individual and their interaction with the environment (time and space), through the incorporation of ecological training as a preventive intervention.34
Conversely, Russel et al.36 demonstrated that the
physiological cost is higher among obese women with osteoarthritis who had to reduce their SL
by 15% while walking. These results should lead
to the performance of new studies that consider complementary assessments of antagonist muscle groups, such as the ankle plantar flexors, while also analyzing fatigue tolerance as a dimension of muscle performance. We also recommend the incorporation of spatial and temporal kinematic analysis in order to determine angular positions and trajectory values over time, which may be critical during gait. The following factors should also be considered when assessing gait performance: the cost of transport; perceptions of fatigue and pain; the environment (homogenous and irregular surfaces).
The main limitation of the present study was the homogeneity of the sample: since the participants all belonged to a focal group, it was highly selected, which had a negative effect on the external validity of the investigation. A significant section of the
correlations were found between a general gait indicator (SL) and the kinematic manifestation of a muscle group in the dominant segment, thereby impeding the complete extrapolation of the results obtained. We suggest that future studies should incorporate these determinants as complementary variables in population studies that consider a larger number of subjects from different focal groups (different geographic locations and socio-economic levels).
CONCLUSION
The results of the present study established that the determinants of stride length among self-reliant, community-dwelling, elderly individuals in Talca-Chile were maximum foot clearance and dorsiflexor muscle strength. These findings support the proposal of supplementing the conventional use of anthropometric variables with the normalization of kinematic gait data, including strength and trajectory parameters.
REFERENCES
1. Chackiel J. La dinámica demográfica de América Latina [Internet]. Santiago de Chile: Comisión Económica para América Latina y el Caribe; 2004 [acesso em 20 ene. 2014]. (Serie población y desarrollo
; nº 52). Disponível em: http://www.eclac.cl/cgibin/ getProd.asp?xml=/publicaciones/xml/0/14860/ P14860.xml&xsl=/celade/tpl/p9f.xsl&base=/celade/
tpl/top-bottom.xsl
2. Weinert BT, Timiras PS. Invited review: theories of
aging. J Appl Physiol 2003;95(4):1706-16.
3. González PM, Solorza EM. Evolución de la
locomoción bípeda humana: el nivel socioeconómico
como factor ambiental. Antropo 2014;31:15-24.
4. Salzman B. Gait and balance disorders in older adults.
Am Fam Physician 2010;82(1):61-8.
5. Troosters T, Gosselink R, Decramer M. Six-minute walking distance in healthy elderly subjects. Eur Respir J 1999;14(2):270-4.
6. Malatesta D, Simar D, Dauvilliers Y, Candau R, Borrani F, Prefaut C, et al. Energy cost of walking
and gait instability in healthy 65- and 80-yr-olds. J Appl Physiol 2003;95(6):2248-56.
7. Bohannon RW. Comfortable and maximum walking speed of adults aged 20-79 years: reference values and
determinants. Age Ageing 1997;26(1):15-9. 8. Hollman J, McDade E, Petersen R. Normative
spatiotemporal gait parameters in older adults. Gait
Posture 2011;34(1):111-8.
9. Saibene F, Minetti AE. Biomechanical and physiological aspects of legged locomotion in
humans. Eur J Appl Physiol 2003;88(4-5):297-316.
11. Dadashi F, Mariani B, Rochat S, Büla CJ, Santos-Eggimann B, Aminian K. Gait and foot clearance parameters obtained using shoe-worn inertial sensors in a large-population sample of older adults. Sensors
2013;14(1):443-57.
12. Chile. Ministerio de Salud, Programa de Salud del Adulto Mayor. División de Prevención y Control de Enfermedades, Subsecretaría de Salud Pública. Manual de Aplicación del Examen de Medicina Preventiva del Adulto Mayor (EMPAM) [Internet]. [sem local]: Ministério de Salud De Chile; 2014 [acesso em 23 ene. 2014]. Disponível em: http://www. saludohiggins.cl/attachments/314_Instructivo%20 del%20Control%20de%20Salud%200107.pdf
13. Sánchez-García S, García-Peña C, Duque-López MX, Juárez-Cedillo T, Cortés-Núñez AR, Reyes-Beaman S. Anthropometric measures and nutritional status in a healthy elderly population. BMC Public Health 2007 7:2.
14. Stratford PW, Balsor BE. A comparison of make and break tests using a hand-held dynamometer and the
Kin-Com. J Orthop Sports Phys Ther 1994;19(1):28-32. 15. Medina P. Confiabilidad de una metodología aplicable
para la medición de cinemática simple del pie en adultos mayores autovalentes de la comunidad. Biosalud 2014;13(1): 9-20.
16. Winter DA. Foot trajectory in human gait: a precise and multifactorial motor control task. Phys Ther
1992;72(1):45-53.
17. Karst GM, Hageman PA, Jones TF, Bunner SH. Reliability of foot trajectory measures within and between testing sessions. J Gerontol Ser A Biol Sci
Med Sci 1999;54(7):343-7.
18. Begg R, Best R, Dell'Oro L, Taylor S Minimum foot clearance during walking: strategies for the minimisation of trip-related falls. Gait Posture
2007;25(2):191-8.
19. Merryweather A, Yoo B, Bloswick D. Gait characteristics associated with trip-induced falls on level and sloped irregular surfaces. Minerals 2011;1(1):109-21.
20. Najafi B, Helbostad JL, Moe-Nilssen R, Zijlstra W, Aminian K. Does walking strategy in older people change as a function of walking distance? Gait Posture 2009;29(2):261-6.
21. Melzer I, Benjuya N, Kaplanski J, Alexander N. Association between ankle muscle strength and limit of
stability in older adults. Age Ageing 2009;38(1):119-23.
22. Wolfson L, Judge J, Whipple R, King M. Strength is a major factor in balance, gait, and the occurrence
of falls. J Gerontol Ser A Biol Sci Med Sci 1995;50(n.
Spec): 64-7.
23. Moxley Scarborough D, Krebs DE, Harris BA. Quadriceps muscle strength and dynamic stability in elderly persons. Gait Posture 1999;10(1):10-20.
24. Buchner DM, Larson EB, Wagner EH, Koepsell TD, De Lateur BJ. Evidence for a non-linear relationship between leg strength and gait speed. Age Ageing
1996;25(5):386-91.
25. Espy DD, Yang F, Bhatt T, Pai YC. Independent influence of gait speed and step length on stability
and fall risk. Gait Posture 2010;32(3):378-82.
26. Misu S, Doi T, Asai T, Sawa R, Tsutsumimoto K, Nakakubo S, et al. Association between toe flexor strength and spatiotemporal gait parameters in community-dwelling older people. J
Neuroengineering Rehabil 2014;11(1):1-8.
27. Cress ME, Meyer M. Maximal voluntary and functional performance levels needed for
independence in adults aged 65 to 97 years. Phys Ther 2003;83(1):37-48.
28. Gagnon P, Maltais F, Bouyer L, Ribeiro F, Coats V, Brouillard C, et al. Distal leg muscle function in
patients with COPD. COPD 2013;10(2):235-42.
29. Judge JO, Davis RB 3rd, Ounpuu S. Step length reductions in advanced age: the role of ankle and hip kinetics. J Gerontol Ser A Biol Sci Med Sci
1996;51(6):303-12.
30. Anderson DE, Madigan ML. Healthy older adults have insufficient hip range of motion and plantar flexor strength to walk like healthy young adults. J
Biomech 2014;47(5):1104-9.
31. Chiba H, Ebihara S, Tomita N, Sasaki H, Butler J. Differential gait kinematics between fallers and non-fallers in community-dwelling elderly people. Geriatr
Gerontol Int 2005;5(2):127-34.
32. Nathan R, Getz WM, Revilla E, Holyoak M, Kadmon R, Saltz D, et al. A movement ecology paradigm for unifying organismal movement research. Proc Natl
33. Toker Z. Walking beyond the Socioeconomic Status in an objectively and perceptually walkable pedestrian
environment. Urban Stud Res [Internet] 2015 [acesso em 23 ene. 2014];2015:1-15. Disponível em: http:// www.hindawi.com/journals/usr/2015/919874/cta/
34. Magistro D, Liubicich ME, Candela F, Ciairano S. Effect of ecological walking training in sedentary elderly people: act on aging study. Gerontologist
2014;54(4):611-23.
35. Mills PM, Barrett RS. Swing phase mechanics of healthy young and elderly men. Hum Mov Sci
2001;20(4-5):427-46.
36. Russell EM, Braun B, Hamill J. Does stride length influence metabolic cost and biomechanical risk factors for knee osteoarthritis in obese women? Clin
Biomech (Bristol, Avon) 2010;25(5):438-43.
Recieved: December 3, 2015 Revised: December 20, 2015