Somatotype and risk of breast
cancer: a case-control study in
Uruguay
Somatotipo de risco de câncer de
mama: um estudo caso-controle no
Uruguai
Alvaro L. Ronco
1,2Beatriz Mendoza
3Ximena Varas
2Sylvia Jaumandreu
2Eduardo De Stéfani
4Gustavo Febles
2Rosana Barboza
2Mery Gateño
21 Departamento de Epidemiología y Métodos Cientíicos, Facultad de Medicina,
Centro Latinoamericano de Economía Humana.
2 Instituto de Radiología y Centro de Lucha Contra el Cáncer, Centro
Hospitalario Pereira Rossell, Ministerio de Salud Pública.
3 Clínica de Endocrinología y Metabolismo, Facultad de Medicina, Hospital de
Clínicas, Universidad de la República.
4 Grupo de Epidemiología, Cátedra de Anatomía Patológica, Facultad de
Medicina, Hospital de Clínicas, Universidad de la República.
Correspondent author: Alvaro L. Ronco.Convención 1490 dep.202, Montevideo 11100 - URU-GUAY. E-mail: [email protected]
Abstract
According to the evidence, there is a need for more thorough assessment and quan-tification of body size and shape and the risk of breast cancer. Using the somatotype methodology, we carried out an original research in order to explore possible asso-ciations between body shape and the risk of breast cancer in Uruguayan women. With this objective, 254 recent breast cancer ca-ses and 1,000 frequency-matched healthy controls were interviewed on menstrual and reproductive story, and a series of skinfolds, circumferences and diameters were measu-red specifically to calculate somatotype. A positive association with breast cancer was found for high endomorphy (Odds Ratio [OR] = 2.82, p < 0.001), mainly among pre-menopausal women (OR = 4.98, p <0.001) and normoweight women (OR = 5.12, p = 0.002), whereas almost no differences were observed for mesomorphic and ectomor-phic women. Analysis showed a high meso-endomorphic pattern in the study popula-tion. Further studies are needed to confirm the present results obtained in a country with high incidence of the disease.
Resumo
Segundo as evidências, há uma necessidade mais profunda de avaliação e quantificação da dimensão e da forma corporal e o risco de câncer de mama (CM). Utilizando a me-todologia do somatotipo, realizamos uma pesquisa original com o objetivo de explorar possíveis associações entre a forma corporal e o risco de CM nas mulheres uruguaias. Com essa finalidade, 254 casos recentes de CM e 1.000 controles emparelhados por freqüência foram entrevistadas sobre história menstrual e reprodutiva, e uma série de dobras cutâneas, circunferências e diâmetros foram medidas especificamente para se fazer o cálculo do somatotipo. Foi encontrada uma associação positiva com CM para forte endomorfismo (OR = 2.82, p < 0.001), especialmente nas mulheres pre-menopáusicas (OR = 4.98, p < 0.001) e com normopeso (OR = 5.12, p = 0.002); entretan-to, não foram observadas diferenças para mesomorfismo e ectomorfismo. As análises apresentaram um elevado padrão meso-endomórfico na população estudada. São necessários novos estudos para confirmar os resultados presentes, obtidos em um país com elevada incidência da enfermidade.
Palavras-chave: Antropometria. Câncer de mama. Epidemiologia. Menopausa. Somatotype.
Introduction
Anthropometric measures have been included as potential risk factors for breast cancer (BC). Research in obesity has clearly demonstrated that it is a heterogeneous condition in terms of etiology and its
asso-ciation with health outcomes1,2. A woman’s
build, obesity, fat distribution, increased height and body mass index and weight gain have been found to increase risk in some
studies but not in all of them3. Concerning
this, menopausal status emerged as a key factor to analyze different subpopulations in view of the contrasting results obtained by epidemiologic research.
Some studies examined regional
adipo-sity and BC risk4-11. A positive association of
central adiposity with postmenopausal BC risk and also a weaker association for pre-menopausal women were found in most of these studies. Absence of association with anthropometric measures in pre-menopausal women was described in
cer-tain populations, like the Chinese8,9.More
recently, waist-to-hip ratio was associated with an increased risk in pre-menopausal
Nigerian10 and Asian-American women11
and also the fat-free mass has been found to be positively associated with the risk of
BC in postmenopausal women12.
A recent review on anthropometry and
BC3 recognized that more detailed,
standar-dized, reliable and validated assessments of body size and shape are needed. Also, better classification according to fat localization is needed so that differences in fat deposition can be appropriately measured. Moreover,
McTiernan13 suggested the usefulness of
case-control studies on anthropometric factors in racial and ethnic minorities, since these groups have not yet been sufficiently studied.
A somatotype is “a quantitative descrip-tion of the present shape and composidescrip-tion
of the human body”14. This method of
phy-sical classification was developed by W.H.
Sheldon from the 1920’s to 1950’s15 and was
refined later16. A somatotype describes the
be broken down into three components presented and read in this order: endomor-phy, mesomorphy and ectomorphy. These components differ between populations according to origin, age, and sex. Some patterns of familial correlations suggest the role of genetic factors in explaining
variation in human physique17, at least for
mesomorphy18. The changes that occur in
a somatotype happen during childhood to maturity. However, somatotypes can be altered through training and/or nutrition. An endomorphic somatotype characterizes the relative fatness of a person’s body. The mesomorphic somatotype is characterized by musculo-skeletal size. Ectomorphy is characterized by relative linearity or slen-derness and is derived from the ponderal index (height in cm divided by the cube root of weight in kg).
Originally, everyone’s body shape was described by three numbers from 1 to 7, one for each of the three basic somato-types, although longer scales are currently also used. The dominant somatotype of a subject is defined as a somatotype compo-nent rating at least 0.5 points higher than either of the other two component ratings. Ratings on each component up to 2.5 are considered low, 3 to 5 are moderate, 5.5 to
7 are high, and 7.5 and above are very high14
. The highest value leads to the labeling of an individual, according to this prevailing component. The rating is phenotypical, based on the concept of geometrical size-dissociation and applicable to both genders from childhood to old age.
Examples of average somatotypes of non-athletic women are an elderly group in
the Czech Republic 9 with 5.4 – 5.7 – 0.6, or a
group of Belgian nursing professionals, with
mean values of 5.0 – 4.0 – 2.020. A specific
chart (somatochart) is commonly used to give a visual expression of the quoted pro-portions. It has a central point whose values (4 – 4 – 4) represent a theoretical perfect balance among proportions.
According to international publica-tions,21 Uruguay is a country with a very
high incidence of BC. In the past ten years
the disease risk has been thoroughly studied
from the dietary viewpoint22-9 but not from
the anthropometric standpoint yet. In almost all of the quoted hospital-based studies, which were performed at public institutions, BMI has not shown any association with BC risk and also a high prevalence of overweight and obesity was observed in the population samples studied (around 65%).
We are not aware of any previous epi-demiologic study on BC reported in the literature on the use of somatotype metho-dology in order to analyze body shape and its possible association with BC. Taking into account the appropriate conditions for such epidemiologic research that Uruguayan wo-men have, we decided to perform the present exploratory study.
Subjects and Methods
The authors carried out a hospital-based case-control study on anthropometry and BC during the period between June/2004 and August/2006. Based on an estimated institutional incidence of 125 BC cases per year, we projected to interview and measure, during a 2.5-year period, 1,800 women up to the age of 70 as a convenience sample, 300 of them with recently diagnosed BC and 1,500 healthy controls (5 per case), aged ± 5 years in relation to cases, living in Uruguay and attending the public healthcare system (about 40% of the adult population). In Uru-guay this subpopulation involves mainly the lowest socioeconomic strata.
The Instituto de Radiología y Centro de Lucha Contra el Cáncer is a reference center for BC in Uruguay. Located at the Pereira Rossell Women’s Hospital in Montevideo since the 1930’s, it receives women coming from all over the country who receive care from the public health system. Currently, around 60 diagnostic mammograms in a predominantly asymptomatic population are performed daily.
histologically diagnosed carcinomas – in-terviewed between 0 and 10 days after their diagnosis. Potential cases with ages over 70 were not taken into account, because of the lack of healthy controls to match them and also to reduce a possible recall bias. Eligibi-lity criterion also accepted patients with a personal history of another cancer type (5% of all cases), provided they were in clinical cure at the moment of the interview. Their recruitment was performed in patients with mammogram BI-RADS 4 (suspicious of ma-lignancy) and 5 (highly suspicious of cancer) lesions30,31, and a positive cytological (on
site) study, which was further histologically confirmed, according to its high correlation
with histopathology32. Initially, no
informa-tion on cancer staging was collected through the study period.
Since BC cases were interviewed and measured very early on, they had not yet ex-perienced any post diagnostic or treatment-induced weight change. Although women do not formally participate in a screening program, cancers are usually diagnosed at early stages (ca. 15% carcinoma in situ). In the same time period, and in the same insti-tution, 1,029 healthy women with a negative diagnostic mammogram (BIRADS categories 1 [completely negative]; 2 [only with findings not associated with pathology, e.g. benign
calcifications and/or axillary lymphnodes])0
performed on the same day of the interview, were randomly selected as controls. They were frequency-matched by age (± 5 years) to cases, being mandatory requirements for the controls not to be hospitalized at the moment of the interview and not having cancer. Most women aged under 30 were examined only with ultrasound, unless findings also required mammography, due to the high density of breasts at those ages. Normal aged controls were relatively infrequent in consulting at the Institute, and it is difficult to find completely normal mammograms in older women; the-refore the ratio control/case was around 2:1 to 3:1, whereas among young and middle aged women that ratio was near 5:1. After excluding 27 women who had had cancer in the past (mostly uterine cervix) and 2 who refused the
interview, a final number of 1,000 controls were recruited. Therefore, one thousand two hundred fifty four (1,254) women consulting for a mammography at the Instituto de Ra-diología y Centro de Lucha Contra el Cáncer in Montevideo were included in the study. Interviews and measurements were perfor-med by only one nurse, who was blind to the objectives of the study, previously trained, and periodically supervised during the study period. All interviews were conducted in the hospital and performed face-to-face, and a written consent was obtained from every interviewed subject. People affiliated to the public health system are very cooperative; therefore a high participation is always expec-ted. The research was approved by the ethical committee of the Hospital.
The questionnaire included the follo-wing sections:
• Sociodemographicvariables;
• Menstrual and reproductive events (age at menarche, age at first live birth, number of children, months of breastfeeding, menopausal status (pre/ post). Menopausal status was defined a priori: if according to the subject (aged >=45) menstruations had ceased at least for 6 months, excluding pregnancy, she was classified as postmenopausal; • History of cancer in first and second
degree relatives;
• Physical exercise (yes/no), frequency, duration and intensity and
• Self-reportedweightatage18.Therewas no question on hormonal replacement therapy, because it is not usually prescribed to postmenopausal women who belong to the studied subpopulation. The question about physical exercise referred to free-time activity, recreational or competitive, 5 years prior the interview. This assessment was performed only as an exploratory tool in the studied group, whose low income limits their time and access to sport institutions. The method was not validated.
• height (measured to the nearest centimeter)
• weight(atintervalsof0.100kg)
• circumferences (in cm): (waist, hip, flexed and tensed arm, calf)
• skinfolds(inmm):tricipital,subscapular, supraspinal, calf)
• diameters(inmm):bicondyleal(femur) and bicondyleal (humerus).
Anthropometric equipment included a height scale and headboard, a weighing scale, a Vernier caliper, a flexible plastic measuring tape, and a skinfold caliper. The same mechanical scale was used along the whole study period, with a weekly ca-libration. Subjects were weighed wearing minimal clothing. For body measurements a plastic measuring tape at intervals of 0.5 cm (for circumferences), a Vernier caliper (for diameters) and a FatTrack Pro ® (Accu-fitness, Greenwood Village, CO, USA) digital caliper (for skinfolds) were used. Regarding these latter, if two consecutive measure-ments were similar, the value obtained was registered as valid. If both were different, a third one was taken and the median value was then registered. Measurements were performed according to Carter’s Instruction
Manual33.
Somatotype
There are three extreme types:
• Extreme Endomorph: wide hips and narrow shoulders (pear-shaped), high fatness on the body, upper arms and thighs, quite slim wrists and ankles; • ExtremeMesomorph:broadshoulders
and relatively narrow hips (wedge-shaped), muscular body, strong forearms and thighs, very little body fat;
• ExtremeEctomorph:narrowshoulders, hips and chest, thin face, high forehead, thin legs and arms, very little muscle or fat.
Calculations of somatotype for each
pa-tient were done with specialized software34.
The following measurements were taken
into account: height, weight, four skinfolds (triceps, subscapular, supraspinal, and me-dial calf), two circumferences (tensed arm, calf ), and two bone breadths (humerus, femur). Mean values of somatotype were calculated for all cases and all controls. Formulas applied to calculate somatotype are the following:
Endomorphy = - 0.7182 + 0.1451 (Σ) - 0.00068
(Σ2) + 0.0000014 (Σ3)
Mesomorphy = (0.858 HB + 0.601 FB +0.188 CAG + 0.161 CCG) - (0.131 H) + 4.5
Ectomorphy:
If HWR ≥ 40.75, then Ectomorphy = 0.732
HWR - 28.58
If HWR < 40.75 and > 38.25, then Ectomor-phy = 0.463 HWR - 17.63
If HWR ≤ 38.25, then Ectomorphy = 0.1
where: Σ = (sum of triceps, subscapular
and supraspinale skinfolds) multiplied by (170.18/height in cm); HB = humerus bre-adth; FB = femur brebre-adth; CAG = corrected arm girth; CCG = corrected calf girth; H = height; HWR = height / cube root of wei-ght.
CAG and CCG are the girths corrected for the triceps or calf skinfolds respectively as follows: CAG = flexed arm girth - triceps skinfold/10; CCG = maximal calf girth - calf skinfold/10.
Statistic analysis
Calculations of mean ± standard de-viation for each variable were made. Based on the measurements done, the following calculations were made: Body Mass Index (BMI, kg/m2), BMI at age 18 (kg/m2), BMI difference (current-18 yrs), weight difference (id.) and waist-to-hip ratio. Somatotype va-riables were classified in tertiles, according to control distribution. Crude and adjusted Odds Ratios (OR) and 95% Confidence Inter-vals (CI)s were calculated by unconditional
logistic regression35. Potential confounders
and first delivery, use of oral contracepti-ves, BMI, BMI at age 18, physical exercise, menopausal status, and family history of BC. For analysis purposes, stratifications by menopausal status (pre-/post-) and by levels of body mass index (normoweight, overweight, obese) were also carried out. A P-value for trend was calculated for risk estimates using the chi-square test for linear trend. All calculations were performed with STATA software (Release 6, College Station, Texas, USA 1999).
Results
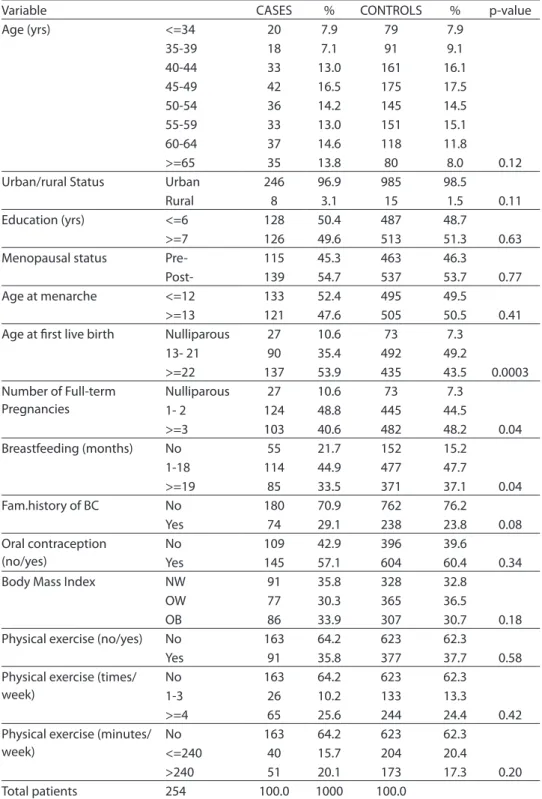
The general characteristics of the sample analyzed are presented in Table 1. At the moment of closing the entry of subjects’ data to perform the current analysis (Au-gust/2006), some lack of age controls was observed. A very homogeneous population was described. Except for certain repro-ductive variables (age at first live birth, number of full-term pregnancies, and time of breastfeeding), education, urban/rural status, oral contraception, BMI, practice of physical exercise, menopausal status, and age at menarche were very similar.
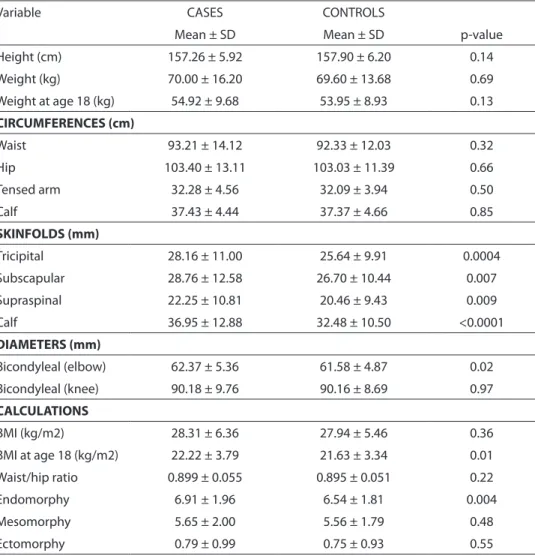
Table 2 shows the anthropometric fea-tures of the study population. Whereas me-asured circumferences tended to be rather similar, skinfolds were significantly thicker among cases. Among diameters, only bicon-dyleal of humerus showed statistical diffe-rences, also larger among cases (p = 0.02). Estimated BMI at age 18 showed significant differences (p = 0.01), higher for cases. Of somatotype variables, only endomorphy displayed significant differences between cases and controls (p = 0.004), being higher for cancer cases. The average somatotype for the whole population was 6.6 – 5.6 – 0.7 (data not shown). According to these numbers, the global somatytype pattern is a strong meso-endomorphic one.
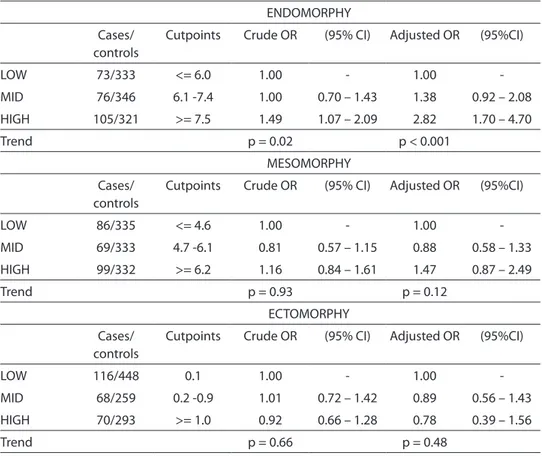
Table 3 shows crude and adjusted OR’s for endomorphy, mesomorphy and ecto-morphy. Considering both crude and adjus-ted OR’s, a high endomorphy was positively associated with the risk of BC (OR = 1.49 and
OR = 2.82 respectively). High mesomorphy tended to show a slight increase in risk (OR = 1.26 and OR = 1.47 respect.), albeit not significant. Ectomorphy displayed a lack of association with BC (OR = 0.92 and OR = 0.78 for crude and adjusted values, respectively).
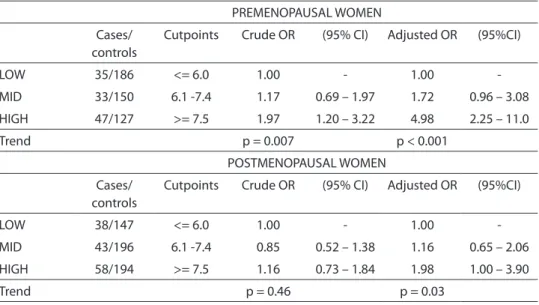
When endomorphy was discriminated by menopausal status, some differences aro-se, as seen on Table 4. On one side, among pre-menopausal women, the calculated OR’s for the highest tertiles of endomorphy were positively and significantly associated with the risk of BC, both crude and adjusted (OR = 1.97 and OR = 4.98, respect.). On the other hand, among postmenopausal wo-men, only the adjusted OR’s were strongly associated with BC (OR = 1.98, p-value for trend = 0.03). Nevertheless, a test for hete-rogeneity failed to demonstrate differences between both subgroups (p = 0.42, results not shown).
Finally, analyses stratifying data by BMI level (Table 5) showed that high endomor-phy had a stronger association with risk of BC among normoweight women than among overweight and obese, for crude OR (OR = 5.26 vs. 1.65, respect.) and for adjusted OR’s (OR = 5.12 vs. 2.06, respect.). In all cases, statistical trends were highly significant. Also here the test for hetero-geneity did not demonstrate differences between both subsets (p = 0.25, results not shown). An additional likelihood ratio test for interaction performed to categories of endomorphy adjusted by BMI (dichotomi-zed) indicated non significant differences (p = 0.14, results not shown).
Discussion
Table 1 - General features of the study population (Uruguay, 2004-06): Sociodemographic, menstrual, reproductive and other selected variables of interest. Relative frequencies and p-value of diferences between cases (n=254) and controls (n=1000).
Tabela 1 – Características gerais da população estudada (Uruguai, 2004-06): Variáveis socio-demográicas, reprodutivas e outras variáveis selecionadas de interesse. Freqüências relativas e valor p das diferenças entre casos (n=254) e controles (n=1000).
Variable CASES % CONTROLS % p-value
Age (yrs) <=34 20 7.9 79 7.9
35-39 18 7.1 91 9.1
40-44 33 13.0 161 16.1
45-49 42 16.5 175 17.5
50-54 36 14.2 145 14.5
55-59 33 13.0 151 15.1
60-64 37 14.6 118 11.8
>=65 35 13.8 80 8.0 0.12
Urban/rural Status Urban 246 96.9 985 98.5
Rural 8 3.1 15 1.5 0.11
Education (yrs) <=6 128 50.4 487 48.7
>=7 126 49.6 513 51.3 0.63
Menopausal status Pre- 115 45.3 463 46.3
Post- 139 54.7 537 53.7 0.77
Age at menarche <=12 133 52.4 495 49.5
>=13 121 47.6 505 50.5 0.41 Age at irst live birth Nulliparous 27 10.6 73 7.3
13- 21 90 35.4 492 49.2
>=22 137 53.9 435 43.5 0.0003 Number of Full-term
Pregnancies
Nulliparous 27 10.6 73 7.3
1- 2 124 48.8 445 44.5
>=3 103 40.6 482 48.2 0.04
Breastfeeding (months) No 55 21.7 152 15.2
1-18 114 44.9 477 47.7
>=19 85 33.5 371 37.1 0.04
Fam.history of BC No 180 70.9 762 76.2
Yes 74 29.1 238 23.8 0.08
Oral contraception (no/yes)
No 109 42.9 396 39.6
Yes 145 57.1 604 60.4 0.34
Body Mass Index NW 91 35.8 328 32.8
OW 77 30.3 365 36.5
OB 86 33.9 307 30.7 0.18
Physical exercise (no/yes) No 163 64.2 623 62.3
Yes 91 35.8 377 37.7 0.58
Physical exercise (times/ week)
No 163 64.2 623 62.3
1-3 26 10.2 133 13.3
>=4 65 25.6 244 24.4 0.42
Physical exercise (minutes/ week)
No 163 64.2 623 62.3
<=240 40 15.7 204 20.4
>240 51 20.1 173 17.3 0.20
Total patients 254 100.0 1000 100.0
Abbreviations: NW=Normoweight (<=24.99 kg/m2); OW=Overweight (25.0 – 29.99 kg/m2); OB=Obesity (>30 kg/m2) /
Table 2 - Anthropometric features of the study population. (Uruguay, 2004-06): Mean values ± Standard Deviation of each measurement and p-value of diferences between cases (n=254) and controls (n=1000).
Tabela 2 – Características antropométricas da população estudada. (Uruguai, 2004-06): valores medianos ± desvio padrão de cada medição e valor p das diferenças entre casos (n=254) e controles (n=1000).
Variable CASES CONTROLS
Mean ± SD Mean ± SD p-value
Height (cm) 157.26 ± 5.92 157.90 ± 6.20 0.14
Weight (kg) 70.00 ± 16.20 69.60 ± 13.68 0.69
Weight at age 18 (kg) 54.92 ± 9.68 53.95 ± 8.93 0.13
CIRCUMFERENCES (cm)
Waist 93.21 ± 14.12 92.33 ± 12.03 0.32
Hip 103.40 ± 13.11 103.03 ± 11.39 0.66
Tensed arm 32.28 ± 4.56 32.09 ± 3.94 0.50
Calf 37.43 ± 4.44 37.37 ± 4.66 0.85
SKINFOLDS (mm)
Tricipital 28.16 ± 11.00 25.64 ± 9.91 0.0004
Subscapular 28.76 ± 12.58 26.70 ± 10.44 0.007
Supraspinal 22.25 ± 10.81 20.46 ± 9.43 0.009
Calf 36.95 ± 12.88 32.48 ± 10.50 <0.0001
DIAMETERS (mm)
Bicondyleal (elbow) 62.37 ± 5.36 61.58 ± 4.87 0.02
Bicondyleal (knee) 90.18 ± 9.76 90.16 ± 8.69 0.97
CALCULATIONS
BMI (kg/m2) 28.31 ± 6.36 27.94 ± 5.46 0.36
BMI at age 18 (kg/m2) 22.22 ± 3.79 21.63 ± 3.34 0.01
Waist/hip ratio 0.899 ± 0.055 0.895 ± 0.051 0.22
Endomorphy 6.91 ± 1.96 6.54 ± 1.81 0.004
Mesomorphy 5.65 ± 2.00 5.56 ± 1.79 0.48
Ectomorphy 0.79 ± 0.99 0.75 ± 0.93 0.55
Abbreviation: SD = Standard Deviation
cases displayed a higher endomorphy than healthy controls in all analyses, while me-somorphy did not reach significance and ectomorphy was almost similar for cases and controls. Endomorphy displayed strong positive associations with BC risk after crude and adjusted analyses, mainly for the whole sample (OR = 1.56 vs. 2.86), for pre-menopausal women (OR = 1.98 vs. 5.08), and for normoweight ones (OR = 5.27 vs. 5.34), although formal tests for interaction failed to demonstrate heterogeneity in these two
Table 3 - Crude and adjusted OR’s of somatotype components. Estimates according to division of each component into tertiles.
Tabela 3 – OR’s brutas e ajustadas de componentes do somatotipo. Estimativas segundo divisão de cada componente em tercis.
ENDOMORPHY
Cases/ controls
Cutpoints Crude OR (95% CI) Adjusted OR (95%CI)
LOW 73/333 <= 6.0 1.00 - 1.00
-MID 76/346 6.1 -7.4 1.00 0.70 – 1.43 1.38 0.92 – 2.08
HIGH 105/321 >= 7.5 1.49 1.07 – 2.09 2.82 1.70 – 4.70
Trend p = 0.02 p < 0.001
MESOMORPHY
Cases/ controls
Cutpoints Crude OR (95% CI) Adjusted OR (95%CI)
LOW 86/335 <= 4.6 1.00 - 1.00
-MID 69/333 4.7 -6.1 0.81 0.57 – 1.15 0.88 0.58 – 1.33
HIGH 99/332 >= 6.2 1.16 0.84 – 1.61 1.47 0.87 – 2.49
Trend p = 0.93 p = 0.12
ECTOMORPHY
Cases/ controls
Cutpoints Crude OR (95% CI) Adjusted OR (95%CI)
LOW 116/448 0.1 1.00 - 1.00
-MID 68/259 0.2 -0.9 1.01 0.72 – 1.42 0.89 0.56 – 1.43
HIGH 70/293 >= 1.0 0.92 0.66 – 1.28 0.78 0.39 – 1.56
Trend p = 0.66 p = 0.48
Adjustment terms: age (continuous), education (continuous), urban/rural status (urban/rural), age at menarche (continuous), number of live births (continuous), age at first delivery (continuous), months of breastfeeding (continuous), years between menarche and first delivery (continuous), menopausal status (pre-/post-), family history of breast cancer (yes/no), use of oral contraception (yes/no), weight at age 18 (continuous), physical exercise (yes/no), body mass index (categorical, normoweight, overweight, obese). P-values in Table refer to linear trends of estimates.
A greater upper or central body fat distribution has been reported mainly as associated with multiple hormonal and metabolic changes including insulin resis-tance, hyperinsulinemia, decrease in SHBG (sex hormone-binding globulin) levels, increase in androgen levels, and the con-version of androgen to estrogen in adipose
tissue36-38. Therefore, women having this
pattern associated with increased risk for diabetes mellitus, hypertension and car-diovascular disease may have theoretically a higher risk for BC than women whose fat is mainly distributed over hips, buttocks, and lower extremities. Since BC is a multi-factorial disease, western lifestyle may act
on the incidence of BC through an influen-ce on body fat distribution and resulting
changes in sex steroid availability39. In our
report, on the contrary, a high endomorphy (rather similar to the gynoid-type obesity) was found as positively associated with the risk of BC, despite menopausal status. Regarding this, a higher aromatase activity was also described almost two decades
ago in these body regions40 and it could
ac-count, in view of the different origins that Uruguayan women have when compared with Americans, Scandinavians or others from first world countries.
The inclusion of BMI as an adjustment term and the high OR’s found also among women who are normoweight according to BMI criteria lead us to think about the potential importance of body shape, in particular based on fat and muscle distri-bution, regarding the risk of BC. A gynoid-type obesity should be carefully considered from the clinical viewpoint, since it appears as a likely drawback for prevention and/ or treatment of BC, considering that the anatomic site can imply in a non desirable excess of hormonal synthesis. Regarding women’s typical hormone-related cancers (breast, endometrium, ovary), this relatively simple technique deserves to be explored in broader population groups and also for the patient follow-up.
As other case-control studies, our work has limitations and strengths. A major limi-tation is related to the current sample size; it
Table 4 - Crude and adjusted OR’s of Endomorphy, stratiied by menopausal status. Estimates according to division of each status into tertiles.
Tabela 4 – OR’s brutas e ajustadas de endomoria, estratiicadas por condição menopausal. Estimativas segundo divisão de cada condição em tercis.
PREMENOPAUSAL WOMEN
Cases/ controls
Cutpoints Crude OR (95% CI) Adjusted OR (95%CI)
LOW 35/186 <= 6.0 1.00 - 1.00
-MID 33/150 6.1 -7.4 1.17 0.69 – 1.97 1.72 0.96 – 3.08
HIGH 47/127 >= 7.5 1.97 1.20 – 3.22 4.98 2.25 – 11.0
Trend p = 0.007 p < 0.001
POSTMENOPAUSAL WOMEN
Cases/ controls
Cutpoints Crude OR (95% CI) Adjusted OR (95%CI)
LOW 38/147 <= 6.0 1.00 - 1.00
-MID 43/196 6.1 -7.4 0.85 0.52 – 1.38 1.16 0.65 – 2.06
HIGH 58/194 >= 7.5 1.16 0.73 – 1.84 1.98 1.00 – 3.90
Trend p = 0.46 p = 0.03
Adjustment included age (continuous), age at menarche (continuous), parity (continuous), age at first live birth (continuous), months of breastfeeding (continuous), years between menarche and first delivery (continuous), BMI (continuous), BMI at age 18 (continuous), use of oral contraceptives (yes/no) and family history of BC (yes/no). For postmenopausal, age at menopause (continuous) was included as a regression term. P-values in Table refer to linear trends of estimates.
would be desirable to analyze a larger one, in order to have enough statistical power for certain results, in particular in some subsets. Another limitation is the impossibility to compare our results with those of another similar report, a common issue in initial studies. In fact, somatotype is an analysis technique that has been almost exclusively used for fitness and athletic assessment, but infrequently within the medical field. Historically it has been mainly related to
serum lipids and cardiovascular risk41-45,
as well as to obesity46,47 and scarcely used
in cancer research48,49. Recent research
showed a great potential for sophisticated technology to perform precise somatotype
classification50. Thus, manual procedures
such as those utilized here probably have greater measurement errors at the indivi-dual level. Nevertheless, they are still useful for population studies.
same healthcare system and they exhibited similarities concerning most sociodemogra-phic and some reproductive variables. To be quoted also among the strengths, we selec-ted as controls mostly women with normal breasts, not only without cancer; therefore, if benign breast diseases had any association with the analyzed anthropometric items, we attempted to reduce their possibility of bia-sing results. In order to reduce a possible re-call bias, eligible patients were up to age 70. Finally, this is a very cooperative population; therefore, high participation was achieved. Although it is not possible to avoid any bias completely, we think that results were not chance findings. Still, we need caution in the interpretation of results, since genera-lizing is limited due to population features: they have mid-to-low educational level and belong to low socioeconomic classes of a developing country.
In conclusion, we examined various anthropometric measures using a novel
approach in an effort to better describe possible associations of body shape with the risk of BC. Somatotype analysis revealed that cases were more endomorphic than controls. High endomorphy was positively and significantly associated with BC des-pite menopausal status and BMI level. It should also be taken into account that the study population belongs to a subset of a BC high-risk country like Uruguay, mainly with Hispanic and Latin European origins; therefore, we cannot extrapolate our results to elsewhere. Our study is still ongoing, and new analyses of cancer staging in a larger sample, as well as with other women of different origins are needed to confirm the suggested trends. Indeed, this is a task for the close future.
AUTHORS DISCLOSURE OF POTENTIAL CONFLICTS OF INTEREST
No relationships, neither financial nor of other nature, to disclose.
Table 5 - Crude and adjusted OR’s of Endomorphy, stratiied by Body Mass Index levels (*). Estimates according to division of endomorphy into tertiles.
Tabela 5 – OR’s brutas e ajustadas de endomoria, estratiicadas por níveis de índice de massa corporal (*).Estimativas segundo divisão de endomoria em tercis.
NORMOWEIGHT
Cases/ controls
Cutpoints Crude OR (95% CI) Adjusted OR (95%CI)
LOW 58/254 <= 6.0 1.00 - 1.00
-MID 69/27 6.1 -7.4 1.71 1.01 – 2.91 1.90 1.09 – 3.31
HIGH 5/6 >= 7.5 5.26 1.55 – 17.8 5.12 1.38 – 19.0
Trend p = 0.002 p = 0.002
OVERWEIGHT-OBESE
Cases/ controls
Cutpoints Crude OR (95% CI) Adjusted OR (95%CI)
LOW 15/79 <= 6.0 1.00 - 1.00
-MID 49/277 6.1 -7.4 0.93 0.50 – 1.75 1.12 0.58 – 2.16
HIGH 99/316 >= 7.5 1.65 0.94 – 2.99 2.06 1.09 – 3.90
Trend p = 0.006 p = 0.002
Adjustment terms: age (continuous), education (continuous), urban/rural status (urban/rural), age at menarche (continuous), number of live births (continuous), age at first delivery (continuous), months of breastfeeding (continuous), years between menarche and first delivery (continuous), menopausal status (pre-/post-), family history of breast cancer (yes/no), use of oral contraception (yes/no), weight at age 18 (continuous) and physical exercise (yes/no). P-values in Table refer to linear trends of estimates.
Aprovado pelo Comitê de Ética em Pes-quisa do Centro de Investigaciones Médicas, Facultad de Medicina da Universidad de Antioquia.
Os autores, através de documentação as-sinada e enviada a RBE, declaram não existir nenhum tipo de conflito de interesses.
References
1. World Cancer Research Fund. Food, Nutrition and the
prevention of cancer: a global perspective. Washington DC: World Cancer Research Fund; 1987, p. 252-87.
2. Carmichael AR, Bates T. Obesity and breast cancer: a review of the literature. Breast 2004; 13: 85-92.
3. Friedenreich CM. Review of anthropometric factors and
breast cancer risk. Eur J Cancer Prev 2001; 10:15-32.
4. Hall IJ, Newman B, Millikan RC, Moorman PG. Body size and breast cancer risk in black women and white
women. The Carolina Breast Cancer Study. Am J
Epidemiol 2000; 151: 754-64.
5. Shu XO, Jin F, Dai Q, Shi JR, Potter JD, Brinton LA et al. Association of body size and fat distribution with risk of breast cancer among Chinese women. Int J Cancer 2001; 94: 449-55.
6. Macinnis RJ, English DR, Gertig DM, Hopper JL, Giles GG. Body size and composition and risk of postmenopausal breast cancer. Cancer Epidemiol Biomarkers Prev 2004; 13: 2117-25.
7. Lahmann PH, Hoffmann K, Allen N, van Gils CH, Khaw KT, Tehard B et al. Body size and breast cancer risk: findings from the European Prospective Investigation into Cancer
And Nutrition (EPIC). Int J Cancer 2004; 111: 762-71.
8. Chow LW, Lui KL, Chan JC, Chan TC, Ho PK, Lee WY et al. Association between body mass index and risk of formation of breast cancer in Chinese women. Asian J Surg 2005; 28: 179-84.
9. Krebs EE, Taylor BC, Cauley JA, Stone KL, Bowman PJ, Ensrud KE. Measures of adiposity and risk of breast
cancer in older postmenopausal women. J Am Geriatr Soc
2006; 54: 63-9.
10. Okobia MN, Bunker CH, Zmuda JM, Osime U, Ezeome ER, Anyanwu SN et al. Anthropometry and breast cancer risk in Nigerian women. Breast J 2006; 12: 462-6.
11. Wu AH, Yu MC, Tseng CC, Pike MC. Body size, hormone therapy and risk of breast cancer in Asian-American women. Int J Cancer 2007; 120: 844-52.
12. Mellemkjaer L, Bigaard J, Tjonneland A, Christensen J, Thomsen B, Johansen C et al. Body composition and breast cancer in postmenopausal women: a Danish prospective cohort study. Obesity (Silver Spring) 2006; 14: 1854-62.
13. McTiernan A. Associations between energy balance and body mass index and risk of breast carcinoma in women from diverse racial and ethnic backgrounds in the U.S.
Cancer 2000; 88: 1248-55.
14. Carter JEL, Heath BH. Somatotyping: Development and
Applications. Cambridge: Cambridge University Press; 1990.
15. Sheldon WH. The somatotype, the morphophenotype,
and the morphogenotype. Cold Springs Harb Symp
Quant Biol 1951; 15: 373-82.
16. Heath BH, Carter JL. A modified somatotype method.
Am J Phys Anthrop 1967; 27: 57-74.
17. Katzmarzyk PT, Malina RM, Perusse L, Rice T, Province MA, Rao DC et al. Familial resemblance for physique:
heritabilities for somatotype components. Ann Hum
Biol 2000; 27: 467-77.
18. Sanchez-Andres A. Genetic and environmental influences on somatotype components: family study in
a Spanish population. Hum Biol 1995; 67: 727-38.
19. Riegerová J, Sigmund M. Somatical diagnosis of women in the age of maturus and presenilis - Female students of the University of the 3rd. age at the Faculty of Physical
Culture at Palack University in Olomouc. Gymnica 1999;
29: 19-24.
20. Cattrysse E, Zinzen E, Caboor D, Duquet W, Van Roy P, Clarys JP. Anthropometric fractionation of body mass:
Matiegka revisited. J Sport Sci 2002 ; 20: 717-23.
21. Parkin DM, Whelan SL, Ferlay J, Teppo L, Thomas DB.
Cancer Incidence in Five Continents Vol. VIII, IARC Scientific Publications Nº 155, Lyon: IARC; 2002.
22. Ronco AL, De Stéfani E, Mendilaharsu M, Deneo-Pellegrini H. Meat, fat and the risk of breast cancer: a
case-control study from Uruguay. Int J Cancer 1996; 65:
328-31.
23. De Stéfani E, Ronco AL, Mendilaharsu M, Guidobono M, Deneo-Pellegrini H. Meat intake, heterocyclic amines, and risk of breast cancer: a case-control study
in Uruguay. Cancer Epidemiol Biomarkers Prev 1997; 6:
573-81.
24. De Stéfani E, Correa P, Ronco AL, Mendilaharsu M, Guidobono M, Deneo-Pellegrini H. Dietary fiber and risk
of breast cancer. A case-control study in Uruguay. Nutr
25. De Stéfani E, Deneo-Pellegrini H, Mendilaharsu M, Ronco AL. Essential fatty acids and breast cancer: a
case-control study in Uruguay. Int J Cancer 1998; 76: 491-4.
26. Ronco AL, De Stéfani E, Boffetta P, Deneo-Pellegrini H, Mendilaharsu M, Leborgne F. Vegetables, fruits, and related nutrients and risk of breast cancer: a case control
study in Uruguay. Nutr Cancer 1999; 35: 111-9.
27. Ronco AL, De Stéfani E, Dáttoli R. Dairy foods and risk of breast cancer: a case-control study in Montevideo,
Uruguay. Eur J Cancer Prev 2002; 11: 457-63.
28. Ronco AL, De Stéfani E, Fabra A. White meat intake and the risk of breast cancer: a case-control study in
Montevideo, Uruguay. Nutr Res 2003; 23: 151-62.
29. Ronco AL, De Stéfani E, Boffetta P, Deneo-Pellegrini H, Acosta G, Mendilaharsu M. Food patterns and risk of
breast cancer: A factor analysis study in Uruguay. Int J
Cancer 2006; 119: 1672-8.
30. American College of Radiology. Breast imaging reporting
and data system (BI-RADS), 3rd ed. Reston, VA: American College of Radiology; 1998.
31. Lehman C, Holt S, Peacock S, White E, Urban N. Use of the American College of Radiology BI-RADS guidelines by community radiologists: concordance of assessments and recommendations assigned to screening mammograms. Am J Roentgenol 2002; 179: 15-20.
32. Jaumandreu S, Varas X, Mezzera J, Leborgne F. Cytologic
diagnosis in palpable nodules of the breast. Arch Ginecol
Obstet 2001; 39:148-53 (in Spanish).
33. Carter JEL. The Heath-Carter anthropometric somatotype
– Instruction Manual. Surrey, Canada: TeP and Rosscraft; 2002.
34. Somatotype. Release 1.0, Australia: Sweat Technologies; 2001.
35. Breslow NE, Day NE. Statistical methods in cancer
research. Volume 1 - The analysis of case-control studies.
IARC scientific publications Nº 32. Lyon: IARC; 1980.
36. Bruning PF, Bonfrer JMG, van Noord PAH, Hart AA, de Jong- Bakker M, Nooijen WJ. Insulin resistance and
breast cancer risk. Int J Cancer 1992; 52: 511-6.
37. Lorincz AM, Sukumar S. Molecular links between
obesity and breast cancer. Endocr Relat Cancer 2006; 13:
279-92.
38. Vona-Davis L, Howard-McNatt M, Rose DP. Adiposity, type 2 diabetes and the metabolic syndrome in breast
cancer. Obes Rev 2007; 8: 395-408.
39. Brunning PF. Endogenous estrogens and breast cancer a possible relationship between body fat distribution and
estrogen availability. J Steroid Biochem 1987; 27: 487-92.
40. Killinger DW, Perel E, Daniilescu D, Kharlip L, Lindsay
WR.The relationship between aromatase activity and
body fat distribution. Steroids 1987; 50: 61-72.
41. Garn SM, Gertler MM, Sprague HB. Somatotype and
serum-cholesterol. Circulation 1950; 2: 380-91.
42. Gordon E, Tobias PV, Mendelsohn D, Seftel H, Howson A. The relationship between somatotype and serum lipids
in male and female young adults. Hum Biol 1987; 59:
459-65.
43. Morris RW, Jacobs ML. On the application of
somatotyping to the study of constitution in disease. S
Afric J Clin Sci 1950; 1: 347-70.
44. Valkov J, Matev T, Hristov I. Relationship between somatotype and some risk factors for ischemic heart
disease. Folia Med (Plovdiv) 1996; 38: 17-21. (in Russian)
45. Malina RM, Katzmarzyk PT, Song TMK, Theriault G, Bouchard C. Somatotype and cardiovascular risk factors in healthy adults. Am J Hum Biol 1997; 9: 11-9.
46. Seltzer CC, Mayer J. Body build (somatotype)
distinctiveness in obese women. J Am Diet Assoc 1969;
55: 454-8.
47. Koleva M. Nacheva A, Boev M. Somatotype, nutrition,
and obesity. Rev Environ Health 2000; 15: 389-98.
48. Kolodchenko VP. Body build and soft tissue
malignancies. Vopr Onkol 2000; 29: 56-60. (in Russian)
49. Eiben OG, Buday J, Bosze P. Physique of patients with
carcinoma of the female genital tract. Eur J Gynaecol
Oncol 2004; 25: 683-8.
50. Das B, Kozey JW. A Computerized Potentiometric System for Structural and Functional Anthropometric
Measurements. Ergonomics 1994; 37: 1031-45.