1
Original Article
Anthropometric Indexes of Obesity as an Instrument
of Screening for High Coronary Risk in Adults in the
City of Salvador – Bahia
Francisco José Gondim Pitanga and Ines Lessa
Universidade Federal da Bahia - Salvador, BA - Brazil
Mailing: Francisco José Gondim Pitanga - Av. Luiz Tarquínio Pontes, 600 - 42700-000 - Lauro de Freitas, BA - Brazil
E-mail: [email protected] Received for publishing on 05/11/2004 Accepted on 01/21/2005
Objective
To compare some anthropometric indexes of obesity and identify among them which one best discriminates the high coronary risk (HCR).
Methods
A cross-section study, with sample consisting of 968 adults, between 30 and 74 years old, being 391 (40.4%) men. Many Receiver Operating Characteristic (ROC) curves were obtained and compared to areas under them among the conicity index (C index), body mass index (BMI), waist-hip circumference ratio (WHCR), waist circumference (WC) and HCR. The sensitivity and specificity to identify and compare the best cut-off point among the many indexes of obesity to discriminate the HCR were also identified. A confidence interval of 95% was used.
Results
The largest area under ROC curve was found between the C index and the HCR, in individuals of male sex, 0.80 (0.74-0.85), significantly differing from the other indexes of obesity. In women, the largest area found under the ROC curve was 0.76 (0.71-0.81), being equal between C, WHCR and HCR indexes.
Conclusion
Those results show that C and WHCR indexes are the best indexes of obesity to discriminate HCR. WC has intermediate discriminatory power and the BMI was the least suitable anthro-pometric index of obesity to discriminate HCR. Those data sug-gest that the indexes of abdominal obesity are better to discri-minate HCR than the indexes of general obesity.
Key words
anthropometric indexes of obesity, coronary risk, abdominal obesity
The role of obesity was coronary risk factor is controversial. However, the best explanation for the association between obesity and ischemic heart disease is that it would occur in a subgroup of obese individuals, which means in people who showed adiposity located in the abdominal or central region, even in the absence of general obesity1.
The accumulation of fat in the abdomen region has been des-cribed as the type of obesity that offers the greatest risk for the health of the individuals. The incidence of diabetes, atherosclerosis, gout, urinary calculus and sudden cardiac death is high in some obese individuals. However, an adiposity aspect that draws atten-tion to is the regional distribuatten-tion of fat in the body. Considering that perspective, the thickness of neck/sacral region skin folds and the fat-muscle proportion of brachio/femoral region were re-lated, which created the masculine differentiation index. Through that index, fat was classified as (a) android; that located in the central region and more specific for men, and (b) gynoid; fat located more in the hips and thighs, and more specific for women2.
Some years later3, abdominal obesity was related to the
in-crease of risk of myocardial infarction, cerebrovascular accident and early death, with a strong association among those variables. Such findings were particularly important to the extent that, by then, there was an association only between general obesity levels and the mentioned diseases. In opposition to the concepts at that time, the highest risk of myocardial infarction or early death was found in men with high quantity of abdominal fat, which suggested that men, even lean, but with body fat concentrated in the abdomen are those with the highest risk to develop cardiovascular diseases. More recent researches still identify the abdominal fat as a powerful coronary risk factor, with the comparison among the many obesity indexes as cardiovascular risk factor, being the result of many studies4,5,6.
In this study, the main objective was to analyze the anthropo-metric indexes of general and abdominal obesity as instruments of screening to discriminate high coronary risk (HCR).
Methods
2
Anthropometric Indexes of Obesity as an Instrument of Screening for High Coronary Risk in Adults in the City of Salvador - Bahia
A probabilistic sample per conglomerates from 37 census sec-tors in the urban perimeter in the city of Salvador. Initially 2,476 interviews were carried out, with 72 refusals (2.9%) and loss of 107 (4.7%) questionnaires with complete protocol. The sample in the original project consisted of 2,297 adults, with age between 20 and 74 years old, with 1,025 of male sex and 1,272 of female sex. As the index of coronary risk used in the present study was constructed based on a population between 30 to 74 years old, the sample of the original project was reduced to 1,654 adults, 711 men and 943 women. For the present study, a subgroup from that age group was used, which consisted of people who were submitted to the whole measurement protocol proposed, amounting 391 men and 577 wo-men, with age between 30 and 74 years old, which is equal to 55% of participants of male sex and 615 of female sex, in relation to the original database of the age ranges in context.
All participants in the research were interviewed at home for the collection of demographic data and had the systolic blood pressure (SBP) and diastolic blood pressure (DBP) measured 6 times; the first three in a row, 30 minutes after the beginning of the interview and the 3 next ones after an interval of 20 minutes, left arm, seated, empty bladder, without having smoked, had a coffee or alcohol in the 30 minutes prior to the measurements. The waist was measured with the individual wearing the minimum clothes as possible, in the middle distance between the last floating rib and the iliac crest, whereas the hips were measured with the measuring tape passing on femoral trochanters (two measurements) of each circumference. Weight and height were measured in the Health Center of each neighborhood by the study team itself (two measurements). The conicity index (C index) was determined through the measurements of weight, height and waist circum-ference (CC), by using the mathematical equation8:
C index =
The body mass index (BMI) was determined through the division of weight/height. The waist-hip circumference ratio (WHCR) was determined through the division of the waist circumference by the hip circumference. The blood drawing for the biochemical tests, after 12 hours of feast, was carried out at Health Center for support to the project. Dosages of total cholesterol (enzymatic Trinder method), HDL-C (Labtest method) and glycemia (enzymatic Trinder method) were done. Techniques and methods for bioche-mical exams were standardized by Sociedade Brasileira de Patolo-gia Clínica – Brazilian Association of Clinical Pathology. The project was submitted to the Comitê de Ética do Conselho Regional de Medicina do Estado da Bahia – Ethics Committee of Medicine Regional Council of the State of Bahia, being fully approved. All participants in the study or their responsible signed a consent term agreeing on participating in the research.
For the measurement of blood pressure an electronic tensio-meter (OMRON, model HEM-705CP) was used. Height was mea-sured with an English Leicester-type stadiometer, coupled to a base for field height measurement, manufactured by Child Growth
Foundation. Body weight was measured in new bathroom-type, standard scales, gauged at the beginning and periodically by INMETRO, with their own certificate, referring to an error margin of±100 g. For the measurement of waist and hip circumference, a metallic and flexible measurement tape, Starrett brand, with measurement definition of 0.1 cm.
The following variables were used: 1) age; 2) sex; 3) height; 4) weight; 5) CC; 6) hip circumference; 7) smoking; 8) glycemia; 9) total cholesterol; 10) HDL-C; 11) SBP and 12) DBP.
By using some of those variables, a coronary risk index was built to represent altogether the cardiovascular risk factors simultaneously analyzed. For the construction of coronary risk index initially an algorithm elabo-rated based on the cohort of Framinghan9 was used, whose authors
analyzed prospective data resulting from the follow-up, during 12 years, of 2,489 men and 2,856 women, with age of 30 to 74 years old. Based on incident cases of coronary artery disease (CAD), they used the regression model of Cox and elaborated a point table (algori-thm) with the inclusion of age, SBP, DBP, total cholesterol, HDL-C, smoking and diabetes. The points for each variable can be positive, risk factor, or negative, protection factor.
In determining the points for the casuistry of Salvador, the beta coefficient of the models of regression analysis of Cox9 was used,
based on the points of the variables themselves from the local sample. Percentile 80 (80% from the participants in the sample showing points lower than the value used to identify the high coronary risk) was chosen as cut-off point for dichotomization of the sample under “high/non-high coronary risk.” For male sex the percentile 80 cor-responded to 8 points and for the female, 10 points.
Cut-off points for C index, WHCR, WC and BMI were determined through Receiver Operating Characteristic (ROC) curves, frequently used to determine cut-off points in diagnostic or screening tests10.
Initially, the total area under the ROC curve between the C index, WHCR, WC, BMI and HCR was identified. The greater the area under the ROC curve, the greater the discriminatory power of indexes of obesity for HCR was. A confidence interval (CI) of 95% was used. CI at 95% calculation determines if the predictive ability of indexes of obesity is not due to chance, and its lower limit must not be lower than 0.5011.
In the sequence, the sensibility and specificity were calculated, besides the cut-off points for C index, WHCR, WC, BMI and HCR. Values identified through ROC curve consist of cut-off points that must promote a more suitable balance between sensitivity and speci-ficity for C index, WHCR, WC and BMI, as discriminators of HCR. Data were analyzed through the statistic program “STATA”, version 7.0.
Results
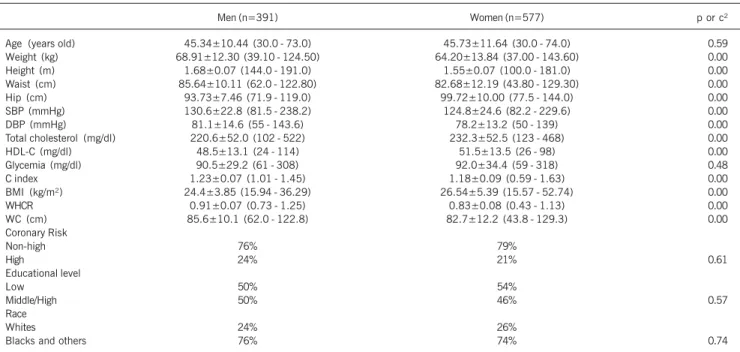
The characteristics of the sample are demonstrated on table I. It is observed that despite not having statistically significant differences between men and women in the variables educational level, race and coronary risk, most of participants in the sample show low coronary risk and are not whites. Statistically significant differences are observed between men and women in the variables of body weight, height, waist and hip circumference, SBP, DBP, total cholesterol, HDL-C, C index, BMI, WHCR and WC.
Waist Circumference (m)
3
Anthropometric Indexes of Obesity as an Instrument of Screening for High Coronary Risk in Adults in the City of Salvador - Bahia
The areas under the ROC curve between C index, BMI, WHCR, WC and HCR, in people of male sex, can be observed in figure I, noting that C index shows the highest percentage under the curve among the indexes of obesity to discriminate HCR in men, with statistically significant differences among them selves (fig. 1 and tab. II).
In figure 2, it is possible to observe that, for women, the areas under the ROC curve between C index, BMI, WHCR, WC and HCR are similar for C index and WHCR, with statistically sig-nificant differences among the many indexes of obesity to discri-minate HCR (fig. 2 and tab. III).
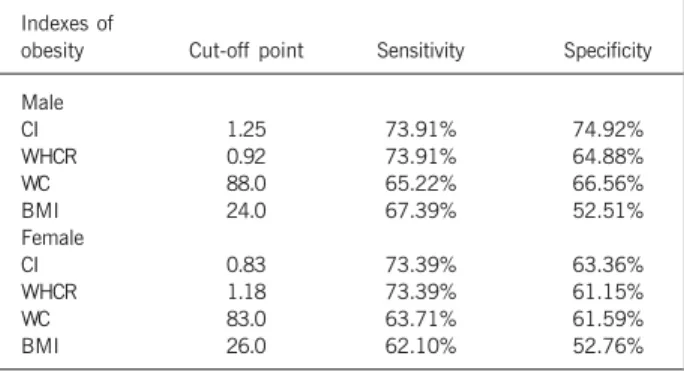
The values of sensitivity and specificity with more suitable balance among themselves, in addition to their respective cut-off points, are shown for all indexes of obesity as discriminators of HCR. It is noted that, regarding the male sex, C index is shown as the index of obesity with the best values of sensitivity and specificity to discriminate HCR. Among women, WHCR shows values discreetly greater than C index’s (tab. IV).
Discussion
Concerning the cut-off points for WC identified in the present study, the results show divergences with literature. There is a proposal for vales of WC over 102cm (men) and 88cm (women) was better cut-off points to identify obesity and HCR12. In the
analyzed sample, the use of such values would imply in a great number of people incorrectly classified, which would generate many false-negative, as the cut-off points identified in the partici-pants in the study were 88cm for men and 83cm for women.
When the comparison among the several indexes of obesity with HCR was made, it was observed that C index and WHCR are its best discriminators, despite the values of sensitivity and specificity found are not the ideal ones. There are some compara-tive studies among the many indexes of obesity as discriminators of HCR. However, studies that include the C index in this type of analysis were not found in the referred literature.
In a study carried out with 2,728 Japanese people of both
Table I - Mean, standard deviation, minimum, maximum and percentage values of the variables analyzed in the study
Men (n=391) Women (n=577) p or c²
Age (years old) 45.34±10.44 (30.0 - 73.0) 45.73±11.64 (30.0 - 74.0) 0.59 Weight (kg) 68.91±12.30 (39.10 - 124.50) 64.20±13.84 (37.00 - 143.60) 0.00
Height (m) 1.68±0.07 (144.0 - 191.0) 1.55±0.07 (100.0 - 181.0) 0.00
Waist (cm) 85.64±10.11 (62.0 - 122.80) 82.68±12.19 (43.80 - 129.30) 0.00
Hip (cm) 93.73±7.46 (71.9 - 119.0) 99.72±10.00 (77.5 - 144.0) 0.00
SBP (mmHg) 130.6±22.8 (81.5 - 238.2) 124.8±24.6 (82.2 - 229.6) 0.00
DBP (mmHg) 81.1±14.6 (55 - 143.6) 78.2±13.2 (50 - 139) 0.00
Total cholesterol (mg/dl) 220.6±52.0 (102 - 522) 232.3±52.5 (123 - 468) 0.00
HDL-C (mg/dl) 48.5±13.1 (24 - 114) 51.5±13.5 (26 - 98) 0.00
Glycemia (mg/dl) 90.5±29.2 (61 - 308) 92.0±34.4 (59 - 318) 0.48
C index 1.23±0.07 (1.01 - 1.45) 1.18±0.09 (0.59 - 1.63) 0.00
BMI (kg/m²) 24.4±3.85 (15.94 - 36.29) 26.54±5.39 (15.57 - 52.74) 0.00
WHCR 0.91±0.07 (0.73 - 1.25) 0.83±0.08 (0.43 - 1.13) 0.00
WC (cm) 85.6±10.1 (62.0 - 122.8) 82.7±12.2 (43.8 - 129.3) 0.00
Coronary Risk
Non-high 76% 79%
High 24% 21% 0.61
Educational level
Low 50% 54%
Middle/High 50% 46% 0.57
Race
Whites 24% 26%
Blacks and others 76% 74% 0.74
Continuous values were compared through the t-test of student for independent samples, and percentage values through the chi-square test; SBP - systolic blood pressure; DBP - diastolic blood pressure; HDL - C - high density lipoprotein; C index - conicity index; BMI - body mass index; WHCR - waist-hip circumference ratio; WC - waist circumference; low educational level, illiterate/never been to school, but reads and writes; middle/high educational level, fundamental, intermediate and university; c², chi-square test.
Fig. 2 - ROC curves comparing the many anthropometric indexes of obesity used in the study as discriminators of HCR (Female). C Index Conicity Index; WHCR -waist-hip circumference ratio; WC - Waist circumference; BMI - Body mass index.
C Index = 0.75 (0.70 - 0.80)
WHCR= 0.75 (0.70 - 0.80
WC = 0.66 (0.60 - 0.71) BMI = 0.59 (0.53 - 0.65)
1 - SPECIFICITY S
E N S I T I V I T Y
C Index = 0.80 (0.74 - 0.85)
WHCR= 0.76 (0.71 - 0.82
WC= 0.73 (0.67 - 0.79) BMI = 0.64 (0.57 - 0.71)
1 - SPECIFICITY S
E N S I T I V I T Y
4
Anthropometric Indexes of Obesity as an Instrument of Screening for High Coronary Risk in Adults in the City of Salvador - Bahia
Table IV - Cut - off points, sensitivity and specificity of anthropometric indexes of obesity as discriminators of HCR
Indexes of
obesity Cut-off point Sensitivity Specificity
Male
CI 1.25 73.91% 74.92%
WHCR 0.92 73.91% 64.88%
WC 88.0 65.22% 66.56%
BMI 24.0 67.39% 52.51%
Female
CI 0.83 73.39% 63.36%
WHCR 1.18 73.39% 61.15%
WC 83.0 63.71% 61.59%
BMI 26.0 62.10% 52.76%
C Index - conicity index; HCR - high coronary risk; BMI- body mass index; WHCR - waist-hip circumference ratio; WC - waist circumference.
sexes, the best cut-off points observed by the authors for BMI, WC and WHCR as discriminators of high cardiovascular risk among men were 23.5 kg/m², 84 cm and 0.90, whereas among women the cut-off points were 22.5 kg/m2, 72cm and 0.80, respectively.
The authors concluded that the central adiposity indexes discri-minate the HCR better than the total obesity indexes13.
Our results showed some similarities with the previously men-tioned study, especially in the cut-off points for BMI and WHCR among men, and WHCR among women. The cut-off point observed for WC as a discriminator of HCR among women in our study was much greater than the one shown among Japanese people.
In a similar study14, performed with approximately 80,000
Chinese individuals, the best cut-off points for BMI and WC as discriminators of HCR were identified. For the BMI, the value of 24 kg/m² was identified for both sexes, whereas for WC the value of 85 cm was identified for men and 80 cm for women. Those values were very close to those found in Salvador - Brazil.
The discriminatory power of BMI and WC, as screening tools for cardiovascular risk was analyzed in 5,149 French women15,
which found similar areas under ROC curve for both indexes of obesity, when used to discriminate women with at least one car-diovascular risk factor: 0.71 (0.69-0.73) and 0.76 (0.74-0.78) for BMI and WC, respectively. Despite the areas under the ROC curve show approximated values, the authors report that WC has a greater discriminatory power to classify HCR than BMI has. Our results demonstrate lower values in the areas under the ROC curve, probably due to the grouping of many cardiovascular risk factors in a single coronary risk index. The same authors found different areas under the ROC curve for each one of the cardio-vascular risk factors when solely analyzed.
In a study carried out in Taiwan16 to determine the best cut-off
points of many anthropometric variables as discriminators of cardio-vascular risk, 26,359 men and 29,204 women were analyzed. The following cut-off points were found to determine at least one
cardio-vascular risk factor: BMI (23.6 and 22.1 kg/m), WC (80.5 and 71.5 cm) and WHCR (0.85 and 0.76) for men and women, respectively. The values of our cut-off points were higher, which demons-trates that in Taiwan’s population the behavior of anthropometric variables as discriminators of HCR shows different characteristics from our population’s.
Other studies were carried out in the perspective of identifying cut-off points and compare the many indexes of obesity as discri-minators of cardiovascular risk factors individually analyzed. In India17, the values of 85 cm for men and 80 cm for women, for
WC, and 0.88 (men) and 0.81 (women) for WHCR were identified as cut-off points to discriminate diabetes.
In another work, with the aim of comparing C index and BMI was hyperglycemia discriminators, in 1,325 adults in the city of Salvador-BA, C index was found with a greater discriminatory po-wer than BMI, with areas under the ROC curve of 0.71 (0.66-0.77) and 0.62 (0.57-0.67), respectively18.
In another study19, using the same population, C index and BMI
were compared as systolic hypertension, finding areas under ROC curve without statistically significant differences, showing that the discriminatory power for HCR between C index and BMI is similar. One of the limitations of the present study was the HCR clas-sification using the proposed algorithm based on the cohort of Framinghan9. We used that algorithm by applying its values in the
individuals participating in our sample and define that HCR would be identified through points refereeing to the percentile 80 in the percentile distribution of the study population itself. There are controversies concerning the ideal points for identification of HCR in a short term. There are also suggestions20 that the HCR could
be identified through the points equivalent to 20% from absolute risk for coronariopathy in the next 10 years, which would be equivalent to 9 points for men and 15 points for women, in the proposed algorithm based on the cohort of Framinghan9. In our
study, HCR was identified through the cut-off point of 8 points for men and 10 points for women.
Recent studies have demonstrated that the long-term pre-diction of HCR, done through the proposed algorithm based on the cohort of Framinghan9, can be generalized for other
popu-lations, as well as used in cross-section studies. The generali-zation for other populations must be done after re-gauging for different prevalences of risk factors involved in the analysis21, 22.
Table II - Comparison of the areas under ROC curves - Male
Indexes of
obesity and HCR Area CI (95%) p value
CI and HCR 0.80 0.74 - 0.85 WHCR and HCR 0.76 0.71 - 0.82 WC and HCR 0.73 0.67 - 0.79
BMI and HCR 0.64 0.57 - 0.71 0.00
CI - conicity index; HCR - high coronary risk; BMI - body mass index; WHCR waisthip circumference ratio; WC waist circumference; CI -confidence interval.
Table III - Comparison of the areas under ROC curves - Female
Indexes of
obesity and HCR Area CI (95%) p value
C Index and HCR 0.75 0.70 - 0.80 WHCR and HCR 0.75 0.70 - 0.80 WC and HCR 0.66 0.60 - 0.71
BMI and HCR 0.59 0.53 - 0.65 0.00
5
Anthropometric Indexes of Obesity as an Instrument of Screening for High Coronary Risk in Adults in the City of Salvador - Bahia
Concerning the variables used in the proposed algorithm, the cut-off point adopted for diabetes was the value of 140mg/dl, whereas in this study the value was 126mg/dl, considering the recent suggestions from many scientific associations23, 19, 24.
Many other variables can be included in predictive models of coronary risk. Early familial history of CAD, despite being strongly associated to coronary events, is not available in the subjects analyzed in the proposed algorithm based on the cohort of Framinghan8.
The fibrinogen has been associated to cardiovascular risk23, but it
is not also available in the previously mentioned study8. Besides,
due to its high biological variability and absence of corroboration that specific interventions decrease the cardiovascular risk, its routine determination is not recommended 23. Left ventricular hypertrophy,
observed through ECG, has been used in algorithms for prediction of CAD. However, considering its high association with hypertension, it was not used in the previously mentioned algorithm8.
On the other hand, when the comparison of different analysis methods of HCR was made, the incorporation of total cholesterol/ HDL-C ratio in the algorithms for classification of HCR25 is
sug-gested. In our study, the total of points of total cholesterol sepa-rately from HDL-C was used.
According to the results found, there were evidences that the central obesity indexes, especially C index and WHCR, are better to discriminate HCR than indexes of general obesity (BMI). WC was a reasonable performance, despite many studies have de-monstrated that it is a powerful discriminator of HCR (data were not confirmed in our observations). Those results suggest that abdominal obesity indexes are better to discriminate HCR than the indexes of general obesity. New studies with infants, adolescents and adults from different age groups are suggested to identify and compare the discriminatory power of anthropometric indexes of obesity and HCR in such specific subgroups.
1. Lessa I. O Adulto brasileiro e as doenças da modernidade: epidemiologia das doenças crônicas não-transmissíveis. São Paulo: Editora Hucitec-Abrasco; 1998. 2. Vague J. The degree of masculine differentiation of obesities: A factor determining predisposition to diabetes, atherosclerosis, gout, and uric calculous disease. Am J Clin Nutr 1956; 4: 20-34.
3. Larsson B, Svardsudd K, Welin L, Wilhelmsen L, Bjorntorp P, Tibblin G. Abdomi-nal adipose tissue distribution, obesity, and risk of cardiovascular disease and death: 13 year follow up of participants in the study of men born in 1913. Br Med J 1984; 288: 1401-4.
4. Gustat J, Elkasabany A, Srinivasan S, Bereson S. Relation of abdominal heigth to cardiovascular risk factors in young adults. Am J Epidemiol 2000; 151: 885-91. 5. Visscher Tl, Seidell JC, Molarius A, Van Der Kuip D, Hofman A, Witteman JC. A comparison of body mass index, waist-hip ratio and waist circumference as pre-dictors of all-cause mortality among the elderly: The Rotterdam study. Int J Obes Relat Metab Disord 2001; 25: 1730-5.
6. Poulter N. Global risk of cardiovascular disease. Heart 2003; 89 (suppl 2): 112-5. 7. Centro Nacional de Epidemiologia, Fundação Nacional de Saúde. Projeto Monit:
Relatório de Pesquisa. Brasília: MS; Salvador: ISC/UFBA; 2000.
8. Valdez R. A simple model-based index of abdominal adiposity. J Clin Epidemiol 1991; 44: 955-6.
9. Wilson PWF, D’Agostino RB, Levy D, Belanger AM, Silbershatz H, Kannel WB. Prediction of coronary heart disease using risk factores categories. Circulation 1998; 97: 1837-47.
10. Erdreich LS, Lee ET. Use of relative operating characteristics analysis in epidemiolo-gy: a method for dealing with subjective judgement. Am J Epidemiol 1981; 114: 649-62.
11. Schisterman EF, Faraggi D, Reiser B, Trevisan M. Statistical inference for the area under the receiver operating characteristic curve in the presence of random mea-surement error. Am J Epidemiol 2001; 154: 174-9.
12. NHLBI Obesity Education Initiative Expert Panel. Clinical Guidelines on Identifica-tion, Evaluation and Treatment of Overweight and Obesity in Adults. The Evidence Report. Bethesda, Md: National Institute of Health, National Heart, Lung and Blood Institute; 1998.
13. Ito H, Nakasuga K, Ohshima A et al. Detection of cardiovascular risk factors by indices of obesity obtained from anthropometry and dual-energy x-ray absorptio-metry in Japanese individuals. Int J Obes Relat Metab Disord 2003; 27: 232-7.
14. Bei-Fan Z. Predictives values of body mass index and waist circumference for risk factors of certain related disease in Chinese adults: study on optimal cut-off points of body mass index and waist circumference in Chinese adults. Asia Pac J Clin Nutr 2002; 11(suppl 8): S685-93.
15. Foucan L, Hanley J, Deloumeaux J, Suissa S. Body mass index (BMI) and waist circumference (WC) as screening tools for cardiovascular risk factors in Guadeloupean women. J Clin Epidemiol 2002; 55: 990-6.
16. Lin WY, Lee LT, Chen CI et al. Optimal cut-off values for obesity: using simple an-thropometric indices to predict cardiovascular risk factors in Taiwan. Int J Obes Relat Metab Disord 2002; 26: 1232-38.
17. Snehalatha C, Viswanathan V, Ramachadran A. Cutoff values for normal anthro-pometric variables in Asian Indian adults. Diabetes Care 2003; 26: 1380-4. 18. Pitanga FJG, Lessa I. Análise da Sensibilidade e Especificidade entre Índice de
Co-nicidade, Índice de Massa Corporal e Hiperglicemia em Adultos de ambos os sexos. In: Resumos do XV Congresso de Cardiologia do Estado da Bahia; 2003; Salva-dor: Sociedade Brasileira de Cardiologia; 2003a: p. 13.
19. Pitanga FJG, Lessa I. Análise da Sensibilidade e Especificidade entre Índice de Co-nicidade, Índice de Massa Corporal e Hipertensão Arterial Sistólica em Adultos de ambos os sexos. In: Resumos do XV Congresso de Cardiologia do Estado da Bahia; 2003; Salvador: Sociedade Brasileira de Cardiologia; 2003b: p. 14. 20. Grundy SM, Pasternak R, Greenland P, Smith S, Fuster V. Assessment of
cardio-vascular risk by use of multiple-risk-factor assessment equations. J Am Coll Cardiol 1999; 34: 1348-59.
21. D’Agostino RB, Grundy S, Sullivan LM, Wilson P. Validation of the Framingham co-ronary Herat disease prediction scores. JAMA 2001; 286:180-7.
22. Cappuccio FP, Oakeshott P, Kerry SM. Application of Framingham risk estimates to ethnic minorities in United Kingdom and implications for primary prevention of heart disease in general pratic: cross sectional population based study. Br Med J 2002; 325: 1271-80.
23. American Diabetes Association. Report of the expert committee on diagnosis and classification of diabetes mellitus. Diabetes Care 1997; 20: 1183-202. 24. Sociedade Brasileira De Cardiologia. III Diretrizes Brasileiras sobre dislipidemias
e diretriz de prevenção da aterosclerose do Departamento de Aterosclerose. Arq Bras Cardiol 2001; 77(Suppl 3).
25. Haq IU, Ransay LE, Jackson PR, Wallis EJ. Prediction of coronary risk for primary pre-vention of coronary heart disease: a comparison of methods. QJM 1999; 92: 379-85.