• Nenhum resultado encontrado

J. Braz. Chem. Soc. vol.21 número9

N/A
N/A
Protected

Academic year: 2018

Share "J. Braz. Chem. Soc. vol.21 número9"

Copied!
4
0
0

Texto

(1)

Article

J. Braz. Chem. Soc., Vol. 21, No. 9, 1688-1691, 2010. Printed in Brazil - ©2010 Sociedade Brasileira de Química 0103 - 5053 $6.00+0.00

*e-mail: cdmunozc@uc.cl

Stripping Voltammetric Determination of Cadmium in Sea Water using a Carbon

Paste Electrode Modiied with Alginic Acid from Brown Algae

Carolina Muñoz,* Manuel Zúñiga and Verónica Arancibia

Facultad de Química, Pontiicia Universidad Católica de Chile, 7820436, Santiago, Chile

A concentração do cádmio em um meio aquoso foi determinada usando-se um elétrodo de carbono ácido-modiicado de pasta de alginina. O elétrodo de trabalho foi preparado usando-se uma mistura homogênea de pó de graite, alginina ácida (AA) e óleo mineral. A voltametria de onda quadrada com redissolução anódica (SWASV) usando-se este elétrodo modiicado, mostrou uma onda anódica bem deinida com pequena oxidação do AA em −0,05 V. O sinal é deslocado para um potencial menos positivo e a corrente máxima aumentou na presença do CdII. Após a otimização

das condições experimentais, a corrente máxima anódica do CdII-AA mostrou ser linear com sua

concentração até ca. 30.0 µg L-1, com limite de detecção de 0.9 µg L-1 em pH 2.0 (HNO

3. tacc = 60 s,

Eacc = −0.80 V). O método foi validado com a determinação de Cd

II em água do mar sintética

enriquecida (ASTM D665). O elétrodo modiicado mostrou boa estabilidade e repetibilidade.

Cadmium concentration in an aqueous medium is quantiied using an alginic acid-modiied carbon paste electrode. The working electrode was prepared using a homogeneous mixture of graphite powder, alginic acid (AA) and mineral oil. Square wave anodic stripping voltammetry (SWASV) using this modiied electrode showed one small well-resolved anodic wave for the oxidation of AA at –0.05 V. This signal shifts toward less positive potential and peak current increases in the presence of CdII. After optimizing the experimental conditions, the anodic peak

current of CdII-AA was linearly related to its concentration up to ca. 30.0 µg L-1, with a detection

limit of 0.9 µg L-1 at pH 2.0 (HNO

3.tacc = 60 s, Eacc = −0.80 V). The method was validated by

determining CdII in spiked synthetic sea water (ASTM D665). The modiied electrode showed

good stability and repeatability.

Keywords: alginic acid, carbon paste electrode, cadmium, SWASV

Introduction

Alginic acid is the common name given to a family of linear polysaccharides containing 1,4-linked

β-D-mannuronic acid (M) and α-L-guluronic acid (G), whose pKa are 3.38 and 3.65, respectively. Alginic acid occurs in all brown algae, where it may be present in both the cell wall matrix and in the mucilage or intercellular material, and it makes up between 10 and 40% of the algae's dry weight (untreated). The ratio of mannuronic and guluronic groups and the afinity for metals ions vary with the type of algae and the part of the plant from which the polysaccharide is extracted. The presence of these G-blocks results in an enhanced selectivity for cadmium or calcium relative to monovalent ions such as sodium as well as to protons and smaller divalent ions such as magnesium.

When the guluronic acid content is increased, the afinity of alginates for cations such as Pb2+, Cu2+, Cd2+, Zn2+, Ca2+, etc is higher. The major mechanisms include ionic interactions and the formation of complexes between metallic cations and groups contained in the alginic acid. Among the diverse and natural ligand availability, algae have already proved to be the most promising for heavy metal recovery.1-6

(2)

Muñoz et al. 1689 Vol. 21, No. 9, 2010

Experimental

Apparatus

All the voltammetric measurements were carried out using a self-made carbon paste electrode modiied with alginic acid as a working electrode, Ag/AgCl 3 mol L-1 KCl as the reference electrode, and platinum wire as the auxiliary electrode. SWASV experiments were performed on a CV50W Voltammetric analyzer electrochemical system (Bioanalytical Systems. USA). The measurements were made at room temperature and dissolved oxygen was removed with bubbling Argon. For pH measurements an Orion 430 pH meter was used.

Reagents and solutions

All solutions were prepared with Milli-Q water (18.2 MΩ). Standard stock solutions of 1 µg mL-1 of cadmium were prepared from standard cadmium 1000 µg mL-1 solution (Merck, Darmstadt, Germany). Alginic acid sodium salt from brown algae (CAS 9005-38-3) was obtained from Sigma. Nitric acid was obtained from Merck. Synthetic sea water (ASTM D665 Aldrich, USA) was used for validation of the method.

Electrode preparation

Modified carbon paste electrodes (MCPEs) were prepared with different alginate/graphite ratios by thoroughly homogenizing with parafin in an agate mortar and pestle. The mixture was then packed in a cylindrical plastic tube used for insulin treatment (1.0 mL and internal diameter 4 mm) and connected to a copper wire to provide the electric contact. Before use the electrodes were polished with paper card and used immediately.

Procedure

10.0 mL of water, 100 µL of 1 mol L-1 HNO 3, and different volumes of 1.0 µg mL-1 cadmium solution were pipetted into the voltammetric cell. The air present in the solution was removed with bubbling argon (saturated with water vapor) for 5 min and then an accumulation potential (Eacc) was applied to the freshly prepare modiied carbon paste electrode while the solution was stirred (700 rpm). After the accumulation period (tacc), the stirring was stopped, and after 10 s the Osteryoung square wave stripping voltammogram was recorded by applying a positive-going scan between −0.80 and 1.00 V with 5 mV step amplitude, 50 mV pulse amplitude, and

a frequency of 15 Hz. The method was validated by determining CdII in spiked synthetic sea water (ASTM D665).

Limit of detection (LOD)

The limit of detection was calculated using the approximation of Miller and Miller7 for calibration curves. Minimum signal (ymin) = a + 3Sy/x, where a = intercept and S

y/x = standard deviation of the calibration curve.

Results and Discussion

Effect of solution pH

The irst step of this study was to ind out the inluence of pH on the peak current in the 2.0 to 10.0 range using Britton Robinson buffers. However, it was found that at acid pH adjusted with nitric acid peak current of Cd-AA had adequate values. Figure 1A shows the stripping voltammogram of the carbon paste electrode (blank) in a 0.01 mol L-1 HNO

3 solution and Figure 1B shows a voltammogram of the alginic acid modiied carbon paste electrode (alginate/graphite powder 40/60). As shown in the igure, alginic acid (AA) has an oxidation peak at −0.05 V. When a trace amount of cadmium is added to the electrochemical cell (Figure 1C), the oxidation peak potential of AA shifts to less positive potential values (P1), close to −0.09 V, depending on the cadmium concentration, and the peak current of AA increases greatly, while a new small and broad oxidation peak is seen at more positive potential values (P2, 0.19 V) due to the CdII presence.

Figure 1. (A) Stripping voltammogram of carbon paste electrode;

(B) carbon paste electrode modiied with alginic acid 60/40 (m/m); (C) B in the presence of 4.9 µg L–1 cadmium. pH 2 (HNO

(3)

Stripping Voltammetric Determination of Cadmium in Sea Water using a Carbon Paste Electrode J. Braz. Chem. Soc. 1690

Alginic acid can be oxidized to the corresponding polymeric dialdehyde acid, which undergoes hydrolysis in dilute acid.8 These measurements were made at different alginate/graphite ratios, and the best results were obtained at 40/60 (m/m). When the amount of alginate is higher the modiied electrode becomes swollen and the results obtained are not reproducible.

Effect of accumulation potential

The inluence of the variation of the accumulation potential on the peak current (P1 and P2), examined over the 1.00 to −1.00 V range, is shown in Figure 2. While the peak current P2 is almost constant over the whole potential range, with a slight increase when an accumulation potential of 0.10 V was applied, the largest peak current P1 was obtained at more positive accumulation potentials (1.00 V) and it decreased substantially if the accumulation potential was more negative approaching −0.20 V, and then the peak current started increasing again. If an accumulation potential of 1.0 V is applied, the peak current obtained is more intense, however the signal is very broad and reproducibility is poor. A value of −0.80 V was applied to later measurements and the potential was scanned in a positive direction (−0.80 to 1.00 V).

Effect of accumulation time

As shown in Figure 3, the peak current of signal P2 is independent of accumulation time, while the peak current of signal P1 increased linearly with increasing accumulation time from 0 to 120 s. Subsequent experiments were performed with an accumulation time of 60 s in order to avoid extending the time of analysis.

Linear range, limit of detection, reproducibility

The calibration graph for the determination of CdII was obtained under the optimized conditions: 40/60 alginate/ graphite ratio, pH 2.0 (adjusted with HNO3 solution), Eacc = − 0.80 V and tacc = 60 s. The peak currents P1 and P2 were proportional to the concentration of cadmium over the 0.0-40.0 µg L-1 and 0.030.0 µg L-1 range, respectively (R = 0.991 and R = 0.997), and the detection limit obtained was 0.9 µg L-1 (R = 0.997, n = 6, E

peak = − 0.09 V). Figure 4 shows the calibration curve in Milli-Q water.

Interference studies and validation of the method

10.0 mL of synthetic sea water spiked with cadmium (4.0 µg L-1) was added in the electrochemical cell (0.01 mol L-1 HNO

3). Anodic stripping voltammograms

Figure 2. Effect of varying accumulation potential (1.00 to − 0.80 V) on

peak stripping current of 4.9 µg L–1 cadmium. t

acc = 60 s; pH 2.0. P1: peak current to − 0.09 V; P2: peak current to 0.19 V.

Figure 3. Effect of varying accumulation time (0 to 120 s) on peak

stripping current of 4.9 µg L–1 cadmium. E

acc = −0.80 V; pH 2.0. P1: peak current to −0.09 V; P2: peak current to 0.19 V.

Figure 4. Effect of varying cadmium concentration (2.0; 3.9; 5.9; 7.9; 9.8

(4)

Muñoz et al. 1691 Vol. 21, No. 9, 2010

were obtained and then aliquots of CdII standard solution were added using the standard addition method. The results obtained for cadmium were 3.8 ± 0.3 µg L-1. For the interference study an aliquot of synthetic Milli-Q water was contaminated with CdII, PbII, CuII, ZnII, AlIII and AsIII standard solution at equal concentration (10.0 µg L−1), and the analysis of CdII was carried out using the standard addition method. Under these conditions CuII, ZnII, AlIII and AsIII did not show signals between 0.80 to 1.0 V, but PbII showed a signal at 0.26 V. If PbII concentration is 50 times higher than that of CdII, only one signal is seen for the two metal ions.

Conclusions

This paper shows the feasibility of determining cadmium in contaminated sea water samples using an alginate-modiied carbon paste electrode. Other advantages of the proposed method are the low cost and easy preparation of the electrode. This method appears to be a promising analytical tool for the determination of cadmium in contaminated natural waters.

Acknowledgements

Financial support from the Fondo Nacional de Desarrollo Científico y Tecnológico (FONDECYT. Project No 1080524) and from the Comisión Nacional de Investigación Cientíica y Tecnológica (CONICYT) for a PhD scholarship is gratefully acknowledged.

References

1 Davis, T. A.; Volesky, B.; Mucci, A.; Water Res. 2003, 37, 4311. 2 Haug A.; Acta Chem. Scand. 1961, 15, 1794.

3 Haug A.; Larsen B.; Smidsrod O.; Carbohyd. Res. 1974, 32, 217.

4 Haug A.; Smidsrod O.; Acta Chem. Scand. 1965, 19, 341. 5. Davis, T.; Llanes, F.; Volesky, B.;Mucci, A.; Environ. Sci.

Technol. 2003, 37, 261.

6. Fourest, E. and Volesky, B.; Environ. Sci. Technol. 1996, 30, 277.

7 Miller, J. C.; Miller, J. N.; Statistics for Analytical Chemistry, 2nd edition, Ellis Horwood: London, 1988.

8 Lucas, H. J.; Stewart, W. T.; J. Am. Chem. Soc. 1940, 62, 1792.

Submitted: September 9, 2009

Imagem

Figure  1.  (A)  Stripping  voltammogram  of  carbon  paste  electrode;
Figure 2. Effect of varying accumulation potential (1.00 to − 0.80 V) on  peak stripping current of 4.9 µg L –1  cadmium

Referências

Documentos relacionados

In this new scenario, the main challenge at the nation level is having a State agenda for education, science, technology and innovation, with relevant development

of glucosyl carboxylic groups of GL with aminoacid derivatives such as Cyz(Bz)OH, Cyz(Bz)-Val(OH), glycine ethyl ester, alanine butyl ester or valine butyl

Rongalite ® promotes cleavage of diaryldisulides generating the corresponding chalcogenolate anions that then undergo facile reaction with N -acylbenzotriazoles in the presence of

As far as we know, the high degradation capacity shown by DSA electrodes used in the presence of reactive electrolytes, such us sodium chloride, is due to electrochemical generation

SPA-LDA and GA-LDA selected 10 and 12 variables (potential values in the voltammograms), respectively, whereas the PLS2 model employed 14 latent variables. By applying

We have found that steric effects had a little inluence on the coupling reaction since boronic acids containing 2-methylphenyl or naphtyl group, gave similar yields

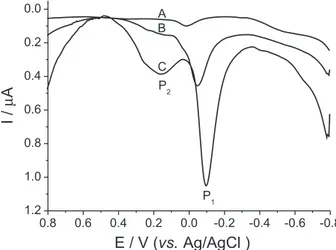
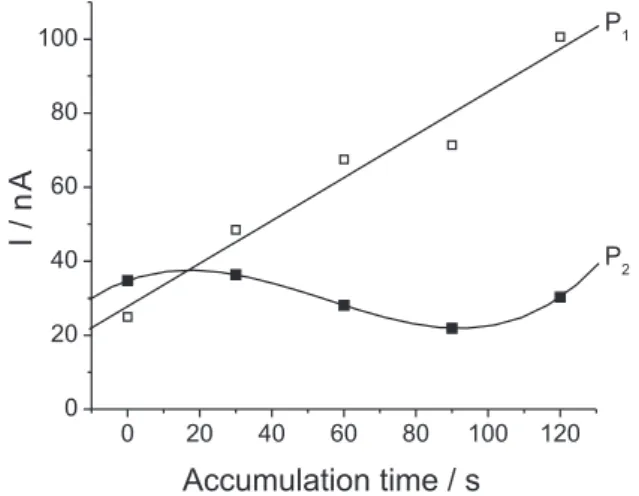
For this purpose, internal standard and standard addition methods were used for the measurement of 2,6-DCP in the hexane extract of attractive females from two

In this study, we have shown by using electrochemical impedance spectroscopy and surface plasmon resonance that peroxidase enzyme adsorbed on the ds-DNA layer on modiied