Ar
ti
cl
e
0103 - 5053 $6.00+0.00
*e-mail: [email protected]
Kinetic Studies of HRP Adsorption on ds-DNA Immobilized on Gold Electrode
Surface by EIS and SPR
Danielle C. M. Ferreira,* Renata K. Mendes and Lauro T. Kubota
Instituto de Química, Universidade Estadual de Campinas, Unicamp, CP 6154, 13083-970 Campinas, SP, Brazil
Este trabalho descreve a construção de um ilme de multicomponentes via método layer-by-layer (LbL) e a análise cinética da interação da enzima peroxidase de raiz forte (HRP) sobre a camada de ds-DNA de timo de bezerro formada numa superfície de ouro modiicada. As técnicas de ressonância de plásmon de superfície (SPR) e a espectroscopia de impedância eletroquímica (EIE) foram usadas para caracterizar a construção do ilme sobre a superfície de ouro. A ressonância de plásmon de superfície forneceu informações essenciais para o estudo e caracterização da interação proteína e ácido nucléico. Este método não necessita de marcador e monitora as interações em tempo real. Os estudos cinéticos obtidos por SPR da formação do ilme de HRP sobre o ds-DNA apresentaram valores de 24,7 L mol-1 s-1 e 1,2×10⁻³ s-1 para k
a e kd, respectivamente. A energia livre de Gibbs obtida para o sistema foi de - 23,1 kJ mol-1. Os resultados obtidos mostram que a interação das moléculas da enzima sobre o ds-DNA é cinética e termodinamicamente favoráveis e a interação entre as camadas ocorre principalmente pela atração de cargas opostas.
This paper describes the construction of a multicomponent ilm via layer-by-layer (LbL) method and the kinetic analysis of the interaction between horseradish peroxidase (HRP) enzyme on calf thymus double-stranded DNA layer on a modiied gold surface. Surface plasmon resonance (SPR) and electrochemical impedance spectroscopy (EIS) are used to characterize the successful construction of the ilm on the gold surface. Surface plasmon resonance provided essential information for the study and characterization of protein and nucleic acid interaction and this method is label-free and monitors the interactions in real time. The kinetic studies determined by SPR of the horseradish peroxidase ilm formation on ds-DNA layer showed values of 24.7 L mol-1 s-1 and 1.2×10⁻³ s-1 for k
a and kd, respectively. The Gibbs free energy obtained for the system was
−23.1 kJ mol-1. The results obtained show that the interaction of the enzymes molecules on ds-DNA is kinetically and thermodynamically favourable and the interaction among the layers probably occurs mainly by attraction of opposite charges.
Keywords: SPR, EIS, kinetic adsorption, DNA, HRP, protein-DNA interaction
Introduction
The interaction of nucleic acids with protein has been a primary area of interest for therapeutic development and in the study of cellular processes.1-3 Development of
devices based on this interaction presents application in the investigations of the toxicity pathways of nucleic acid. Recently, electrochemical sensors have been developed for the rapid detection of DNA damage.4-7 Such devices are
being successfully used in food industry, environmental ields and clinical chemistry. Biosensors for such analysis can be prepared with multicomponent ilms of polyions
and other charged materials and to achieve high speciicity, high sensitivity, rapid response and lexibility of use, it is clear that the research continues to focus on new assembly strategies. In this sense, layer-by-layer assembly is a comparatively new method by which thin ilms particularly of oppositely charged layers are deposited. There are many advantages of layer-by-layer assembly technique and these include simplicity, universality and thickness control in nanoscale. Layer-by-layer assembly process does not require highly pure components and sophisticated hardware and its properties can be controlled by choosing molecules and number of layers.8-10 Although most of
with multilayers formed on quartz crystal microbalance,8,11
surface plasmon resonance12,13 or electrochemical14,15
detection techniques.
Construction of multilayer ilms usually relies on the electrostatic attraction between positively and negatively charged materials, although other interactions can be exploited thus as including hydrogen bonding, charge transfer interactions and stereo-complex formation.16,17
Therefore, the materials choice and optimization of experimental variables such as ionic strength and pH are important factors for the construction of these layers. The LbL technique has been found as a highly useful way for assembling a number of organic and inorganic compounds, including proteins, DNA, dendrimers and nanoparticles. The organized multilayer architectures have attracted great interest because of their broad range of applications in the ields of biosensors, nonlinear optical devices and surface modiication.12,13,18-21
Interest in dendrimers has grown in the last decade due to the use of these molecules in numerous industrial and biomedical applications. Dendrimers are different from traditional polymers; they have a multi-branched, three dimensional architecture with very low polydispersion ability and high functionality. A great number of dendrimer structures have been developed and investigated based on inspiration in the biological systems, among them polyamidoamine (PAMAM) polymers. Particular interest is devoted to the fourth generation one due to its spherical structure and good biocompatibility, which can provide a lexible space created within the voids of dendritic building blocks, which can possibly encapsulate various small guest molecules.23,24 In previous works, the formation of
PAMAM and PAMAM/ds-DNA layer on gold surface was investigated.25-27
Biological compounds including DNA, RNA, enzymes and proteins can be regarded as natural charged functional polymers. They are also widely used in the layer-by-layer multilayer formation.8,28,29 Therefore, characterization
of DNA-protein interactions is of great importance in the study of biological processes, mainly in biosensors, employing DNA-enzyme layer-by-layer films. These devices show great potential in predicting genotoxicity of drugs and environmental chemicals, thus future tools in chemical product development studies are very important.18
Schubert et al.3 reported kinetic and thermodynamic
characterizations of the ss-DNA and replication protein A using SPR and luorescence correlation spectroscopy. However, no studies about the kinetics adsorption of horseradish peroxidase and ds-DNA were reported.
Surface plasmon resonance is a method that can be used to monitor the interactions between biomolecules.30-32
Continuous monitoring of the SPR signal allows studying the kinetics of binding in real time. The main advantage of SPR is that no particular property of the interacting molecules is required; being possible to determine the true association and dissociation rates of the complex formation.1-3,33
Thus, in the present study IES and SPR techniques were employed to systematically investigate the layer-by-layer formation in the kinetic and thermodynamic point of view.
Materials and Methods
Materials
Generation 4 of polyamidoamine (PAMAM) dendrimers was purchased from Sigma Aldrich Company. Deoxyribonucleic acid, from calf thymus, peroxidase from horseradish, and 3-mercapto propionic acid (MPA) were purchased from Sigma. Ethanol was obtained from Synth, Brazil. K3[Fe(CN)6] and K4[Fe(CN)6] were acquired from J.T. Baker, USA. All chemicals were of analytical grade and used as received. Phosphate buffer solutions were obtained by mixing solutions of 0.2 mol L-1 Na
2HPO4 and 0.2 mol L -1
NaH2PO4 and acetate ones were obtained by mixing 0.2 mol L-1 C
2H4O2Na and 0.2 mol L -1 C
2H4O2. All solutions
were prepared with deionized water (> 18 MΩ cm, Milli-Q, Millipore).
Apparatus
EIS
All electrochemical experiments were carried out in a conventional three-electrode cell at room temperature using a saturated calomel electrode (SCE) and Pt wire as reference and counter electrodes, respectively. The geometric area of the gold working electrode (Metrohm 6.1204.020, Switzerland) was 0.07 cm2. The impedance measurements
were performed using a potentiostat PGSTAT 30 model from AUTOLAB (Eco Chemie, Netherlands) interfaced with a computer.
SPR
The biomolecular interactions were investigated using a SPR system (Autolab Spirit®, Eco Chemie, Netherlands).
Planar gold SPR disks were purchased from Xantec Bioanalytics (Germany). This equipment is based on the Kretschmann coniguration, which is the most commonly-used. The washing solutions were injected in the optical cell using a peristaltic pump at a low rate of 100 μL min-1. The
steps. The response of the sensor was automatically monitored using a PC with ESPRIT software version 4.1.2.
Modiication procedure
Preparation of the self-assembled monolayer (SAM) The cleaning of the bare gold surface is critically important for self-assembled monolayer formation and should be accomplished systematically. The gold disk was immersed in a piranha solution (1:3 mixture of 30% H2O2:concentrated H2SO4) for 5 min. Then, the disk was washed with copious amount of water. After that, the bare gold disk was placed onto the prism of the SPR system and illed with buffer. The resonance angle at this point was recorded as the baseline. A SAM layer of thiols was prepared on the bare gold surface injecting 100 μL of 10 mmol L-1 3-mercapto propionic acid solution
freshly prepared in ethanol into the cell, and the change of resonance angle was monitored during 120 min of deposition. The time required for SAM formation was optimized in a previous work.34
Layer-by-layer on the sensor
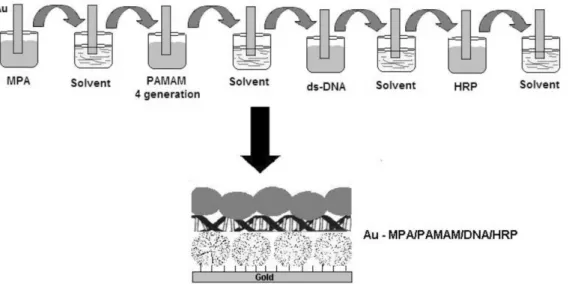
Alternating layer-by-layer electrostatic adsorption was used to assemble dendrimer, DNA and enzyme ilms. These ilms were prepared by assembly method.35 After cleaning
the gold surface, layers of PAMAM, ds-DNA and enzyme were adsorbed alternately on the gold surface for 15-20 min, rinsing with their respective solvent between adsorption steps Figure 1. Adsorbate solutions were as follows: (a) 2% PAMAM generation 4; (b) 1-2 mg mL-1 DNA and
(c) 0.5-5 mg mL-1 horseradish peroxidase in milli-Q water
or phosphate (pH 6.8) or acetate buffer (pH 4.3).
Impedance measurements
For impedance studies, a sine wave with 10 mV of amplitude was applied to the electrode over the formal potential of the Fe(CN)63−/4− redox couple (0.2 V).
Impedance spectra were recorded in the frequency range varying from 100 kHz to 100 mHz. Electrochemical impedance spectra were itted using an equivalent circuit contained on the FRA software AUTOLAB (Eco Chemie, Netherlands) and the resistance of charge transfer (Rct) values were determined in a pH 4.3 acetate buffer using 5 mmol L-1 of Fe (CN)
6
3–/4– as redox probe.
Results and Discussion
Impedance measurements
Electrochemical impedance spectroscopy is an effective tool to monitor the binding of biomolecules on the electrode surface. The formation of biolayers disturbs the double-charged layer at the electrode/electrolyte interface resulting in the increase of thickness and the insulating character of the electrode surface in relation to the redox probe added to the solution. These changes affect the capacitance and the electron transfer at the electrode interface. At higher frequencies in Nyquist plot, squeeze semicircles represent the electron transfer limited process, followed by a diffusionally limited redox process at lower frequencies.36 The diameter of this semicircle,
which exhibits the change of the capacitance and interfacial electron transfer resistance (Rct) of the electrodes, can be used as one powerful tool for probing the features of surface-modiied electrodes.37 Randle’s equivalent circuit
was adopted to model the physiochemical process occurring at the gold electrode surface, which is often used to model the interfacial phenomena: Rs(CPE[RctW]) where Rs is the resistance of the solution, Rct is the resistance of charge-transfer, W is the Warburg impedance and CPE is a double layer capacitance for constant phase element.38
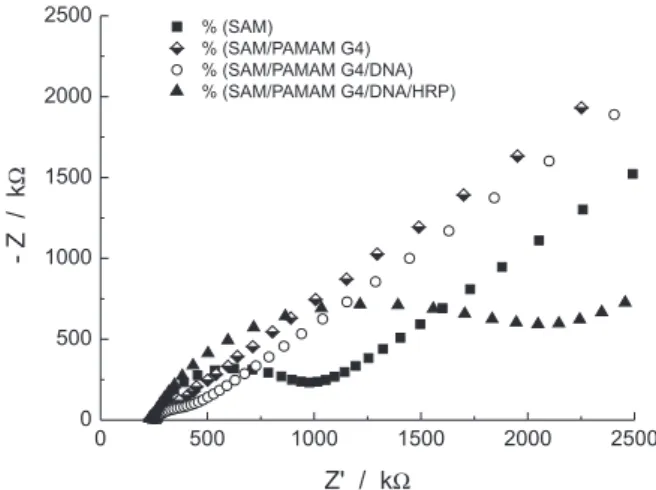
As shown in Figure 2, the gold surface modiied with MPA produces a SAM with a large quantity of negative charges from –COO- groups, which is a barrier to electron
transfer rates between the electrode and [Fe(CN)6]3−/4− probe
solution. After this step, the adsorption of PAMAM, the positively charged polymer molecule, was performed. The surface becomes positive and would attract the negative charges of Fe(CN)63−/4−decreasing the R
ct values, 27
according to Table 1. When the surface is sequentially modiied with ds-DNA there is an increase in the Rct values because they generate an insulating layer on the modiied surface, which makes the electron transfer more dificult. This should be attributed to the repulsive electrostatic interaction increasing the resistance of charge transfer due to the anionic charge of the ilm and probe.39-41 After
the HRP adsorption, there is a new increase in the Rct due to formation of a nonconducting layer. Thus, these data conirm the layers formation.
SPR studies of the layers formation on gold surface
An important application of SPR technique is the possibility to perform quantitatively the biomolecular interaction by the rate constants and by the equilibrium constants.1,3,32 An SPR interaction plot generally contains
three steps: the association, the dissociation and regeneration ones. The association and dissociation steps can be used to determine the rate constants and thereby the equilibrium constants. In an interaction plot, the maximal amount of analyte response is proportional to the ratio of the molecular quantity of analyte and ligand. For SPR system of the Autolab, 1 milli-degree of SPR angle change corresponds to 8.3 resonance unit (RU).
In SPR analysis the low concentrations create detection problems due to its sensitivity. However, most of the compounds of interest have molecular weights of 300 Daltons or more, mainly biological compounds. Thus, this technology is a very attractive method to study biomolecules interactions with specific nucleic acid sequences and immobilized structures to form a biospeciic target surface. Figure 3 shows the SPR sensorgrams recorded during each sample injection over a SAM of 3-mercaptopropionic acid. The process of formation of each studied layer was related from the baseline changes before and after sample injection. Thereby, Figure 3 shows a clear stepwise increase in the SPR angle by injection of each component indicating the formation of the layers of PAMAM, ds-DNA and HRP, respectively. Several experimental conditions were investigated varying both the concentrations of the compound and the solvent used. The experiments were carried out at room temperature. Initially, the effect of the solvent was investigated and pure water, phosphate (pH 6.8) and acetate buffers (4.3) were tested. The best condition obtained by SPR response was in acetate buffer at pH 4.3. Since the variation of buffer solution and pH inluenced the formation of complex, the interaction among the layers probably occurs mainly by attraction of opposite charges.
The SPR response can be converted to a protein loading according to the relationship: 120 mdegree = 1 ng mm-2.42
According to this relation, an amount of 5.50 ng mm-2
of enzyme was absorbed on the ds-DNA surface when a 5 mg mL-1 solution of enzyme in acetate buffer at pH 4.3
was employed. However, when phosphate buffer was used at pH 6.8 just 0.16 ng mm-2 was adsorbed on the ds-DNA
surface. The surface concentration of HRP-ds-DNA ilm Table 1. Rct values obtained for different layers formed on gold electrode
surface in 5 mmol L-1 Fe(CN) 6
3–/4– in pH 4.3 acetate buffer solution for the frequency range from 100 kHz to 10 mHz with 10 mV of amplitude.
Layer Rct / Ω
Bare electrode 19 ± 3
SAM 660 ± 13
SAM/PAMAM G4 51 ± 5
SAM/PAMAM G4/DNA 149 ± 8
SAM/PAMAM G4/DNA/HRP 1841 ± 24
Figure 2. Nyquist plot of layer-by-layer sequential steps onto gold electrodes by adsorption in 5 mmol L-1Fe(CN)
6
formed on modiied electrode is about 7.7×10⁻⁹ mol cm-2
and increase linearly with HRP concentration (data not shown). This employed procedure in our studies is about 100-fold more eficient than those reported by Chen and co-workers43 at pyrolytic graphite electrode, since their
result to the HRP-DNA ilm was about 5.1×10⁻¹¹ mol cm-2.
Figure 4 shows SPR signal increasing with the concentration of the enzyme, from 0.5 to 5.0 mg mL-1.
When the concentration of the HRP in the solution was doubled, the response was almost doubled, suggesting that only speciic binding of the HRP to the DNA occurred.44
With theses SPR results there is the possibility for assessing the kinetics of interaction between nucleic acid and enzyme used in this investigation.2,3 At HRP-ds-DNA layer the
association occurred rapidly and reached a steady state at studied conditions.
As noted, the interactions are observed between an immobilized ligand and a soluble ligand. Thus, for the reversible interactions, they can be written as:
ka
ds-DNA + HRP ds-DNA-HRP
kd
The rate of product formation, ds-DNA-HRP, at time t function may be written as:
d[ds-DNA-HRP] / dt =
ka[ds-DNA] [HRP] − kd[ds-DNA-HRP] (1)
Where ka is the association rate constant and kd is the dissociation rate constant. Considering that complex formation of ds-DNA-HRP presents a kinetic of pseudo irst order45-47 and after some reaction time, t, [HRP] = [HRP]
i –
[ds-DNA-HRP]. Substituting into (1) gives:
d[ds-DNA-HRP] / dt =
ka [ds-DNA] ([HRP]i – [ds-DNA-HRP]) – kd [ds-DNA-HRP], (2)
Where [HRP]i is the concentration of HRP at t = 0. The SPR signal, R, is proportional to the formation of the ds-DNA-HRP complexes at the surface and the maximum signal, Rmax, will be proportional to the concentration of active ligand at electrode surface.44 Thus, changing
d[ds-DNA-HRP] for dR and ds-DNA-HRP complexes for Rmax, the equation (2) becomes:
dR / dt = ka C (Rmax – R) – kd R (3)
As already mentioned, dR / dt is the rate of formation of surface associated complexes, i.e., the derivative of the observed response curve, C is the concentration of ligand in solution; Rmax is the resonance units, and (Rmax – R) is equivalent to the number of unoccupied surface binding sites at time t. Note that since terms in R appear on both sides of the equation, the response value R can be used directly without conversion to absolute concentrations of complexes formed at the sensor surface. So, rearranging (3), we have:
dR / dt = ka C Rmax – (kaC + kd)R (4)
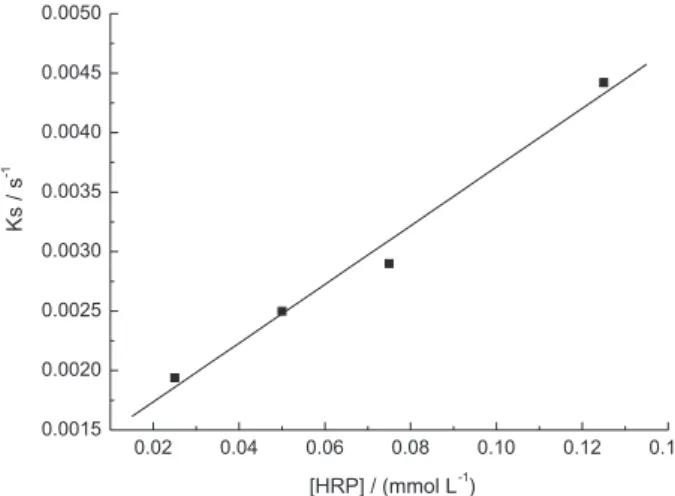
Equation 4 can be regarded as a straight line dR/dt = – kobsRt + b with kobs = kaC + kd, and b = kaCRmax. Parameter kobs can be determined by linear regression of a plot of dR/dt values vs. Rt values. It is the angular coeficient. Determined kobs value is a concentration-dependent parameter.48
Figure 5 shows a plot of dR / dt versus R from the HRP interaction with DNA using [HRP] = 2.5×10⁻⁵ mol L-1. For
Figure 3. Sensorgram obtained for layer-by-layer immobilization of PAMAM, ds-DNA and HRP on a gold disk modified with a mercaptopropanoic acid SAM using SPR for detection.
each enzyme concentration studied we have obtained a plot of dR/dt versus R. For each plot was obtained one kobs.
Figure 6 shows a plot of kobsversus HRP concentration which allows getting a single value for ka, the slope, and kd, the y-intercept. The value of ka determined is 24.7 L mol-1 s-1 and k
d is 1.2×10
-3 s-1. The association
constant value obtained in the system shows that complex formation reaction is not so fast when compared to Antp homeodomain (gene that encodes transcription factors which play major roles in determining cell fate) and ss-DNA binding with a ka estimated to be almost 105 L mol-1 s-1 44 or
ss-DNA and replication protein A (RPA) with a association rate constant of 106 to 107 L mol-1 s-1.3,49 The molecular mass
of the Antp homeodomain used by Seimiya and Kurosawa44
is 8.5 kDa, i.e., almost 5-fold lighter than HRP used in these experiments. This feature can raise the association rate of lighter molecules. And also, the values cited for ka
of their system should be considered just the average values for mixed reactions, once that occurred speciic and non-speciic binding. However, kd is comparable to the same
system of Antp homeodomain-ss-DNA.44
The dissociation constant of our system can be characterized as weak when compared to ss-DNA-RPA binding.3,49
Even though the association constant is not so high, it is important to consider that the ration between them, ka e kd, is still favourable. The association rate data may imply certain dependency on the enzyme structure and the availability of the ligand structure.
The equilibrium constant, Keq, can be calculated from the ratio of rate constants:
Keq = ka / kd, (5)
Where Keq determined is 20.6×10³ L mol-1 .
Gibbs free energy change (∆G) for a reaction is related to the equilibrium dissociation constant, Keq, by:
∆G = - R T ln Keq (6)
Thus, a value of ∆G = −5.9 kcal mol-1 (–23.1 kJ mol-1)
was obtained to HRP and ss-DNA association. This result can not be compared to Protein and ss-DNA binding obtained by Seimiya and Kurosawa44 because the value
cited for ∆G of their system is related to speciic and non-speciic bonding and this can increase the stability of the system. It also, the result obtained is lower than the value of Gibbs free energy for ss-DNA and Replication protein A,3
but it is known that their system is very stable because the protein A binds eficiently and effectively to ss-DNA used.
The electrocatalytic activity of HRP adsorbed on DNA was tested by the reduction of H2O2. As HRP contains heme as a prosthetic group, which is also the active site of protein, and it can catalyze the hydrogen peroxide-dependent one electron oxidation. Thus, the apparent Michaelis-Menten constant (KM), which indicates the kinetics of enzyme-substrate reaction, was calculated according to the electrochemical version of the Lineweaver-Burk equation.50,51 The reduction peak current increased
with the concentration of H2O2 enhanced and at higher concentration, a response plateau was observed (data not shown).52
1 / Iss = 1 / Imax + KM / Imax C
Where Iss is the steady-state current after the addition of substrate, C is the bulk concentration of the substrate, Imax is the maximum current measured at the saturated Figure 5. A plot of the association phase of an interaction between ds-DNA
and HRP biomolecules by linearization method. [HRP] = 2.5×10⁻⁵ mol L-1.
substrate conditions. The KM in this work was found to be 2.56 mmol L-1, implying that the system exhibited afinity
for H2O2. This KM value is intermediary than some reported values.53-56 As is well known, the smaller K
M shows the
higher catalytic ability and it also indicates a larger afinity of the enzyme to the substrate. These results indicated that the peroxidase activity of entrapped HRP was maintained. In general, this interaction between peroxidase and ds-DNA can also be compared to gold-thiol bond.57 Thus,
these results conirm that interaction between HRP and ds-DNA layer is thermodynamically favourable. Further investigations of stability and applicability of this system will be performed.
Conclusion
In this study, we have shown by using electrochemical impedance spectroscopy and surface plasmon resonance that peroxidase enzyme adsorbed on the ds-DNA layer on modiied gold electrode. Electrochemical impedance spectroscopy allowed the monitoring of the successful construction of the multicomponent film on the gold surface. And also, continuous monitoring of the SPR signal allowed to obtain the kinetic data of the system desired. The reaction showed that the interaction of the peroxidase on ds-DNA layer is favourable once both kinetic constants and binding energy are comparable to DNA-protein interaction. The interaction constants of our system are as strong as a gold-thiol bond. This procedure employed enables us to monitor the interaction of proteins in real time allowing further applications as a biosensor.
Acknowledgments
The authors thank FAPESP and CNPq for the inancial support.
References
1. Nguyen, B.; Tanious, F. A.; Wilson, W. D.; Methods2007, 42, 150.
2. O’Shannessy, D. J.; Brigham-Burke, M.; Soneson, K. K.; Hensley, P.; Brooks, I.; Anal. Biochem. 1993, 212, 457. 3. Schubert, F.; Zettl, H.; Hafner, W.; Krauss, G.; Krausch, G.;
Biochemistry 2003, 42, 10288.
4. Cahova-Kucharikova, K.; Fojta, M.; Mozga, T.; Palecek, E.;
Anal. Chem. 2005, 77, 2920.
5. Liu, J.; Roussel, C.; Lagger, G.; Tacchini, P.; Girault, H. H.;
Anal. Chem.2005, 77, 7687.
6. Palecek, E.; Fojta, M.; Tomschik, M.; Wang, J.; Biosens. Bioelectron. 1998, 13, 621.
7. Zhou, L.; Yang, J.; Estavillo, C.; Stuart, J. D.; Schenkman, J. B.; Rusling, J. F.; J. Am. Chem. Soc. 2003, 125, 1431. 8. Chen, G.-P.; Wang, X.; Liu, A.-R.; Qian, D.-J.; Mater Sci. Eng.
C.2009, 29, 925.
9. Sato, K.; Kodama, D.; Anzai, J.; Anal. Sci. 2005, 21, 1375. 10. Zhao,W.; Xu, J. J.; Chen, H. Electroanalysis2006, 18, 1737. 11. Caruso, F.; Niikura, K.; Furlong, D. N.; Okahata, Y.; Langmuir
1997, 13, 3427.
12. Cui, X. Q.; Pei, R. J.; Wang, Z. Z.; Yang, F.; Ma, Y.; Dong, S. J.; Yang, X. R.; Biosens. Bioelectron. 2003, 18, 59.
13. Linman, M. J.; Culver, S. P.; Cheng, Q.; Langmuir2009, 25, 3075.
14. Wang, M. J.; Wang, L. Y.; Yuan, H.; Ji, X. H.; Sun, C.Y.; Ma, L.; Bai, Y. B.; Li, T. J.; Li, J. H.; Electroanalysis2004,
16, 757.
15. Zu, Y.; Liu, H.; Y. Zhang, N. Hu, Electrochim. Acta2009, 54, 2706.
16. Shimazaki, Y.; Mitsuishi, M.; Ito S.; Yamamoto, M.; Langmuir 1998, 14, 2768.
17. Katsuhiko, A.; Hill, J. P.; Ji, Q.; Phys. Chem. Chem. Phys.2007,
9, 2319.
18. Liu, Y.; Hu, N.; Biosens. Bioelectron. 2007, 23, 661.
19. Lvov, Y. M.; Lu, Z.; Schenkman, J. B.; Zu, X.; Rusling, J. F.;
J.Am. Chem. Soc.1998, 120, 4073.
20. Rusling, J. F.; Hvastkovs, E. G.; Hull, D. O.; Schenkman, J. B.;
Chem. Commun. 2008, 141.
21 So, M.; Hvastkovs, E. G.; Bajrami, B.; Schenkman, J. B.; Rusling. J. F.; Anal. Chem. 2008, 80, 1192.
22. Tarun, M.; Bajrami, B.; Rusling, J. F.; Anal. Chem. 2006, 78, 624.
23. Jang, W.-D.; Selim, K. M. K.; Lee, C.-H.; Kang, I.-K.; Progr. Polymer. Sci.2009, 34, 1.
24. Zeng, Y.-L.; Huang, H.-W.; Jiang, J. H.; Tian, M.-N.; Li, C.-X.; Tang, C.-R.; Shen, G.-L.; Yu, R.-Q.; Anal. Chim. Acta2007,
604, 170.
25. Fant, K.; Esbjorner, E. K.; Lincoln, P.; Norden, B.; Biochemistry 2008, 47, 1732.
26. Zhou, L.; Gan, L.; Li, H.; Yang, X.; J. Pharmaceut. Biomed. Anal. 2007, 43, 330.
27. Zhu, N.; Gu, Y.F.; Chang, Z.; He, P. G.; Fang, Y. Z.;
Electroanalysis2006, 18, 2107.
28. Singh, K. V.; Pandey, R. R.; Wang X.; Lake, R.; Ozkan, C. S.; Wang, K.; Ozkan, M.; Carbon2006, 44, 1730.
29. Yan, H.; Zhang, X. P.; Shen, Z. Y.; Seeman, N. C.; Nature2002,
415, 62.
30. Kurita, R.; Nakamoto, K.; Ueda, A.; Niwa, O.; Electroanalysis 2008, 20, 2241.
31. Mendes, R. K.; Carvalhal, R. F.; Stach-Machado, D. R.; Kubota, L. T.; Biosens. Bioelectron. 2009, 24, 2483.
32. Wang, J.; Wang, F.; Xu, Z.; Wang, Y.; Dong, S.; Talanta2007,
33. Englebienne, P.; Van Hoonacker, A.; Verhas, M.; Spectroscopy 2003, 17, 255.
34. Mendes, R. K.; Carvalhal, R. F.; Kubota, L. T.; J. Electroanal. Chem. 2008, 612, 164.
35. So, M.; Hvastkovs, E. G.; Schenkman, J. B.; Rusling, J. F.;
Biosens. Bioelectron. 2007, 23, 492.
36. Billah, M.; Hays, H. C. W.; Millner, P. A.; Microchim. Acta 2008, 160, 447.
37. Darain, F.; Park, D. S.; Park, J. S.; Shim, Y. B.; Biosens. Bioelectron. 2004, 19, 1245.
38. Zhu, N.; Gao, H.; Gu, Y.F.; Xu, Q.; He, P.G.; Fang, Y. Z.; Analyst 2009, 134, 860.
39. Li, D.; Zou, X.; Shen, Q.; Dong, S.; Electrochem. Commun. 2007, 9, 191.
40. Li, N.; Yuan, R.; Chai, Y.; Chen, S.; Na, H.; Bioprocess. Biosyst. Eng. 2008, 31, 551.
41. Min, K.; Cho, M.; Han, S-Y.; Smi, Y.-B.; Ku, J.; Ban, C.;
Biosens. Bioelectron. 2008, 23, 1819.
42. Stenberg, E.; Persson, B.; Roos, H.; Urbaniczky, C.; J. Colloid Interface Sci.1991, 143, 513.
43. Chen, X.; Ruan, C.; Kong, J.; Deng, J.; Anal. Chim. Acta2000,
412, 89.
44. Seimiya, M.; Kurosawa, Y.; FEBS Lett. 1996, 398, 279. 45. Fägerstam, L. G.; Frostell-Karlsson, A.; Karlsson, R.; Persson,
B.; Rönnberg, I.; Chromatogr.1992, 227, 176.
46. Karlsson, R.; Miachaelsson, A.; Matsson, L.; J. Immunol. Methods1991, 145, 229.
47. Malmborg, A.-C.; Michaëlsson, A.; Ohlin, M.; Jansson, B.; Borreback, C. A. K.; Scand. J. Immunol.1992, 35, 643. 48. Morton, T. A.; Myszka, D. G.; Chaiken, I. M.; Anal. Biochem.
1995, 227, 176.
49. Wang, M.; Mahrenholz, A.; Lee, S.-H.; Biochemistry 2000, 39, 6433.
50. Sun, W.; Gao, R. F.; Jiao, K.; J. Phys. Chem. B2007, 111, 4560. 51. Li, J.; Tan, H.; Ge, H. Anal. Chim. Acta1996, 335, 137. 52. Huang, R.; Hu, N. Bioelectrochemistry2001, 54, 75. 53. Fan, D.-H.; Sun, J.-Y.; Huang, K.-J.; Colloid Surf. B:
Biointerfaces2010, 76, 44.
54. Hui, N.; Gao, R.-F.; Li, X.-Q.; Sun, W.; Jiao, J.; J. Braz. Chem. Soc. 2009, 20, 252.
55. Li, J.; Tan, S. N.; Ge, H. L.; Anal. Chim. Acta 1996, 335, 137. 56. Fan, C. H; Wang, H. Y; Zhu, D.; Wagner, G.; Li, G. X; Anal.
Sci. 2001, 17, 273.
57. Damos, F. S.; Luz, R. C. S.; Kubota, L. T.; Langmuir2005, 21, 602.
Submitted: December 12, 2009
Published online: May 20, 2010
![Figure 5 shows a plot of dR / dt versus R from the HRP interaction with DNA using [HRP] = 2.5×10 -5 mol L -1](https://thumb-eu.123doks.com/thumbv2/123dok_br/18994031.461619/5.892.69.408.791.1053/figure-shows-plot-versus-hrp-interaction-dna-using.webp)