Original Articles
J
ournal ofEpilepsy and Clinical
Neurophysiology
J Epilepsy Clin Neurophysiol 2006; 12(4):191-199
* Institute of Biomedical Sciences – São Paulo University – Brazil.
** Director, Epilepsy Surgery Program, Brigadeiro Hospital, São Paulo, Brazil. *** Instituto de Pesquisa e Desenvolvimento, Universidade do Vale do Paraiba. Received Sept 05, 2006; accepted Oct 07, 2006.
Peri-ictal Complexity Loss as Determined by Approximate Entropy
Analysis in the Electrocorticogram Obtained from Chronic Subdural
Recordings in Patients with Refractory Temporal Lobe Epilepsy
Adhemar Pettri Filho*, Arthur Cukiert**, Luis Diambra***
Institute of Biomedical Sciences – São Paulo University
ABSTRACT
Rationale: The development of closed-loop devices suitable for use in the treatment of epileptic patients would very likely rely on the adequate development of paradigms able to forecast the occurrence of seizures. In this paper, we studied the usefulness of approximate enthropy, of a non-linear paradigm, in this patient population. Methods: We applied approximate entropy (ApEn) analysis to study the variability in the complexity of the peri-ictal electrocorticogram (ECoG) of patients with refractory epileptic seizures of the temporal lobe origin. Three patients were implanted with chronic subdural grids. The ApEn algorithm measured the complexity of interictal, peri-ictal and ictal phases. We selected one representative channel disclosing interictal activity for each patient and two channels per patient with ictal recordings. Results: In all patients, we found one channel where the interictal activity registered in the ECoG was associated with high complexity and where ApEn was higher than 0.59. But in the other two channels, for each patient that presented interictal/ictal transitions, clinical manifestations of epileptic seizures occurred around 3.5 seconds after the entropy drop, when entropy was below 0.5. In contrast, when entropy was higher than 0.5, clinical manifestation occurred 9.5 seconds after the entropy drop. The 3.5 seconds shorter delay possibly indicates focal activity in the channel analyzed. Conclusions: Our results suggest that ApEn may be a useful instrument for early detection of epileptic activity. Its application may be indicated for prevention and diagnosis of epileptic seizures.
Key words: approximate entropy, complexity, temporal lobe epilepsy, automatic detection.
RESUMO
Análise por entropia aproximada da perda de complexidade peri-ictal no eletrocorticograma de pacientes com epilepsia refratária com origem no lobo temporal
possivel-INTRODUCTION
There are more than 50 million people with epilepsy around the world. The apparently unpredictable nature of the seizures is one of the most devastating features of epilepsy. A system able to detect seizures in advance might allow its prevention, reducing morbidity and mortality, and improving quality of life of epileptic patients.
The electroencephalogram (EEG) is traditionally used in the identification of epileptic foci(16). It is a noninvasive
measurement of brain‘s dynamic activity and provides a global spatio-temporal description of the collective electrical neuronal activity. One of the most important issues regarding seizure‘s forecast and related analysis is the access to large ammount of continuous, high-quality, human artifact-free EEG data, covering all physiological states relevant to seizures. When surgical treatment is contemplated, chronic electrocorticography obtained from subdural electrodes might be indicated(1). Patients are
recorded for a variable period of time (up to 2 or 3 weeks) to obtain the diagnostic information needed. The ability to adequately localize the epileptic focus is particularly valuable when focal cortical resections are planned(10).
Synchronization of neuronal network‘s activity occur during epileptic seizures(8). Seizure’s precursors come and
go, as attempts to ignite seizures. These attempts may last for days before special synchronizing event(s) propel the proccess towards the electrical and clinical seizure onset. Substantial effort is necessary to analyse these characteristic findings, which seem to vary from method to method and from patient to patient. Possibly, these data could be converted into reliable, on-line systems able to predict seizures in real time(15). Sharp waves, spikes,
or spike-and-wave complexes might represent epileptic activity(16). The morphology of these elements has been
correlated with different types of epileptic seizures(9).
Yet, automatic recognition of seizures based on the morphological aspects needs a large database and long recordings in order to extract precise information from the different types of seizures.
Since the early 1990’s, new mathematical approaches have been applied to EEG signals in order to determine the spatial localization of the epileptic foci. Recently, new techniques, based on nonlinear analysis focused in forecasting epileptic seizures as a tool for the diagnosis and
mente o local de início da atividade focal. Conclusões: Nossos resultados sugerem que ApEn pode ser um instrumento útil na detecção precoce da atividade epiléptica. Sua aplicação pode estar indicada na preven-ção ou diagnóstico das crises epilépticas.
Unitermos: entropia aproximada, complexidade, epilepsia do lobo temporal, detecção automática.
treatment of epilepsy. Nonlinear deterministic dynamics were found in the epileptic process(2). The spatiotemporal
dynamics of epileptic activity significantly changes during the epileptic process(8). The discrimination of nonlinear
chaotic systems involves establishing an adequate set of invariant measures, such as fractal spectrum, Lyapunov exponents and Kolmogorov-Sinai (KS) entropy(11). These
methods require invariant measures to characterize nonlinear dynamical systems, and their blind application in analyses of time series may produce spurious results. A huge amount of clean data is needed, about 10d (where d
is the embedding dimension), for a reliable estimation of these measures in low-dimensional chaotic systems. Long, stationary time series of EEG signals are required by those methods, even if stationarity of the signal is assumed, although this condition may be inconvenient when dealing with EEG signals(18). The discrimination power of these
methods is poor and unuseful for accurate temporal localization of transient events of EEG(6). Moreover,
a low correlation dimension and decrease of fractal dimension(14)in the EEG signals recorded during seizures
were noted.
Quantification of the complexity of physiological signals in healthy and pathological conditions has been the focus of considerable attention(5,12,19,20,21,24). A wide
variety of diseases, as well as aging, appear to degrade physiologic information content and reduce the adaptation capacity of individuals. Loss of complexity has been proposed as a generic feature of pathologic dynamics(22,24).
Entropy-based algorithms quantify the complexity of a given system. Entropy increases with the complexity (lack of order) of a time series pattern and decreases when there are regular (repetitive) patterns.
Recently, a measure of complexity called ApEn has been introduced by Pincus(20,22). This measure quantifies
the regularity of time-series data, motivated by applications to short, noisy, data sets. ApEn is suitable to measure complexity and regularity, especially in a time series of data obtained from biologic activities that include both deterministic and stochastic processes(5,21,24). The
signals, since it is difficult to obtain a long transient for a reliable estimation of the invariant measure. ApEn can classify complex systems with a value of “N” typically between 100 and 5000(21) in a diversity of settings,
deterministic, chaotic and stochastic processes, with a short computational code instruction within a segment of EEG signal (about 1 second). The capability to differentiate the changing complexity within such a relatively small amount of data might allow the use of ApEn in a variety of contexts(24).
Some reports in which ApEn measuring was carried out(3,7,13,23)have suggested that paroxismal activity derived
from epileptic seizures in humans seems to be less complex than the interictal neuronal network‘s activity. The complexity of the activity of neuronal firing has also dropped when penicillin was applied(28).
The purpose of our study was the quantification of regularity of the underlying dynamics of EEG without establishing the existence of chaos or any estimation of invariant measures of epileptic seizures. In this study, we applied ApEn to human ECoG in order to detect complexity changes in the interictal, peri-ictal and ictal epochs of patients with refractory temporal lobe epilepsy, trying to identify and forecast epileptic seizures.
METHODS
Estimation of ApEn
ApEn, as described by Pincus in 1991(20), has been used
to quantify regularity in a time series. It measures the logarithmic likelihood that runs from patterns that are close (within r) to m contiguous observations and remain close (with the same tolerance width r) on subsequent incremental comparisons. Thus, regular sequences of patterns have smaller ApEn values, and large ApEn values indicate random sequences with greater independence or complexity.
Given N data points, equally time spaced, u(1), u(2), u(3), … u(N), two input parameters – m and r – must be fixed to compute ApEn. Parameter m is the length of compared runs, and r corresponds to a filter. Next, form vector sequences are formed from x(1) through
x (N-m+1) to {u(i)}, defined by x(i) = [u(i), ..., u(i+m-1)]. These vectors represent m consecutive u values, commencing with ith point. The distance between vectors
d[x(i),x(j)] is the maximum absolute difference between the scalar components of vectors x(i) and x(j). Then, one uses the sequence x (1), x(2), ... x(N-m+1) to compute de quantity Cim(r),wich is defined as the fraction of vectors
x(j), inside the sphere centered in x(i) and radius r.
] r x(j) x(i), [ d that such x(j) of number 1)
m -(N Cm
r
i = + ≤
−1[ )
(
The Cim(r)measures the frequency or regularity, with tolerance r, of patterns with length m similar to x(i). After that we compute the logarithm and average over I.
]
[
ln
1
1
)
(
1
) (
∑
− ++
−
=
N mi
m r i m
C
m
N
r
φ
where ln is a natural logarithm. ApEn was defined by:
ApEn measures differences in probabilities that values of length 2 will reccur within tolerance r, and the probability that values of length 3 will reccur to the same tolerance. High degrees of regularity in the data would imply that a given run of length 2 often would continue with nearly the same third value, producing a low ApEn value.
Clinical data
ECoG recordings were collected from three patients with refractory temporal lobe epilepsy who were candidates to surgical resection. These patients have been previously submitted to chronic subdural grids‘ implantation, and have been recorded for a period of two to three weeks using a 32-channel digital video EEG recording system (Oxford-Medelec).
ApEn analyzed interictal and ictal ECoG recordings. The location and number of electrodes varied from patient to patient and their placement was presumably close to the epileptic focus.
Interictal activity containing no spikes was used as control for each individual. In order to establish ApEn convergence rate, we computed ApEn (m,r,N) for r = 0.10 to 0.25 SD (standard deviation) of an ictal segment from one patient. ApEn reached a plateau for r = 25% and
N = 500 data points, indicating good statistical validity. We used fixed parameters m = 2, r = 25% and N = 500, to compute ApEn.
ApEn was applied using a slide window with
N = 500 (around 1sec of ECoG), with overlap of d = 250 (samples), over a standard deviation of signal, with m = 2 and r = 0.25 × SD.
The study was approved by the local IRB.
RESULTS
Convergency of ApEn was tested for r ranging from 0.10 to 0.25. For values smaller than 0.25, more data points were needed in order to reach a constant plateau. The best value was obtained with N = 500 and r = 25%. These results could be seen in Figure 1.
0 5 0 0 1 0 0 0 1 5 0 0 2 0 0 0 2 5 0 0 3 0 0 0 0 . 2
0 . 3 0 . 4 0 . 5 0 . 6 0 . 7
N
2 5 % 2 0 % 1 5 % 1 0 %
A
p
E
n
Figure 1. Convergency rate of ApEn as a function of the number of points “N” (the number of points used in the computation), with m = 2 and r = 25% × SD employing the ictal segment from 11500/256 to 15000/256 seconds, of patient 1 (channel 1).
Table 1 shows representative entropy values for interictal segments (without spikes) for patients 1, 2 and 3. The correlation between interictal ECoG recordings and ApEn analysis can be seen in Figures 2 to 4.
Table 2 shows the results of ApEn with the same parameters N = 500, d = 250 and r = 25%, for the ictal epochs obtained from patients 1 (channels l and 2), 2 (channels 22 and 23) and 3 (channels 2 and 3). The correlation between ictal ECoG recordings and ApEn analysis can be seen in Figures 5 to 10.
Patient Channel EnAp ± S.D.* Epoch
(seconds)
1 C6 0.59 ± 0.027 30-35
2 C7 0.67 ± 0.054 20-25
3 C22 0.71 ± 0.018 20-25
* SD = standard deviation.
3 0 3 1 3 2 3 3 3 4 3 5
- 5 0 0 - 4 0 0 - 3 0 0 - 2 0 0 - 1 0 0 0 1 0 0 2 0 0 3 0 0 4 0 0
5 0 0 P a t i e n t 1 - c h a n n e l 6
3 0 3 1 3 2 3 3 3 4 3 5
0 , 0 0 , 1 0 , 2 0 , 3 0 , 4 0 , 5 0 , 6 0 , 7
( s e c o n d s ) ( s e c o n d s )
uV m
i
c
r
ov
ol
t
s
A
p
E
n
Figure 2. ECoG obtained from patient 1, channel 6. Above: interictal ECoG (5 seconds). Below: ApEn (500,250,25%) = 0.59 ± 0.027 (mean ± standard deviation).
Table 1. Approximate Entropy – ApEn (500,250,25%) for interictal segments of the three patients.
Table 2. Approximate Entropy (500,250,25%) of ictal epochs for the 3 patients. From left to right: Column 5 shows the time for electrocorticographic seizure onset; Column 6 shows the time of ApEn drop; Column 7 shows the time of seizure‘s clinical manifestation onset; Column 8 calculates the time delay between detection of entropy‘s drop and onset of clinical manifestations; Column 9 calculates the time delay between detection of entropy‘s drop and the electrocorticographic seizure‘s onset (negative signs denote antecipation of entropy‘s drop in relation to ECoG or clinical onset).
Patient Channel ApEn ± S.D. Epoch (seconds)
ECoG onset (seconds)
ApEn drop (seconds)
Clinical manifestation
(seconds)
Delay ApEn/clinical
(seconds)
Delay ApEn drop/EcoG
(seconds)
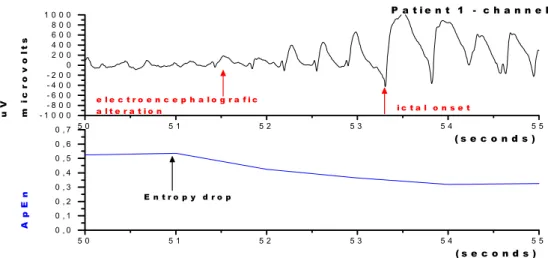
1 C1 0.45 ± 0.92 50 - 55 s 51.5 s 51.0 s 55.5 s -4.5 s -0. 5 s
1 C2 0.24 ± 0.96 50 - 55 s 51.5 s 52.0 s 55.5 s -3.5 s 0. 5 s
2 C22 0.56 ± 0.066 27 - 32 s 28.5 s 28.0 s 41.5 s -13.5 s -0. 5 s
2 C23 0.55 ± 0.079 27 - 32 s 28.5 s 28.0 s 41.5 s -13.0 s -0. 5 s
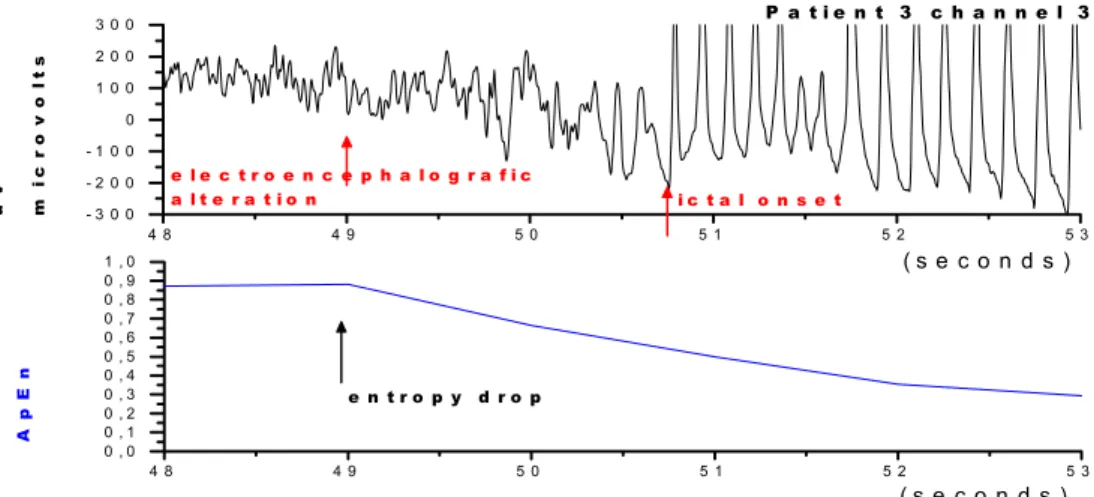
3 C2 0.61 ± 0.140 48 - 53 s 49.0 s 50.0 s 59.5 s -9. s 1. 0 s
5 0 5 1 5 2 5 3 5 4 5 5 0 , 0
0 , 1 0 , 2 0 , 3 0 , 4 0 , 5 0 , 6 0 , 7
E n t r o p y d r o p
uV m
i
cr
o
v
ol
t
s
A
p
E
n
( s e c o n d s ) ( s e c o n d s )
5 0 5 1 5 2 5 3 5 4 5 5
- 1 0 0 0 - 8 0 0 - 6 0 0 - 4 0 0 - 2 0 0 0 2 0 0 4 0 0 6 0 0 8 0 0 1 0 0 0
e l e c t r o e n c e p h a l o g r a f i c
a l t e r a t i o n i c t a l o n s e t
P a t i e n t 1 - c h a n n e l
2 0 2 1 2 2 2 3 2 4 2 5
- 8 0 0 - 6 0 0 - 4 0 0 - 2 0 0 0 2 0 0 4 0 0 6 0 0
8 0 0 P a c i e n t e 3 - c a n a l 2 2
( s e c o n d s ) ( s e c o n d s )
2 0 2 1 2 2 2 3 2 4 2 5
0 , 0 0 , 1 0 , 2 0 , 3 0 , 4 0 , 5 0 , 6 0 , 7 0 , 8
A
p
E
n
uV m
i
cr
ov
ol
t
s
2 0 2 1 2 2 2 3 2 4 2 5
0 . 0 0 . 1 0 . 2 0 . 3 0 . 4 0 . 5 0 . 6 0 . 7 0 . 8
( s e c o n d s ) ( s e c o n d s )
A
p
E
n
uV m
i
c
r
ov
ol
t
s
2 0 2 1 2 2 2 3 2 4 2 5
- 5 0 0 - 4 0 0 - 3 0 0 - 2 0 0 - 1 0 0 0 1 0 0 2 0 0 3 0 0 4 0 0
5 0 0 P a t i e n t 2 - c h a n n e l 7
Figure 3. ECoG obtained from patient 2, channel 7. Above: interictal ECoG (5 seconds). Below: ApEn (500,250,25%) = 0.67 ± 0.054 (mean ± standard deviation).
Figure 4. ECoG obtained from patient 3, channel 22. Above: interictal ECoG (5 seconds). Below: ApEn (500,250,25%) = 0.71 ± 0.018 (mean ± standard deviation).
5 1 5 2 5 3 5 4 5 5 5 6 - 1 0 0 0
- 8 0 0 - 6 0 0 - 4 0 0 - 2 0 0 0 2 0 0 4 0 0 6 0 0 8 0 0 1 0 0 0
A
p
E
n
uV m
i
cr
ov
ol
t
s
e l e c t r o e n c e p h a l o g r a f i c a l t e r a t i o n
P a t i e n t 1 - c h a n n e l 2
( s e c o n d s )
5 1 5 2 5 3 5 4 5 5 5 6
0 , 0 0 , 1 0 , 2 0 , 3 0 , 4
e n t r o p p y d r o p
( s e c o n d s )
Figure 6. ECoG obtained from patient 1, channel 2. Above: ECoG showing the beginning of epileptic activity. Below: ApEn (500,250,25%) = 0.24 ± 0.096 (mean ± standard deviation). Entropy started its fall 0.5 second after initiation of ECoG abnormalities.
2 7 2 8 2 9 3 0 3 1 3 2
0 , 4 0 , 5 0 , 6 0 , 7 0 , 8
e n t r o p y d r o p
A
p
E
n
( s e c o n d s )
( s e c o n d s )
2 7 2 8 2 9 3 0 3 1 3 2
- 6 0 0 - 4 0 0 - 2 0 0 0 2 0 0 4 0 0 6 0 0
uV m
i
c
r
ov
ol
t
s
i c t a l o n s e t e l e c t r o e n c e p h a l o g r a p h i c
a l t e r a t i o n
P a t i e n t 2 - c h a n n e l 2 2
Figure 7. ECoG obtained from patient 2, channel 22. Above: ECoG showing the beginning of epileptic activity. Below: ApEn (500,250,25%) = 0.56 ± 0.066 (mean ± standard deviation). Entropy started its fall 0.5 second before alterations could be seen in EcoG.
2 7 2 8 2 9 3 0 3 1 3 2
- 6 0 0 - 4 0 0 - 2 0 0 0 2 0 0 4 0 0 6 0 0
i c t a l o n s e t e l e c t r o n c e p h a l o g r a f i c
a l t e r a t i o n
P a t i e n t 2 - c h a n n e l 2 3
( s e c o n d s ) ( s e c o n d s )
2 7 2 8 2 9 3 0 3 1 3 2
0 , 4 0 , 5 0 , 6 0 , 7 0 , 8
e n t r o p y d r o p
A
p
E
n
uV m
i
cr
ov
ol
t
s
4 8 4 9 5 0 5 1 5 2 5 3
- 3 0 0 - 2 0 0 - 1 0 0 0 1 0 0 2 0 0 3 0 0
i c t a l o n s e t e l e c t r o e n c e p h a l o g r a f i c
a l t e r a t i o n
4 8 4 9 5 0 5 1 5 2 5 3
0 , 3 0 , 4 0 , 5 0 , 6 0 , 7 0 , 8 0 , 9 1 , 0
e n t r o p y d r o p
( s e c o n d s ) ( s e c o n d s )
A
p
E
n
uV m
i
cr
ov
ol
t
s
P a t i e n t 3 - c h a n n e l 2
Figure 9. ECoG obtained from patient 3, channel 2. Above: ECoG showing the beginning of epileptic activity. Below: ApEn (500,250,25%) = 0.61 ± 0.140 (mean ± standard deviation). Entropy started its fall 1 second after alterations were noted in EcoG.
4 8 4 9 5 0 5 1 5 2 5 3
- 3 0 0 - 2 0 0 - 1 0 0 0 1 0 0 2 0 0 3 0 0
i c t a l o n s e t e l e c t r o e n c e p h a l o g r a f i c
a l t e r a t i o n
4 8 4 9 5 0 5 1 5 2 5 3
0 , 0 0 , 1 0 , 2 0 , 3 0 , 4 0 , 5 0 , 6 0 , 7 0 , 8 0 , 9 1 , 0
e n t r o p y d r o p
A
p
E
n
uV m
i
cr
ov
ol
t
s
P a t i e n t 3 c h a n n e l 3
( s e c o n d s ) ( s e c o n d s )
Figure 10. ECoG obtained from patient 3, channel 3. Above: ECoG showing the beginning of epileptic activity. Below: ApEn (500,250,25%) = 0.51 ± 0.160 (mean ± standard deviation). Entropy started its fall coincidently with ECoG abnormalities.
DISCUSSION
Approximate entropy (ApEn) is a statistic estimation of regularity (or complexity) of a time series. It estimates whether current patterns remain constant or not taking into account comparison of future incremental proba-bilistic events. Persistent patterns indicate regularity (low entropy) and random patterns indicate complexity (high entropy). ApEn did not replace statistic measurements such as mean and standard deviation(21).
ApEn is not invariant under coordinate trans-formations; it is sensitive to settings of data acquisition such as scale, sample frequency, filters, etc. For correct comparisons between sets of data points we must keep the same parameters N, m and r. Entropy grows logarithmically
with the number “N” points. ApEn is a model of independent statistics. It compares both stochastic and deterministic systems.
few x(j) close vectors, within the limits established by r,
the standard deviation may accomplish 20 to 30% of the statistic calculations by using ApEn.
The computed value of entropy in one moving window lasts about 2 sec (N = 500 with sample frequency 256 Hz). The calculated of entropy is assigned to the center of the window. So, there are entropy values assigned to the first, and last 250 points.
The apen values depende on m, r and N. Based on several previous works(7), we have set m = 2 and r = 25%
of SD. The choice of N values is trade-off between the statistical validity of the stimation and temporal resolution of the characterization. Large values of N gives a better statistic to estimate ApEn but the apen value correspond to a large window and one can determine when the events occurs. In order to chose an adequate value of N we estimate the ApEn over ictal segment for different values of N and with r =25% of standard deviation. Fig. 1 shown ApEn as function of N, we can observe that Apen values converge around N = 500, after that ApEn almost became independent of N. In further calculation, we will adopt this value in order to calculate the entropy.
There were three types of transitions from the interictal to the ictal phase: 1) Entropy‘s drop was seen prior to the detection of ECoG abnormalities (patient 1, channel 1; patient 2, channels 22 and 23); 2) Entropy‘s drop coincided with ECoG abnormalities (patient 3, channel 3) and 3) Entropy‘s drop occurred after the ECoG abnormalities (patient 3, channel 2).
We found a clear discrimination between the inter-ictal and inter-ictal phases when entropy’s drop occurred prior to ECoG alterations. We could also observe the profile described above in patients in whom entropy dropped coincidently with EEG ictal onset. In patient 3, entropy’s drop occurred after electrographic ictal onset; entropy‘s value was higher than 0.5, which was the highest entropy registered during ictal epochs, although standard deviation was high. In this patient, we observed that the electrocorticographic activity gradually intermingled the pexisting inter-ictal complex pattern with the ictal re-gular pattern; this probably delayed entropy’s drop, which would identify the transition to an ictal phase. This might well mean that the studied electrodes were not near the epileptic focus in this patient.
Patient 1 (channel 2) presented the lowest peri-ictal entropy and high pre-ictal variability. In this channel, there were low values of entropy prior to the electrographic manifestation. The difference in entropy’s levels before and after its drop was small and entropy values were also very low in general. Clinical manifestations had a very short delay, possibly indicating spatial proximity to the epileptic focus. These findings are in agreement with those reported by others(3,7).
The analysis of interictal epochs showed high entropy (higher than 0.59) due to a high ECoG complexity. Clinical manifestations of epileptic seizures occurred around 3.5 seconds after entropy dropped below 0,5. When entropy was higher than 0.5, clinical manifestations were delayed around 9.5 seconds.
Our results showed that low entropy preceded early clinical manifestations. ApEn seemed to be appropriate in predicting epileptic seizures in patients submitted to invasive recordings with subdural grids. In some epochs of ictal activity, entropy analysis estimated values higher than 0.5 before the interictal/ictal transition. In these instances, the ECoG presented intermingling of both regularity and complexity. We were able to verify that this might be a specific characteristic of ictal phases, during which ApEn primarily detects the complexity patterns, giving rise to high entropy values.
ApEn was used as a measure of complexity, to quantify regularity in the ECoG. The ApEn algorithm was applied using a slide window with previously fixed parameters. With the computacional processing of one second of a moving window it was possible to anticipate the electrographic manifestation in about 0.5 second, in some patients.
The ability to adequately define the spatial distribution of epileptic activity might be valuable in order to localize the epileptic focus when surgical treatment is con-templated. The use of ApEn would bring high versatility to the identification of regions with epileptic activity in long-term ECoG monitoring, especially when data were obtained from implanted subdural electrodes, which provide artifact-free signals.
ApEn has recently been applied to measure complexity of neuronal spiking of CA1 hippocampal cells of rats. In this model, entropy‘s drop corresponded to loss of complexity in neuronal spiking(28). The spatial-temporal
dynamics of the epileptic processes, analyzed by non-linear methods, such as correlation dimension, shows transference of the dimensionality from high to low states, representing the synchronization of neuronal activity(15).
Low dimensionality indicates loss of complexity commonly seen in the epileptogenic process.
Several authors argued that epileptic activity is less complex than baseline brain activity(4,17,25,26,27). ApEn
algorithm is more robust when compared to the nonlinear methods. ApEn was appropriate to identify the trends towards regularity characteristic of an ictal phase, in patients with epilepsy. It has been possible to forecast electrographic abnormalities in the ECoG while analysing small datasets (1 to 2 seconds in duration).
stimulation for treatment of epileptic seizures. The high quality of ECoG signals (free of artifacts) enhances the quality of complexity’s analysis, making it possible to adequately study the peri-ictal loss of complexity and its variations as well.
REFERENCES
1. Ajmone-Marsan C. Chronic Intracranial Electrocorticography in seizures disorders. In: Michael J. Aminoff MD, editors. Electrodiagnosis in Clinical Neurology. 3rd ed. Churchill Livingstone Inc.; 1992.
2. Andrzejak RG, Widman G, Lehnertz K, et al. The epileptic process as nonlinear deterministic dynamics in a sthocastic environment: an evaluation on mesial temporal lobe epilepsy. Epilepsy Res. 2001;44:129-40.
3. Battacharya J. Complexity analysis of spontaneous EEG. Acta Neurobiol Exp. 2000;60:495-501.
4. Burioka N, Cornélissen G, Maegaki Y, et al. Approximate entropy of the electroencephalogram in healthy awake subjects and absence epilepsy patients. Clinical EEG and Neuroscience. 2005;36:188-93. 5. De Curtis M, Librizzi L, Biella G. Discharge threshold is enhanced for several seconds after a single interictal spike in a model of focal epileptogenesis. Eur J Neurosci. 2001;14:174-8.
6. Diambra LA, Malta CP. Nonlinear models for detecting epileptic spikes. Phys Rev E. 1999;59:929-37.
7. Diambra LA, Bastos de Figueiredo JC, Malta CP. Epileptic activity recognition in EEG recording. Physica A. 1999;273:495-505. 8. Elger CE, Widman G, Andrzejak R, et al. Nonlinear EEG analysis
and its potential role in epileptology. Epilepsia. 2000;41(Suppl): S34-8.
9. Gotman J, Wang LY. State-dependent spike detection: concepts and preliminary results. Electroenceph. Clin. Neurophysiol. 1991;79: 11-19.
10. Gotman J, Burges RG, Darcey TM, Herner RN, Ives JR, Lesser RP, Pijn JPM, Velis D, in: J. Engel Jr (Eds.). Computer Applications, Surgical Treatment of Epilepsies, Raven, New York, 1993. 11. Grassberger P,Procaccia I. Characterization of strange attractors.
Phys. Rev. Lett. 1983; 346-349.
12. Kaplan DT, Furman MI, Pincus SM, Ryan SM, Lipsitz LA, Goldberger AL. Aging and complexity of cardiovascular dynamics. Bioph. Journ.1991;59:945-949.
13. Lehnertz K,Elger CE. Neuronal complexity loss in temporal lobe epilepsy: effects of carbamazepine on the dynamics of epileptogenic focus. Electroencephalography Clin. Neurophysiol. 1997;103: 376-80.
14. Lehnertz K, Andrzejak RG, et al. Nonlinear EEG analysis in epilepsy: its possible use for interictal focus localization, seizures antecipation and prevention. J Clin. Neurophysiol. 2001;18:209-22.
15. Litt B, Echauz J. Prediction of epileptic seizures. The Lancet Neurology. 2002,1:22-30.
16. Niedermeyer E. In: E. Niedermeyer, F. Lopes da Silva, editors. Electroencephalography: Basic Principles, Clinical Applications and Related Fields, Urban and Schwarzenberg. Baltimore; 1983. p. 115.
17. Pettri Filho A. Estudo de entropia da atividade epiléptica interictal e ictal no eletrocorticograma obtido por meio de eletrodos subdurais implantados cronicamente no homem. São Paulo, 2004. [Disserta-ção de Mestrado – Faculdade de Medicina da Universidade de São Paulo].
18. Pijn JP, Neerven JV, Noest A, Lopes da Silva F. Chaos or noise in EEG signals; dependence on state and brain site. Electroenceph Clin Neurophysiol. 1991;79:371-81.
19. Pincus SM, Gladstone IM, Ehrenkranz RA. A regularity statistic for medical data analysis. J Clin Monit. 1991;7:335-45.
20. Pincus SM. Approximate entropy as a measure of system complexity. Proc Natl Ac Sci USA. 1991;88:2297-301.
21. Pincus SM, Goldberger AL. Physiological time-series analysis: what does regularity quantify?. Amer J Physiol. 1994;266:H1643-56. 22. Pincus SM. Assessing serial irregularity and its implications for
health. Ann NY Acad Sci. 2001;954:245-67.
23. Radhakrishman N, Gangadhar BN. Estimating regularity in epileptic seizure time series data. IEEE Eng. In: Medicine and Biology. 1998. p.89-94.
24. Richman JS, Moorman JR. Physiological time-series analysis using approximate entropy and sample entropy. Am J Physiology. 2000;278:H2039-H49.
25. Sabesan S, Narayanan K, Prasad A, Spanias A, Sackellares JC, Iasemidis LD. Predictability of epileptic seizures: a comparative study using Lyapunov exponent and entropy based measures. Biomed Sci Instrum. 2003;39:129-35.
26. Shiau DS, Sackellares JC, Iasemidis LD et al. Nonlinear approximate entropy analysis of brain electrical activity in a generalized epilepsy animal model. Epilepsia. 2002;43(Suppl. 7):273 (Abst. 3.074).
27. van Drongelen W, Nayak S, Frim DM, et al. Seizure anticipation in pediatric epilepsy: use of Kolmogorov entropy. Pediatr Neurol. 2003;29:207-13.
28. Yang H, Hu S, Han S, Liu GXie, Y, Xu J. Relation between responsiveness to neurotransmitters and complexity of epileptiform activity in rat hippocampal CA1neurons. Epilepsia. 2002;43: 1330-6.
Corresponding author:
Arthur Cukiert Hospital Brigadeiro
Rua Dr. Alceu de Campos Rodrigues, 247 # 121 CEP 04544-000, São Paulo, SP, Brasil