Printed in Brazil - ©2007 Sociedade Brasileira de Química 0103 - 5053 $6.00+0.00
Article
*e-mail: [email protected]
Determination of Trihalomethanes in Drinking Water from Three Different Water Sources in
Florianopolis–Brazil using Purge and Trap and Gas Chromatography
Dilma Budziak and Eduardo Carasek*
Departamento de Química, Universidade Federal de Santa Catarina, 88040-900 Florianópolis-SC, Brazil
As fontes que abastecem o sistema público de água em Florianópolis, Santa Catarina-Brasil são muito diversificadas e foram usadas na investigação da formação de trihalometanos (THM). Os resultados obtidos apresentaram relação com os mananciais onde são feitas as captações de água. Nos mananciais onde há maior contato com vegetação a quantidade de trihalometanos totais (TTHM) foi maior. As amostras de água do rio Cubatão-Pilões apresentaram quantidade de TTHM média de 59,9 µg L-1. Na Lagoa do Peri, que possui o agravante de conter grandes quantidades de algas, a quantidade média de TTHM foi de 152,3 µg L-1. Nas amostras do sistema Costa Norte, que são provenientes de poços artesianos, a média de TTHM encontrada foi de 19,4 µg L-1. Como a formação de THM é dependente da adição de cloro, não foi verificada a presença de THM em águas naturais (nascentes e poços artesianos). A metodologia analítica utilizada foi baseada em um sistema purga-e-trap acoplado a um cromatógrafo a gás equipado com detector por captura de elétrons. O desvio padrão relativo, limite de detecção e limite de quantificação para a metodologia desenvolvida corresponderam a faixa de 8-17%; 0,01-0,03 µg L-1 e 0,03-0,08
µg L-1, respectivamente. A faixa linear de trabalho foi de 0,1-8,0 µg L-1 para todos os compostos. A exatidão obtida variou de 91,3-126,0%.
The water source to feed the public water system in Florianopolis, Santa Catarina State-Brazil is very diversified and it was used to investigate the formation of trihalomethanes (THM). A strong relationship between the presence of THM and the kind of water source was found. Water sources in contact with vegetation contained higher concentration of total trihalomethanes (TTHM). Water samples from the Cubatao-Piloes system had a mean TTHM value of 59.9 µg L-1 while in Peri Lake, the mean TTHM was 152.3
µg L-1. Samples from the North Shore system, based on wellsprings, had a mean TTHM of 19.4 µg L-1. In the case of natural waters (spring water and wellsprings) THM was not observed. A system that combines purge-and-trap and gas chromatography with an electron capture detector was used in this study. After careful choice of the experimental conditions, the performance of the system was evaluated. Relative standard deviation, limit of detection and limit of quantification are 8-17 %, 0.01-0.03 µg L-1 and 0.03-0.08 µg L-1 respectively. Linear range falls within the range 0.1 to 8.0
µg L-1 for all compounds. Precision ranged between 91.3 and 126.0%.
Keywords: trihalomethanes, drinking water, purge-and-trap, gas chromatography
Introduction
Volatile organic compounds (VOCs) are the most
commonly found contaminants in water.1 During
treatment, drinking water is disinfected with chlorine, which can react with organic matter, mainly humic and fulvic acids and/or other products from aquatic plants, to produce volatile by-products. In addition, Campillo et al.2,3
also reported that high levels of bromine present in
reservoirs used for water treatment could contribute to the formation of bromide compounds or disinfection by-products (DBP) with the chlorine/bromine combination. Chlorination is known to be the most important method of drinking water disinfection and it is used worldwide3 because of its efficacy and relatively low cost.
dangerous for human health.4,5 Some examples of THM
include chloroform (CHCl3), bromodichloromethane
(CHBrCl2), chlorodibromomethane (CHBr2Cl) and
bromoform (CHBr3).
Epidemiological studies suggest a clear link between exposure to chlorinated water, uptake is not only by ingestion but also through contact with the skin (dermal absorption) or by inhalation, and the development of cancer in urinary bladder, spontaneous abortions and other adverse reproductive consequences.5
Due to the high toxicity of these compounds, the National Primary Drinking Water Regulations from US Environmental Protection Agency6 establishes the limit
for total THM concentration at 80 µg L-1. In many
European countries the limit is even lower, for example, Germany, in accordance with the Ordinance Amending the drinking water ordinance of 21 May 2001, has restricted THM to 50 µg L-1.7
The public water supply system in Florianópolis is currently divided into three regions, each having different water characteristic. North shore water supply system is supplied with ground water by 22 wellsprings with a water treatment station, The Peri Lake water treatment station, which is part of the East coast water supply system is located at Peri Lake municipal park and the Cubatao-Piloes system that takes water from Vargem do Braço and Cubatão rivers in Santo Amaro da Imperatriz city.
The objective of this study is to determine the concentrations of THM in drinking water from three different sources in Florianopolis-Brazil that are submitted to the same chemical treatment. Furthermore, a correlation between the THM concentration and the drinking water origin was investigated.
Experimental
Instrumentation
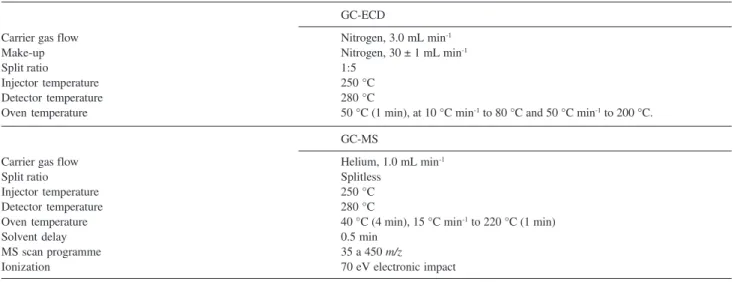
All chromatographic analyses were done using a gas chromatograph (GC) CP-3800 model (Varian, California, USA) equipped with an electron capture detector (ECD) and a split/splitless injector. The column for chromatographic separation was HP-5, 30 m × 0.32
mm × 0.25 µm. GC operation conditions are shown in
Table 1. Identification of the compounds was confirmed by a HP 5890 Series II GC (Hewlett Packard, Hopkins, M.N., EUA) coupled to a mass spectrometer with split/ splitless injector. Instrumental operation conditions are
shown in Table 1. Chromatographic separation was
achieved using a fused silica HP-5 MS capillary column; 30 m × 0.25 mm × 0.25 µm. All injections
were done manually.
Analyses were done using a Tekmar 3100-Purge and Trap (PT) concentrator (Dohrmann, Cincinnati, Ohio, USA) coupled to the CP-3800 GC (Varian). Sample
purge (20 mL min-1 for 11 minutes) and analytes
transportation to the GC were done with ultra pure N2 ECD (IBG, Itajaí, SC). Compounds were adsorbed onto
the trap with a VOCARBTM 4000 adsorbent (Supelco,
Bellefonte-PA, USA). Prior to desorption, dry purging was carried out by passing only N2 gas through the trap for 1 minute to eliminate any trace of humidity. For desorption, the trap was pre-heated initially at 230 °C (no gas flow) and then increased to 250 °C at which point the gas was allowed to carry the confined compounds through a heated transfer line (150 °C) to the GC injector. Desorption was done for a minute. A
Table 1. GC-ECD and GC-MS operational conditions
GC-ECD
Carrier gas flow Nitrogen, 3.0 mL min-1
Make-up Nitrogen, 30 ± 1 mL min-1
Split ratio 1:5
Injector temperature 250 °C
Detector temperature 280 °C
Oven temperature 50 °C (1 min), at 10 °C min-1 to 80 °C and 50 °C min-1 to 200 °C.
GC-MS
Carrier gas flow Helium, 1.0 mL min-1
Split ratio Splitless
Injector temperature 250 °C
Detector temperature 280 °C
Oven temperature 40 °C (4 min), 15 °C min-1 to 220 °C (1 min)
Solvent delay 0.5 min
MS scan programme 35 a 450 m/z
glass syringe (SGE, Australia) was used to introduce the samples in the PT system. Both injection syringe and purge vessel were rinsed three times with the sample before each analysis and rinsed three times with deionized Milli-QTM water free from volatiles after each
extraction. After each extraction, the desorption system was cleaned for 4 minutes and trap kept at 260 °C.
Headspace-solid-phase microextraction (HS-SPME) technique was used in the extraction of THM. A polydimethylsiloxane (PDMS) fiber (Supelco, Bellefonte, P.A., USA) with a 100 µm thickness was used.
Headspace and sample volumes used were 5 mL and 10 mL, respectively, with an equilibration time set at 30 min.
Chemicals, solutions and samples
Standard stock solutions of chloroform (Tedia, Fairfield, Ohio, U.S.A.), bromodichloromethane, chlorodibromomethane (Sigma-Aldrich, Milwaukee, WI, EUA) and bromoform (Synth, Diadema, SP, Brazil) were directly diluted in ultrapure methanol (Vetec, Rio de Janeiro, RJ, Brazil) to give 4700 mg L-1, 2500 mg L
-1, 2500 mg L-1 and 5080 mg L-1 concentrations,
respectively.
THM working solutions were prepared with
deionized Milli-QTM water (Millipore, Bedford, MA,
EUA) boiled for 4 hours to remove any volatile residue. Standard aqueous solutions of 1.0 µg L-1 were used to
optimize the PT system and the calibration plot range from 0.1 to 8.0 µg L-1. All solutions were prepared daily
and stored refrigerated at 4 °C.
Salting-out effect was evaluated with anhydrous sodium sulphate, analytical grade (Reagem).
Sodium thiosulfate solution (Na2S2O3) 10% (m/v) (Synth, Diadema, São Paulo), prepared by direct dilution in deionized water, was added to samples to prevent any oxidative effect of chlorine on organic matter during transportation and storage.
Flask preparation for sample collection
Lidded glass flasks (125 mL) were used to collect samples and kept in neutral detergent Extran (Merck, Rio de Janeiro, RJ) for 24 hours. The samples were later washed with enough water, rinsed with deionized Milli-Q water and then dried in the oven. All the lids were wrapped in aluminum foil and the flasks were wrapped in brown paper. Each flask was sterilized in an autoclave at 175 °C for two hours. Prior to sampling, three drops of Na2S2O3 10% (m/v) (Synth) were added to each flask.
Sample collection
Water samples of the Florianopolis public water system, which included the North shore, east/south shore and Cubatao/Piloes systems, were collected directly from the water stations.
All the three supplier systems evaluated are submited to the same chemical treatment. Firstly, the water is filtered, except north shore system in which ground water is collected, followed by chlorine addition (disinfection), fluorine (cavity prevention) and lime (pH correction). Three areas were involved.
North shore system
Three samples were collected from the treatment station at Sitio Capivari. Samples collected reflect before and after chlorination treatment and after the addition of chlorine and fluorine to the water. A total of 25 samples were collected from different distribution systems in eight districts.
East/South shore system
In this system 21 samples were collected.Four samples were collected at the Morro das Pedras treatment station. Among the four samples, one each was obtained directly from the Peri Lake and the distribution reservoir while the remaining two were collected after the filtration process and the addition of aluminum sulfate respectively. The other 17 samples were collected along the distribution system.
Cubatão-Pilões system
A total of fifteen samples were collected directly from the distribution system. In this system, no sample was collected before disinfection treatment.
In other to avoid any headspace in the flasks, each of the flask was fully filled. All the samples were transported and stored at low temperatures.
Analyses of natural sources
Seven samples from natural springs were analyzed in order to compare and investigate for the possible presence of THM.
Test with household filters
Results and Discussions
Salting-out effect
Salting-out involves the addition of salt to a solution, which results either in changes in steam, partial pressure, solubility, thermal conductivity, density and superficial tension of an analyte. Such changes occur as a result of variation of the system’s steam/liquid equilibrium.8 Purge
efficiency with matrix difference was evaluated by adding anhydrous sodium sulfate close to saturation concentration in water samples containing 10 µg L-1 of each THM. No
significant variation was observed with the introduction of increasing amounts of sodium sulfate. However, at 100 g L-1 sodium sulfate, a slight increase in the peak
area of each analyte was observed. A major disadvantage was that precipitation began at this concentration during purging and also in the sample injection channel. Therefore, no further additions were made due to the lack of significant influence over the system.
Purge efficiency
Efficiency of two successive purges for the same sample was evaluated by comparing the amount of THM recovered during each extraction with the total recovered after the two purges. Figure 1 shows the percent recovery for each purge for two different solutions at concentrations of 2.0 and 10.0 µg L-1. Practically one exhaustive extraction occurs
during the first purge, except for the extraction of bromoform and chlorodibromomethane. Only one purge was done for every experiment of this study.
Merit analytical parameters
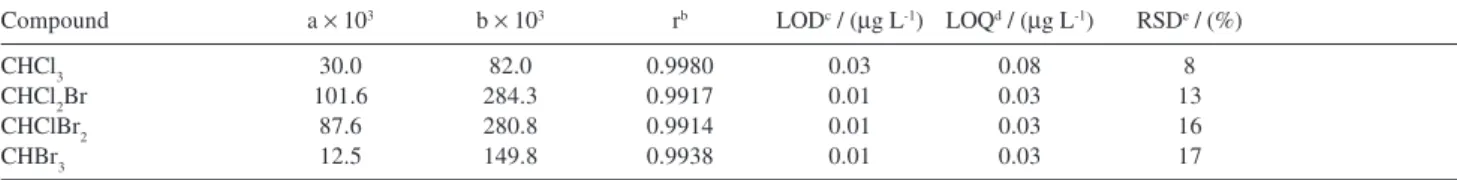
Table 2 presents the merit analytical parameters for each compound. Analyzed concentrations ranged between 0.1 and 8.0 µg L-1. Extractions were done in triplicate.
Correlation coefficients (r) were greater than 0.9914, demonstrating high correlation between concentration and chromatographic area for the compounds studied. Precision of the method was evaluated using relative standard deviation (RSD), which ranged between 8 and 17 % (n = 7).
Limit of detection (LOD) was calculated as the ratio between 3.3 times the standard deviation of ten successive readings of the blank and the angular coefficient of the calibration curve. Limit of quantification (LOQ) was calculated as the ratio between 10 times the relative deviation of the calibration curve and the angular coefficient of the calibration curve.
To evaluate the method accuracy the recovery test was done using different samples by the enrichment technique. Two representative samples, from samples with high and low THM concentrations were chosen. Results are presented in Table 3.
Many samples had to be diluted because their concentrations were above working range. An example is sample 4 from the Cubatão-Pilões system. Recovery test for that sample was done with the same dilution procedure employed in the quantification of the sample without adding the standard.
As seen in Table 3, the method did not present problems with matrix effects because recovery of compounds in the PT system presented values within acceptable limits.
Investigation of the possible presence of trihalomethanes in natural water sources
The presence of THM was below the LOD of the method employed. This can be attributed to the fact that those water samples were not treated, meaning they were
Table 2. Merit analytical parameters for determination of THM using P&T method
Compound a × 103 b × 103 rb LODc / (µg L-1) LOQd / (µg L-1) RSDe / (%)
CHCl3 30.0 82.0 0.9980 0.03 0.08 8
CHCl2Br 101.6 284.3 0.9917 0.01 0.03 13
CHClBr2 87.6 280.8 0.9914 0.01 0.03 16
CHBr3 12.5 149.8 0.9938 0.01 0.03 17
a = linear coefficient; b = angular coefficient; b correlation coefficient; c limit of detection; d limit of quantification; e relative standard deviation of the method.
not exposed to chlorination reactions. Results agree with similar studies conducted elsewhere.9,10
Determination of THM in the Florianopolis water distribution system
Sixty-two water samples from the Florianopolis public water system were collected and analyzed using an optimized PT system. Samples involved different districts in the island and a site corresponding to Estreito, a district in the mainland. Many of the samples were diluted because their concentrations were above the working range (dilution efficiency was also evaluated in the recovery test). They were diluted in deionized and boiled water to completely remove volatile compounds.
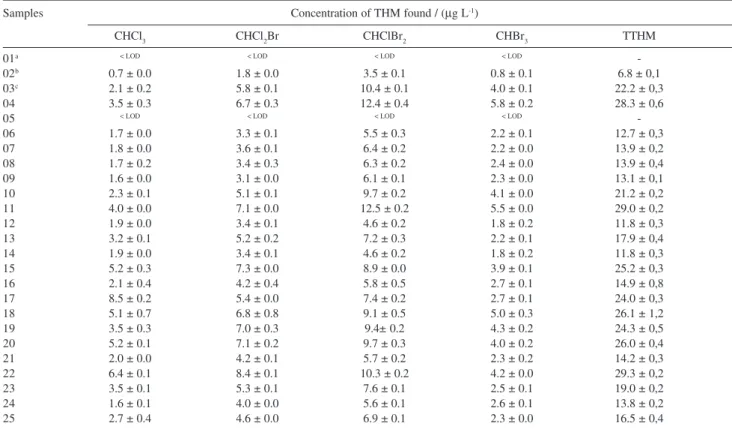
Results from collection and analysis are presented in Tables 4, 5 and 6. Table 4 corresponds to the North shore system and a balanced formation of the four
THM is observed. In some samples CHClBr2 was the
most formed compound but the difference was not significant. TTHM values for this area are relatively low when compared to the limit determined by Decree
518 from the Brazilian Ministry of Health.11 The
average concentration observed was 19.4 ± 2.1 µg
L-1 of TTHM.
Samples 1, 2 and 3 in Table 4 correspond to the samples collected before the addition of any disinfectant, after chlorination, and final sample with chlorine and fluorine, respectively. Samples were collected in the Water Treatment Station (WTS) at Sitio Capivari.
Table 3. Recovery tests for trihalomethanes in samples from Cubatão-Pilões water system
Samples Ca / (µg L-1) CHCl
3 CHCl2Br CHClBr2 CHBr3
Eb Rc E R E R E R
4-Cubatão 0.0 49.0 - 21.3 - 0.96 - 0.0
30.0 77.0 93.3 48.7 91.3 31.2 100.8 32.7 109.0
8-Cubatão 0.0 4.31 - 2.57 - 0.10 - 0.0
3.0 7.34 101.0 5.82 108.3 3.32 107.3 3.67 126.0
a Spiked Concentration; b concentration found in mg L-1; c recovery in %.
Table 4. Concentration of THM found in water samples from 9 districts of Florianópolis supplied by North Shore system
Samples Concentration of THM found / (µg L-1)
CHCl3 CHCl2Br CHClBr2 CHBr3 TTHM
01a < LOD < LOD < LOD < LOD
-02b 0.7 ± 0.0 1.8 ± 0.0 3.5 ± 0.1 0.8 ± 0.1 6.8 ± 0,1
03c 2.1 ± 0.2 5.8 ± 0.1 10.4 ± 0.1 4.0 ± 0.1 22.2 ± 0,3
04 3.5 ± 0.3 6.7 ± 0.3 12.4 ± 0.4 5.8 ± 0.2 28.3 ± 0,6
05 < LOD < LOD < LOD < LOD
-06 1.7 ± 0.0 3.3 ± 0.1 5.5 ± 0.3 2.2 ± 0.1 12.7 ± 0,3
07 1.8 ± 0.0 3.6 ± 0.1 6.4 ± 0.2 2.2 ± 0.0 13.9 ± 0,2
08 1.7 ± 0.2 3.4 ± 0.3 6.3 ± 0.2 2.4 ± 0.0 13.9 ± 0,4
09 1.6 ± 0.0 3.1 ± 0.0 6.1 ± 0.1 2.3 ± 0.0 13.1 ± 0,1
10 2.3 ± 0.1 5.1 ± 0.1 9.7 ± 0.2 4.1 ± 0.0 21.2 ± 0,2
11 4.0 ± 0.0 7.1 ± 0.0 12.5 ± 0.2 5.5 ± 0.0 29.0 ± 0,2
12 1.9 ± 0.0 3.4 ± 0.1 4.6 ± 0.2 1.8 ± 0.2 11.8 ± 0,3
13 3.2 ± 0.1 5.2 ± 0.2 7.2 ± 0.3 2.2 ± 0.1 17.9 ± 0,4
14 1.9 ± 0.0 3.4 ± 0.1 4.6 ± 0.2 1.8 ± 0.2 11.8 ± 0,3
15 5.2 ± 0.3 7.3 ± 0.0 8.9 ± 0.0 3.9 ± 0.1 25.2 ± 0,3
16 2.1 ± 0.4 4.2 ± 0.4 5.8 ± 0.5 2.7 ± 0.1 14.9 ± 0,8
17 8.5 ± 0.2 5.4 ± 0.0 7.4 ± 0.2 2.7 ± 0.1 24.0 ± 0,3
18 5.1 ± 0.7 6.8 ± 0.8 9.1 ± 0.5 5.0 ± 0.3 26.1 ± 1,2
19 3.5 ± 0.3 7.0 ± 0.3 9.4± 0.2 4.3 ± 0.2 24.3 ± 0,5
20 5.2 ± 0.1 7.1 ± 0.2 9.7 ± 0.3 4.0 ± 0.2 26.0 ± 0,4
21 2.0 ± 0.0 4.2 ± 0.1 5.7 ± 0.2 2.3 ± 0.2 14.2 ± 0,3
22 6.4 ± 0.1 8.4 ± 0.1 10.3 ± 0.2 4.2 ± 0.0 29.3 ± 0,2
23 3.5 ± 0.1 5.3 ± 0.1 7.6 ± 0.1 2.5 ± 0.1 19.0 ± 0,2
24 1.6 ± 0.1 4.0 ± 0.0 5.6 ± 0.1 2.6 ± 0.1 13.8 ± 0,2
25 2.7 ± 0.4 4.6 ± 0.0 6.9 ± 0.1 2.3 ± 0.0 16.5 ± 0,4
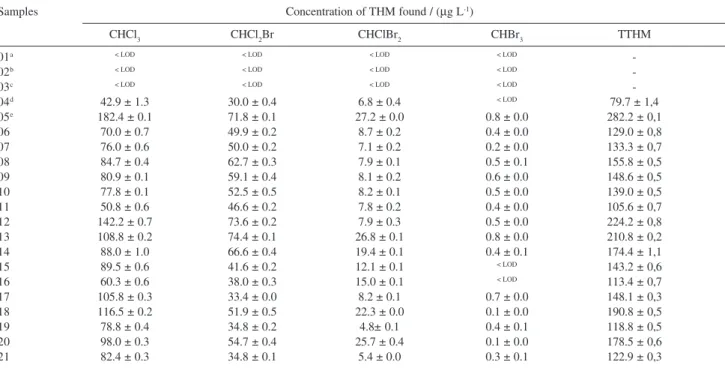
The five first samples in Table 5 were collected in the WTS at the Peri Lake municipal park and they correspond to 2 samples collected directly from the lake, sample after filtration, after addition of aluminum sulfate, from distribution reservoirs (chlorine already added) and at the beginning of the distribution system, respectively.
In all samples collected inside the treatment station prior to chlorination, no THM was observed. In addition to the fact that natural sources did not present such compounds this result is evidence of the relationship between water chlorination and THM formation.
Practically all results from the second area (Table 5), East/South shore system, were above maximum concentration determined by law, which is 100 µg L-1 of
TTHM. The average concentration found was of
approximately 152.3 ± 2.5 µg L-1. Chloroform and
bromodichloromethane were the compounds found in higher concentrations.
As seen in Table 6, bromoform was below detection limit in all samples and chloroform was the most formed compound. Mean TTHM concentration was 63.0 ± 1.3
µg L-1 fitting within the allowed range. Unfortunately, in
this system, no sample could be analysed before disinfection system.
The differences in the concentrations of these samples may probably due to the fact that they are from different water sources.
Best results were found in the area supplied by the North shore system, where water is taken from wellsprings that have less contact with any type of pollution and present very low organic matter.
Precursors of THM appearance in water are due to the decomposition of plants on the river and lake beds, more abundant in protected water sources with more vegetation on the margins. Such conditions were found in two of the sources studied.
Vegetation on the Cubatao Sul river basin is part of the native forest or Atlantic Forest. Currently, the vegetation is extensively been exploited by the felling of trees of high economic value to pasture and agriculture. Nevertheless, due to the steep landscape of difficult access, a great part of the forest is original. This can also influence the amount of organic matter present in such water sources and consequently the formation of THM.
Peri Lake is completely surrounded by vegetation, limited by a narrow strip of land separating it from the sea. The lake is also limited by hills on the south and north borders, covered with Atlantic Rain Forest, receiving vegetal matter from the surroundings. Furthermore, one of the main issues observed in the Peri lake water system is the presence of algae and cyanobacteria, commonly called blue-green algae, causing higher consumption of chemicals, chlorine, high water turbidity, reduction in disinfection, high organic matter and off-flavour. These are the main issues that influence the high formation of THM in treated waters coming from the lake. Table 5. Concentration of THM found in water samples from 7 districts of Florianópolis supplied by East shore system
Samples Concentration of THM found / (µg L-1)
CHCl3 CHCl2Br CHClBr2 CHBr3 TTHM
01a < LOD < LOD < LOD < LOD
-02b < LOD < LOD < LOD < LOD
-03c < LOD < LOD < LOD < LOD
-04d 42.9 ± 1.3 30.0 ± 0.4 6.8 ± 0.4 < LOD 79.7 ± 1,4
05e 182.4 ± 0.1 71.8 ± 0.1 27.2 ± 0.0 0.8 ± 0.0 282.2 ± 0,1
06 70.0 ± 0.7 49.9 ± 0.2 8.7 ± 0.2 0.4 ± 0.0 129.0 ± 0,8
07 76.0 ± 0.6 50.0 ± 0.2 7.1 ± 0.2 0.2 ± 0.0 133.3 ± 0,7
08 84.7 ± 0.4 62.7 ± 0.3 7.9 ± 0.1 0.5 ± 0.1 155.8 ± 0,5
09 80.9 ± 0.1 59.1 ± 0.4 8.1 ± 0.2 0.6 ± 0.0 148.6 ± 0,5
10 77.8 ± 0.1 52.5 ± 0.5 8.2 ± 0.1 0.5 ± 0.0 139.0 ± 0,5
11 50.8 ± 0.6 46.6 ± 0.2 7.8 ± 0.2 0.4 ± 0.0 105.6 ± 0,7
12 142.2 ± 0.7 73.6 ± 0.2 7.9 ± 0.3 0.5 ± 0.0 224.2 ± 0,8
13 108.8 ± 0.2 74.4 ± 0.1 26.8 ± 0.1 0.8 ± 0.0 210.8 ± 0,2
14 88.0 ± 1.0 66.6 ± 0.4 19.4 ± 0.1 0.4 ± 0.1 174.4 ± 1,1
15 89.5 ± 0.6 41.6 ± 0.2 12.1 ± 0.1 < LOD 143.2 ± 0,6
16 60.3 ± 0.6 38.0 ± 0.3 15.0 ± 0.1 < LOD 113.4 ± 0,7
17 105.8 ± 0.3 33.4 ± 0.0 8.2 ± 0.1 0.7 ± 0.0 148.1 ± 0,3
18 116.5 ± 0.2 51.9 ± 0.5 22.3 ± 0.0 0.1 ± 0.0 190.8 ± 0,5
19 78.8 ± 0.4 34.8 ± 0.2 4.8± 0.1 0.4 ± 0.1 118.8 ± 0,5
20 98.0 ± 0.3 54.7 ± 0.4 25.7 ± 0.4 0.1 ± 0.0 178.5 ± 0,6
21 82.4 ± 0.3 34.8 ± 0.1 5.4 ± 0.0 0.3 ± 0.1 122.9 ± 0,3
< LOD: below limit of detection; a W.T.S. directly from Peri Lake; b W.T.S. after filtering; c W.T.S. after aluminium sulphate; d W.T.S. reservoir tank
Considering the high toxicity, carcinogenic, teratogenic and mutagenic potential, and all means of contamination, results from the East/South shore system is worrisome.
Filtered water was also analyzed in the attempt to find a way to reduce ingestion of THM. The filters used were conventional household ones previously mentioned, one with UV filtration and another with active charcoal cartridges.
Samples were taken from the Cubatao-Piloes system. Significant reduction was observed in both filters. Sample 15 was filtered and disinfected with UV light and reduction in TTHM concentration after filtration was 95.8%. Sample 16 was filtered with active charcoal and reduction in concentration was 91.6%.
Results from the filtered samples were better than those found by Campillo et al.,3 who showed a reduction of the
TTHM concentration from 128.7 to 26.0 µg L-1 (79.8%
reduction), however the filtration process was not specified.
Conclusion
Natural spring water and wellsprings were analyzed and no THM was detected. Water samples in the treatment stations before disinfection gave the similar results, showing the need of chlorination for the formation of THM. With regards to water sources surrounded by vegetation, THM concentration was high. In the Peri Lake case, the presence of algae and blue-green algae is an aggravating fact. THM concentrations were very high, above the limit allowed by law.
Household filters were efficient in reducing THM and were proven to be a simple alternative method for reducing the possible exposure to these compounds.
Acknowledgments
The authors thank Laboratório Central de Santa Catarina (Lacen) for instrumental support, Conselho Nacional de Desenvolvimento Cientifico e Tecnológico (CNPq) and FUNCITEC for financial support.
References
1. Kostopoulou, M. N.; Golfinopoulos, S. K.; Nikolaou, A. D.; Xilourgidis, N. K.; Lekkas, T. D.; Chemosphere 2000, 40,527. 2. Campillo, N.; Vinas, P.; Lopez-Garcia, I.; Aguinaga, N.;
Hernandez-Cordoba, M.; J. Chromatogr. A2004,1035,1. 3. Campillo, N.; Vinas, P.; Lopez-Garcia, I.; Aguinaga, N.;
Hernandez-Cordoba, M.; Talanta2004, 64,584.
4. Fantuzzi, G.; Righi, E.; Predieri, G.; Ceppelli, G.; Gobba, F.; Aggazzotti, G.; Sci. Total Environ.2001, 264,257.
5. Lee, S. C.; Guo, H.; Lam, S. M. J.; Lau, S. L. A.; Environ. Res. 2004, 94,47.
6. US EPA, National Primary Drinking Water Regulations: Disinfectants and Disinfection By-products Rule: Final Rule, Fed. Reg. 63,241, 68390, December 16, 1998.
7. German UBA, Ordinance amending the drinking water ordinance: Ordinance on the quality of water intended for human consumption, Ob Nr 222/02, May 21, 2001.
8. Cho, D.-H.; Kong, S.-H.; Oh, S.-G.; Water Res.2003, 37,402. 9. Zhao, R.-S.; Lao, W.-J.; Xu, X.-B.; Talanta2004,62,751. 10. Golfinopoulos, S. K.; Kostopoulou, M. N.; Lekkas, T. D.; Water
Res.1998, 32,1811.
11. Portaria 518 do Ministério da Saúde da República Federativa do Brasil, Brasil, 25 de março de 2004.
Received: July 20, 2006
Web Release Date: June 29, 2007 Table 6. Concentration of THM found in water samples from 9 districts of Florianópolis supplied by Cubatão-Pilões system
Samples Concentration of THM found / (µg L-1)
CHCl3 CHCl2Br CHClBr2 CHBr3 TTHM
01 56.3 ± 0.3 11.2 ± 0.1 0.5 ± 0.1 < LOD 68.0 ± 0,3
02 53.0 ± 0.5 5.5 ± 0.0 0.8 ± 0.4 < LOD 59.3 ± 0,6
03 49.0 ± 0.1 17.9 ± 0.0 0.2 ± 0.0 < LOD 60.3 ± 0,1
04 62.8 ± 0.0 7.5 ± 0.0 0.7 ± 0.1 < LOD 71.0 ± 0,1
05 49.0 ± 0.0 21.3 ± 0.0 1.0 ± 0.1 < LOD 71.3 ± 0,1
06 41.3 ± 0.1 5.9 ± 0.1 0.1 ± 0.0 < LOD 47.3 ± 0,1
07 46.0 ± 0.1 22.3 ± 0.0 1.4 ± 0.0 < LOD 69.8 ± 0,1
08 38.4 ± 0.2 4.6 ± 0.1 < LOD < LOD 43.0 ± 0,2
09 41.4 ± 0.4 16.1 ± 0.0 0.8 ± 0.0 < LOD 58.3 ± 0,4
10 43.2 ± 0.2 13.8 ± 0.1 40.4 ± 0.0 < LOD 57.4 ± 0,2
11 40.3 ± 0.6 12.9 ± 0.3 0.4 ± 0.0 < LOD 53.6 ± 0,7
12 49.4 ± 0.4 10.9 ± 0.3 0.3 ± 0.0 < LOD 60.6 ± 0,5
13 55.0 ± 0.3 5.0 ± 0.1 < LOD < LOD 60.0 ± 0,3
14 52.7 ± 0.0 4.4 ± 0.2 < LOD < LOD 57.0 ± 0,2
15 46.4 ± 0.1 14.2 ± 0.0 0.9 ± 0.1 < LOD 61.5 ± 0,1