Trends in the Risk of Death from Cardiovascular, Cerebrovascular and
Ischemic Diseases in Thirteen States of Brazil from 1980 to 1998
Antonio de Padua Mansur, Maria de Fátima Marinho de Souza, Ari Timerman, Solange Desirée Avakian, José Mendes
Aldrighi, José Antonio Franchini Ramires
Instituto do Coração do Hospital das Clínicas – FMUSP, Departamento de Análise de Situação de Saúde, Secretaria de Vigilância Sanitária, Ministério da Saúde – Brasília e Instituto Dante Pazzanese de Cardiologia, São Paulo, SP – Brasília, DF, Brazil
objective: Analyze the trends in the risk of death from circulatory diseases (CD) in thirteen states in Brazil between 1980 and 1998.
Methods: Data on mortality from CD, ischemic heart diseases (IHD), and cerebrovascular diseases (CVD) in thirteen states were obtained from the Ministry of Health data base. Populational estimates from 1980 to 1998 were calculated through interpolation, using the Lagrange method, based on data from the 1970, 1980, 1991 censuses, and 1996 populational count. The trends were analyzed by multiple linear regression model.
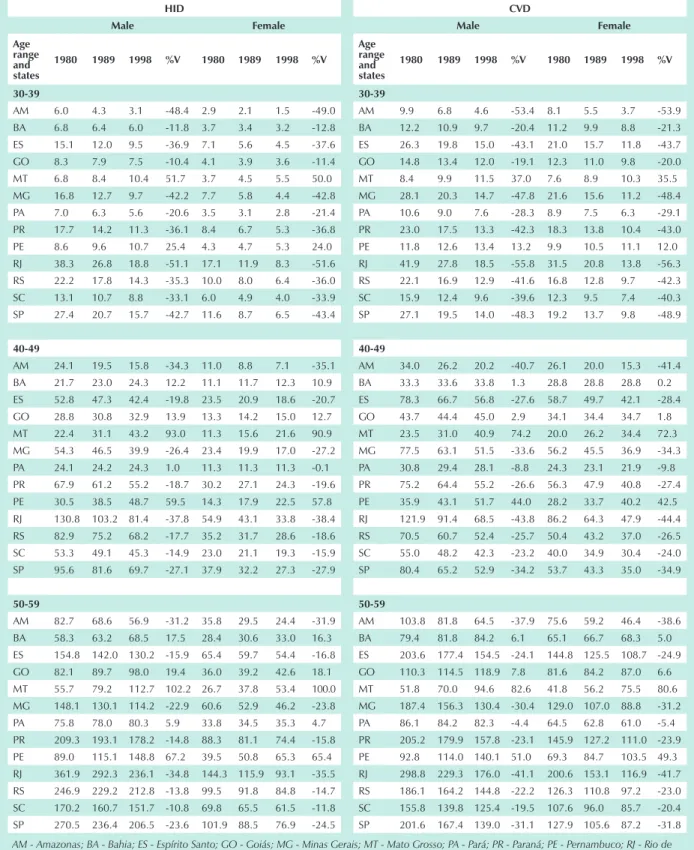
Results: Mortality due to CD showed a trend towards decrease in most states. In Pernambuco state males presented increase in all age ranges, whereas in Goiás increase was shown from 40 years of age on, and in Bahia and Mato Grosso, from 50 years of age. Females showed increase starting at 30 in Mato Grosso, at 40 in Pernambuco, and in Goiás, in the age ranging from 30 to 49 years of age. In Goiás, increase was discreet in all other age ranges. As for IHD, mortality increase was reported in all age ranges in Mato Grosso and Pernambuco; in Bahia, Goiás and Pará, from 40 on. As for CVD, mortality increase was reported in all age ranges in Mato Grosso and Pernambuco; and from 40 on in Bahia and Goiás.
Conclusion: Significant increase in the risk of death from circulatory diseases could be observed in less developed states in Brazil.
key words: Circulatory diseases, mortality, epidemiology, Brazil.
Mailing Address: Antonio de padua Mansur •
InCor - Av. Dr. Enéas de Carvalho Aguiar, 44 05403-000 – São Paulo, SP, Brazil
Circulatory disease (CD) – the major cause of death in Brazil
– showed a decline trend in ≥ 30-year-old males and females
from 1984 to 19961. From all CDs, isquemic heart disease (IHD)
and cerebro vascular disease (CVD) are to be pointed out, both having shown the same trend. IHD and CVD were equally important in males, whereas in females CVD mortality rate was almost twice as high when compared to IHD. A later study analyzed mortality rate from CD in the five geographical regions in Brazil. The same decline trend was shown in the population
≥ 30 years of age in Southern, Southeastern, and Northern
Brazil.2 In the Northeastern and Center-Western regions, the
risk of death showed increase due to CD, and the same trend was observed after isolated analyses on IHD and CVD. Those distinctive findings in the different geographic regions have shown the relevance and the variability of regional analysis of CD as well as of the risk of death in the most unfavored regions from the social and economic point of view. Those characteristics were more evident when mortality rate was analyzed in all five regions, in eleven Brazilian capitals3.
CD showed a decline trend in most capitals, except for discreet increase in Brasília Federal District. Porto Alegre, Curitiba, Rio de Janeiro, Cuiabá, Goiânia, Belém and Manaus
all showed decline in the risk of death from IHD and CVD. Brasília showed IHD and CVD increase; São Paulo showed discreet IHD increase both for males and females in the age range between 30 and 39 years of age, and in females in the age range between 40 and 59. In São Paulo state, however, a recent study has shown a decline in ischemic heart diseases between 1980 and 1996. Such decline was more significant in males (-1,2%)4. In Recife and Salvador CD reduction was
shown in all age ranges, both in males and females, although Recife reported IHD increase in younger age ranges (30-49),
downwards to a discreet (-4%) in males ≥ 70y.
Characteristics detected in capitals, however, are not necessarily a mirror image of the corresponding state. Therefore, the present study had the purpose to analyze the risk of death from CD, IHD and CVD in thirteen Brazilian states.
Methods
reduction of the risk of death from CD, being -8% for males
and 0% for females, respectively, in the ≥ 70 age range. As for
IHD and CVD, RJ was the state to report best results. 3) GO and MT (Center-Western Region): generally speaking, a trend towards CD, IHD and CVD increase in GO and MT states, with the following exceptions: a) CD decline in GO both in males and females in the 30-39 age range, and females in the 50-59 age range; IHD and CVD reduction both in males and females in the 30-39 year-old age range; b) CD reduction in MT state in males, in the 30-49 year-old age range. 4) BA and PE (Northeastern Region): a) slight increase in the risk of death from CD in Bahia in the 50-59-year-old age range in males, and both in males and females for subsequent age ranges. Mortality rate increrase due to IHD and CVD in BA for all age ranges - both males and females – except in the 30-39-year-old age range; b) increase in the risk of death due to CD, IHD and CVD in all age ranges both for males and females, except for CD in 30-39-year-old females. 5) AM and PA (Northern Region): Mortality rate decrease due to CD, IHD and CVD in AM; and due to CD and CVD in PA. Mortality rate increase due to IHD in PA in the age ranges above 40 years of age.
Discussion
The present study showed the same trend for risk of death increase in the Northeastern and Center-Western Regions, and of decrease in the Southern, Southeastern, and Northern Regions2. Similar behavior was detected while analyzing
mortality rate due to CD in major capital cities in the same regions3. Those data suggest that despite the fact that some
reduction in mortality rate from those diseases could be observed in Brazil as a whole1, analysis per region and per age
range showed different results. Less favored regions, states and capitals – from the social and economic point of view – were the ones showing mortality rate increase due to mortalidade from CD, IHD and CVD. It is interesting to point out that mortality rate from CVD in males was significantly higher in the different states when compared to IHD.
Such finding was less evident in previous studies on geographic regions and major capitals, therefore showing the relevant role played by CVD in the risk for death due to CD in those states as a whole, except in their capital areas. Such data are extremely relevant, since they may act as flagpoles for public health policies. Hypothetically, for instance, public health programs focusing mostly hypertension control may be more impacting in reducing CD in the states as a whole, whereas in the capital areas programs should consider other risk factors, weather conditions included 13.
Mortality rate increase in those states may have been influenced by: 1) improved diagnosis for the cause of death; 2) the results from higher urbanization level; 3) worse social and economic conditions in the region; 4) low schooling; and 5) other reasons, still questionable, which include from body weight at birth14 to nutritional15, cultural16,
and behavioral17 aspects. Worsened social and economic
de Janeiro (RJ) and São Paulo (SP); South: Paraná (PR), Rio Grande do Sul (RS) and Santa Catarina (SC).
Data on CD, IHD and CVD mortality rate were obtained from the Ministry of Health for the period between 1980 and 19985. Populational estimates on July 1,1980 and July 1,1998
in the thirteen Brazilian states were calculated using Lagrange interpolation method and based on 1980 and 1991 Censuses, as well as on the 1996 populational count, for each age range and gender7-10.
For the 1979-1995 period deaths followed CID-9 classification – 9th Conference on International Disease
Classification, 1975, adopted by the 20th World Health
Assembly. CDs are grouped in codes 390-459; IHDs in codes 410-414; and CVDs in codes 430-438 in IDC 9th revision for
the Brazilian population in the period between 1979 and 1995. Mortality rate between 1996 and 1998 was classified by IDC 10th revision. CDs are grouped in codes 390-459;
IHDs in codes 410-414; and CVDs in codes 430-438 in IDC 9th revision for the Brazilian population in the period between
1979 and 1995. Mortality rate between 1996 and 1998 was classified by IDC 10th revision.
Statistical Analysis -Multiple linear regression model was used.11,12 Information on mortality rate from all CDs were
modeled; followed by data on mortality rate from IHD and CVD. Natural logarithm of gross coefficient (number of deaths/population following July 1 estimate) was used as dependent variable. Independent variables were IHD and CVD, the thirteen Brazilian states, gender, years of study calendar (1980 -1996), age ranges (30-39, 40-49, 50-59, 60-69, 70 and higher) and their respective interactions. A partial F test was carried out to remove interactions that were not significant for the models. The purpose was to reach modeling process final stage with the lowest number of interactions possible. Models adjustment was tested by residue analysis and by correlation coefficient. Residue analyses were carried out through envelope-type graphs and model residue graphs vs values adjusted to evaluate the adjustment of adopted models.
Results
The trends for the risk of death from CD that have been observed can be found in Table 1. Coefficients are presented in Neperian logarithm following age range and gender (Fig.1), and in three columns -1980, 1989 and 1998 series - as well as percentual variation between 1980 and 1998 (Table 2). Residue analysis showed good adjustment of multiple linear regression model.
the hypertension management – a low cost logistic factor with high social return.
Limitations of the study -Mortality rate levels available at the Ministry of Health information system are subject to problems such as: diagnosis errors, deficiencies in filling out death declarations, a number of deaths with no clear cause, and errors in entering data. Validation studies for mortality rate information are non-existent in most states, and cities and town in this country. However, an indirect indicator for data quality control is the number of death certificates with the cause of death as “poorly defined symptoms, signals, and affections”, which is still significant in most Brazilian towns in the Northeastern, Northern and Center-Western regions.
developed regions in Brazil, in their turn, showed a reduction in mortality rate, as observed in recent study21. Southern and
Southeastern regions were the ones to show the best results. General reduction over 20% for IHD was observed in MG, SP and RJ states, with RJ showing stronger decline (> 30%). As for CVD, decline was even higher in the same regions, and again RJ was the one most favored - over 40% as a whole. Most appropriate control of risk factors and better tertiary assistance to the population most probably influenced such significant lower figures in those states.
We could propose that better social and economic conditions, as well as appropriate health services in less favored states may revert the trend of death risk increase from CD, particularly CVD. The latter depend mostly on diagnosis and
0 0,001 0,002 0,003 0,004 0,005 0,006 0,007 0,008 0,009 0,01
1980 1982 1984 1986 1988 1990 1992 1994 1996 1998
Year c o e ffi c ie n t
ES PA MG MT PR SC GO AM
RS PE RJ SP BA
ES PA MG MT PR SC GO AM
RS PE RJ SP BA
0 0,0008 0,0016 0,0024 0,0032 0,004 0,0048
1980 1982 1984 1986 1988 1990 1992 1994 1996 1998
Year c o e ffi c ie n t
ES PA MG MT PR SC GO AM
RS PE RJ SP BA
0 0,005 0,01 0,015 0,02 0,025
1980 1982 1984 1986 1988 1990 1992 1994 1996 1998 Year c o e ffi c ie n t
ES PA MG MT PR SC GO AM
RS PE RJ SP BA
0 0,002 0,004 0,006 0,008 0,01 0,012
1980 1982 1984 1986 1988 1990 1992 1994 1996 1998
Year c o e ffi c ie n t
ES PA MG MT PR SC GO AM
RS PE RJ SP BA
0 0,01 0,02 0,03 0,04 0,05 0,06 0,07 0,08
1980 1982 1984 1986 1988 1990 1992 1994 1996 1998
Year c o e ffi c ie n t
ES PA MG MT PR SC GO AM
RS PE RJ SP BA
0 0,01 0,02 0,03 0,04 0,05 0,06 0,07
1980 1982 1984 1986 1988 1990 1992 1994 1996 1998
Year c o e ffi c ie n t
Circulatory diseases
Age Range Males females
States 1980 1989 1998 % variation 1980 1989 1998 % variation
30-39 AM 31.5 20.4 15.0 -52.6 21.4 13.0 6.3 -70.4
BA 34.0 31.8 29.6 -13.0 34.6 27.7 20.5 -40.6
ES 65.7 45.7 37.4 -43.1 64.6 41.8 28.3 -56.1
GO 51.7 46.3 40.2 -22.3 43.0 29.9 17.7 -59.0
MG 76.2 66.1 46.5 -39.0 63.5 46.8 28.6 -55.0
MT 50.3 38.8 31.1 -38.3 20.1 25.6 26.8 33.0
PA 31.1 25.7 19.7 -36.8 22.8 18.0 14.6 -36.0
PE 34.4 36.2 38.2 11.2 40.0 28.6 26.1 -34.7
PR 57.7 47.2 34.3 -40.5 50.5 41.7 26.5 -47.5
RJ 101.1 75.4 54.8 -45.8 68.1 50.7 35.6 -47.8
RS 61.0 47.9 34.9 -42.8 45.4 34.6 21.1 -53.5
SC 44.8 35.0 29.6 -34.0 31.2 23.3 16.9 -46.0
SP 75.2 66.8 47.4 -37.0 49.8 35.7 27.4 -45.1
40-49 AM 137.9 73.1 58.4 -57.6 74.1 45.5 39.6 -46.5
BA 99.4 88.7 87.9 -11.6 80.4 70.2 59.4 -26.1
ES 216.1 172.8 137.2 -36.5 132.2 99.8 73.4 -44.5
GO 119.1 128.7 139.1 16.9 71.0 82.8 95.7 34.7
MG 210.1 182.4 152.1 -27.6 149.1 106.0 83.2 -44.2
MT 148.7 135.9 125.0 -16.0 42.8 81.5 102.2 138.6
PA 91.5 79.2 61.9 -32.4 71.1 61.5 53.0 -25.5
PE 132.3 141.3 151.7 14.7 93.0 101.3 119.5 28.5
PR 189.2 169.9 147.9 -21.8 148.4 113.7 102.4 -31.0
RJ 316.0 259.8 199.9 -36.7 187.9 151.3 123.3 -34.4
RS 226.9 163.4 134.6 -40.7 134.0 103.2 83.1 -38.0
SC 146.3 127.0 102.0 -30.3 106.3 90.8 79.6 -25.1
SP 253.0 213.2 176.7 -30.2 148.9 115.8 97.7 -34.4
50-59 AM 284.4 242.7 205.0 -27.9 197.8 134.9 99.9 -49.5
BA 227.8 232.9 233.9 2.7 176.4 171.4 171.0 -3.1
ES 470.3 425.2 390.7 -16.9 242.5 230.7 220.7 -9.0
GO 261.5 308.4 353.8 35.3 225.0 224.8 221.1 -1.7
MG 510.2 467.8 396.4 -22.3 303.7 263.4 207.2 -31.8
MT 211.8 290.8 331.7 56.6 133.3 191.6 275.2 106.5
PA 271.5 244.8 220.8 -18.7 152.7 134.1 122.9 -19.5
PE 319.1 351.3 391.0 22.5 193.0 230.9 276.5 43.3
PR 515.4 487.5 455.3 -11.7 372.6 320.8 277.9 -25.4
RJ 846.2 704.6 532.9 -37.0 422.6 416.8 285.0 -32.6
Circulatory diseases
Age Range Males females
States 1980 1989 1998 % variation 1980 1989 1998 % variation
60-69 AM 745.9 528.2 383.4 -48.6 408.4 368.4 327.0 -19.9
BA 464.0 547.8 552.0 19.0 363.0 398.0 423.5 16.7
ES 1058.7 981.3 904.9 -14.5 605.4 598.7 590.5 -2.5
GO 553.1 681.3 746.2 34.9 607.9 618.2 620.4 2.1
MG 1123.3 1015.4 895.3 -20.3 813.6 692.2 542.5 -33.3
MT 587.4 789.3 895.6 52.5 296.7 389.5 583.6 96.7
PA 656.1 515.9 435.9 -33.6 408.8 369.9 243.7 -40.4
PE 658.0 760.1 893.9 35.8 432.7 436.4 440.4 1.8
PR 1374.5 1223.0 1140.2 -17.0 1008.4 791.8 799.8 -20.7
RJ 1791.1 1539.9 1251.7 -30.1 1057.3 891.0 699.6 -33.8
RS 1422.8 1189.5 1044.0 -26.6 931.2 750.5 608.1 -34.7
SC 1163.4 1082.7 1009.2 -13.3 783.9 631.1 585.5 -25.3
SP 1563.5 1265.7 1092.7 -30.1 971.3 736.0 642.1 -33.9
>70 AM 2760.9 1458.3 1286.7 -53.4 2716.5 1740.8 1223.8 -54.9
BA 1358.1 1359.8 1368.1 0.7 1340.7 1269.2 1236.7 -7.8
ES 3129.1 2967.2 2890.4 -7.6 2397.0 2390.8 2387.3 -0.4
GO 1942.9 2214.1 2441.1 25.6 2131.5 2133.0 2135.7 0.2
MG 3515.9 2961.9 2511.4 -28.6 3296.4 2531.0 1036.2 -68.6
MT 1810.0 2426.4 2660.7 47.0 1501.9 1879.5 2353.9 56.7
PA 1878.1 1628.2 1506.6 -19.8 2093.7 1690.0 1441.9 -31.1
PE 1651.7 1950.7 2279.6 38.0 1629.7 1765.3 2121.3 30.2
PR 4320.0 3884.7 3463.7 -19.8 3783.1 2987.1 2361.8 -37.6
RJ 5244.2 4389.7 3484.3 -33.6 4626.9 3683.2 2936.6 -36.5
RS 4481.7 3639.9 3142.2 -29.9 3975.9 3158.1 2898.8 -27.1
SC 3631.1 3284.3 2870.4 -21.0 3331.0 2808.7 2595.3 -22.1
SP 4970.0 3864.0 3507.6 -29.4 4291.8 3278.1 2986.8 -30.4
Cvd
Male female
Age range and states
1980 1989 1998 %v 1980 1989 1998 %v
30-39
AM 9.9 6.8 4.6 -53.4 8.1 5.5 3.7 -53.9
BA 12.2 10.9 9.7 -20.4 11.2 9.9 8.8 -21.3
ES 26.3 19.8 15.0 -43.1 21.0 15.7 11.8 -43.7
GO 14.8 13.4 12.0 -19.1 12.3 11.0 9.8 -20.0
MT 8.4 9.9 11.5 37.0 7.6 8.9 10.3 35.5
MG 28.1 20.3 14.7 -47.8 21.6 15.6 11.2 -48.4
PA 10.6 9.0 7.6 -28.3 8.9 7.5 6.3 -29.1
PR 23.0 17.5 13.3 -42.3 18.3 13.8 10.4 -43.0
PE 11.8 12.6 13.4 13.2 9.9 10.5 11.1 12.0
RJ 41.9 27.8 18.5 -55.8 31.5 20.8 13.8 -56.3
RS 22.1 16.9 12.9 -41.6 16.8 12.8 9.7 -42.3
SC 15.9 12.4 9.6 -39.6 12.3 9.5 7.4 -40.3
SP 27.1 19.5 14.0 -48.3 19.2 13.7 9.8 -48.9
40-49
AM 34.0 26.2 20.2 -40.7 26.1 20.0 15.3 -41.4
BA 33.3 33.6 33.8 1.3 28.8 28.8 28.8 0.2
ES 78.3 66.7 56.8 -27.6 58.7 49.7 42.1 -28.4
GO 43.7 44.4 45.0 2.9 34.1 34.4 34.7 1.8
MT 23.5 31.0 40.9 74.2 20.0 26.2 34.4 72.3
MG 77.5 63.1 51.5 -33.6 56.2 45.5 36.9 -34.3
PA 30.8 29.4 28.1 -8.8 24.3 23.1 21.9 -9.8
PR 75.2 64.4 55.2 -26.6 56.3 47.9 40.8 -27.4
PE 35.9 43.1 51.7 44.0 28.2 33.7 40.2 42.5
RJ 121.9 91.4 68.5 -43.8 86.2 64.3 47.9 -44.4
RS 70.5 60.7 52.4 -25.7 50.4 43.2 37.0 -26.5
SC 55.0 48.2 42.3 -23.2 40.0 34.9 30.4 -24.0
SP 80.4 65.2 52.9 -34.2 53.7 43.3 35.0 -34.9
50-59
AM 103.8 81.8 64.5 -37.9 75.6 59.2 46.4 -38.6
BA 79.4 81.8 84.2 6.1 65.1 66.7 68.3 5.0
ES 203.6 177.4 154.5 -24.1 144.8 125.5 108.7 -24.9 GO 110.3 114.5 118.9 7.8 81.6 84.2 87.0 6.6
MT 51.8 70.0 94.6 82.6 41.8 56.2 75.5 80.6
MG 187.4 156.3 130.4 -30.4 129.0 107.0 88.8 -31.2
PA 86.1 84.2 82.3 -4.4 64.5 62.8 61.0 -5.4
PR 205.2 179.9 157.8 -23.1 145.9 127.2 111.0 -23.9 PE 92.8 114.0 140.1 51.0 69.3 84.7 103.5 49.3 RJ 298.8 229.3 176.0 -41.1 200.6 153.1 116.9 -41.7 RS 186.1 164.2 144.8 -22.2 126.3 110.8 97.2 -23.0 SC 155.8 139.8 125.4 -19.5 107.6 96.0 85.7 -20.4 SP 201.6 167.4 139.0 -31.1 127.9 105.6 87.2 -31.8 hid
Male female
Age range and states
1980 1989 1998 %v 1980 1989 1998 %v
30-39
AM 6.0 4.3 3.1 -48.4 2.9 2.1 1.5 -49.0
BA 6.8 6.4 6.0 -11.8 3.7 3.4 3.2 -12.8
ES 15.1 12.0 9.5 -36.9 7.1 5.6 4.5 -37.6
GO 8.3 7.9 7.5 -10.4 4.1 3.9 3.6 -11.4
MT 6.8 8.4 10.4 51.7 3.7 4.5 5.5 50.0
MG 16.8 12.7 9.7 -42.2 7.7 5.8 4.4 -42.8
PA 7.0 6.3 5.6 -20.6 3.5 3.1 2.8 -21.4
PR 17.7 14.2 11.3 -36.1 8.4 6.7 5.3 -36.8
PE 8.6 9.6 10.7 25.4 4.3 4.7 5.3 24.0
RJ 38.3 26.8 18.8 -51.1 17.1 11.9 8.3 -51.6
RS 22.2 17.8 14.3 -35.3 10.0 8.0 6.4 -36.0
SC 13.1 10.7 8.8 -33.1 6.0 4.9 4.0 -33.9
SP 27.4 20.7 15.7 -42.7 11.6 8.7 6.5 -43.4
40-49
AM 24.1 19.5 15.8 -34.3 11.0 8.8 7.1 -35.1
BA 21.7 23.0 24.3 12.2 11.1 11.7 12.3 10.9
ES 52.8 47.3 42.4 -19.8 23.5 20.9 18.6 -20.7
GO 28.8 30.8 32.9 13.9 13.3 14.2 15.0 12.7
MT 22.4 31.1 43.2 93.0 11.3 15.6 21.6 90.9
MG 54.3 46.5 39.9 -26.4 23.4 19.9 17.0 -27.2
PA 24.1 24.2 24.3 1.0 11.3 11.3 11.3 -0.1
PR 67.9 61.2 55.2 -18.7 30.2 27.1 24.3 -19.6
PE 30.5 38.5 48.7 59.5 14.3 17.9 22.5 57.8
RJ 130.8 103.2 81.4 -37.8 54.9 43.1 33.8 -38.4
RS 82.9 75.2 68.2 -17.7 35.2 31.7 28.6 -18.6
SC 53.3 49.1 45.3 -14.9 23.0 21.1 19.3 -15.9
SP 95.6 81.6 69.7 -27.1 37.9 32.2 27.3 -27.9
50-59
AM 82.7 68.6 56.9 -31.2 35.8 29.5 24.4 -31.9
BA 58.3 63.2 68.5 17.5 28.4 30.6 33.0 16.3
ES 154.8 142.0 130.2 -15.9 65.4 59.7 54.4 -16.8
GO 82.1 89.7 98.0 19.4 36.0 39.2 42.6 18.1
MT 55.7 79.2 112.7 102.2 26.7 37.8 53.4 100.0 MG 148.1 130.1 114.2 -22.9 60.6 52.9 46.2 -23.8
PA 75.8 78.0 80.3 5.9 33.8 34.5 35.3 4.7
PR 209.3 193.1 178.2 -14.8 88.3 81.1 74.4 -15.8
PE 89.0 115.1 148.8 67.2 39.5 50.8 65.3 65.4
RJ 361.9 292.3 236.1 -34.8 144.3 115.9 93.1 -35.5 RS 246.9 229.2 212.8 -13.8 99.5 91.8 84.8 -14.7 SC 170.2 160.7 151.7 -10.8 69.8 65.5 61.5 -11.8 SP 270.5 236.4 206.5 -23.6 101.9 88.5 76.9 -24.5
AM - Amazonas; BA - Bahia; ES - Espírito Santo; GO - Goiás; MG - Minas Gerais; MT - Mato Grosso; PA - Pará; PR - Paraná; PE - Pernambuco; RJ - Rio de Janeiro; RS - Rio Grande do Sul; SC - Santa Catarina; SP - São Paulo
1. Mansur AP, Favarato D, Souza MFM, et al. Tendência da Mortalidade por Doenças Circulatórias no Brasil de 1979 a 1996. Arq Bras Cardiol 2001; 76: 497-503.
2. Souza MFM, Timerman A, Serrano Jr CV, Santos RD, Mansur AP. Tendências do Risco de Morte por Doenças Circulatórias nas Cinco Regiões do Brasil no Período de 1979 a 1996. Arq Bras Cardiol 2001; 77: 562-8.
3. Mansur AP, Souza MFM, Timerman A. Tendência do risco de morte por doenças circulatórias, cerebrovasculares e isquêmicas do coração em 11 capitais do Brasil de 1980 a 1998. Arq Bras Cardiol 2002; 79: 269-76.
4. Marcopito LF, Shirassu MM. Mortalidade por infarto agudo do miocárdio e pelas demais doenças isquêmicas do coração no Estado de São Paulo, 1980-1996. Arq Bras Cardiol 2000; 75: 69-71.
5. Ministério da Saúde. Fundação Nacional da Saúde. DATASUS. Sistema de informação sobre mortalidade 1979-1997: dados de declaração de óbito. [CD-ROM]. Brasília; 1998.
6. Cláudio DM, Marins JM. Cálculo numérico computacional. São Paulo: Atlas; 1989.
7. Fundação IBGE. Censo demográfico Goiás: VIII Recenseamento Geral-1970. Rio de Janeiro; 1973. (Série Regional, I).
8. Fundação IBGE. Censo demográfico: dados gerais-migração-instrução-fecundidade-mortalidade. Rio de Janeiro; 1982. (Recenseamento geral do Brasil 1980, 9: v.1, t.4).
9. Fundação IBGE. Censo demográfico 1991: resultados do universo relativo às características da população e dos domicílios. Rio de Janeiro; 1994. n.27: Goiás.
10. Fundação IBGE. Contagem da população 1996. Rio de Janeiro; 1997. v.1. (Resultados relativos a sexo da população e situação da unidade domiciliar).
11. Neter J, Kutner MH, Nachtschiem CJ, Wasserman W. Applied Linear Statistical Models. 4th Ed. Chicago: Irwin Series in Statistics; 1996: 217-489, 567-614.
References
hid
Male female
Age range and states
1980 1989 1998 %v 1980 1989 1998 %v
60-69
AM 184.7 156.2 132.1 -28.5 87.2 73.4 61.7 -29.3 BA 116.8 129.1 142.7 22.2 62.1 68.2 75.0 20.8 ES 325.3 304.1 284.3 -12.6 150.0 139.5 129.7 -13.6 GO 184.1 205.2 228.6 24.1 88.3 97.8 108.4 22.8 MT 123.4 179.0 259.5 110.2 64.6 93.2 134.3 107.9 MG 324.7 290.7 260.2 -19.9 144.9 129.0 114.8 -20.7 PA 182.3 191.3 200.6 10.1 88.5 92.4 96.4 8.9 PR 502.5 472.8 444.9 -11.5 231.6 216.7 202.8 -12.4 PE 191.7 252.7 333.2 73.8 92.9 121.7 159.6 71.9 RJ 756.7 623.1 513.1 -32.2 329.4 269.7 220.9 -32.9 RS 580.2 549.2 519.9 -10.4 255.1 240.2 226.1 -11.4 SC 425.0 409.1 393.9 -7.3 190.2 182.1 174.3 -8.3 SP 616.5 549.2 489.3 -20.6 253.5 224.6 199.0 -21.5
70 and +
AM 503.5 408.6 331.5 -34.2 340.5 274.8 221.8 -34.9 BA 276.5 293.2 311.0 12.5 210.5 222.0 234.1 11.3 ES 897.1 804.7 721.8 -19.5 592.7 528.7 471.6 -20.4 GO 464.3 496.3 530.6 14.3 318.8 339.0 360.4 13.0 MT 301.2 419.0 582.9 93.5 225.8 312.4 432.3 91.4 MG 859.4 738.2 634.0 -26.2 549.3 469.2 400.8 -27.0 PA 500.8 504.1 507.5 1.3 348.5 348.8 349.2 0.2 PR 1311.6 1184.1 1069.0 -18.5 865.8 777.3 697.9 -19.4 PE 426.3 539.2 682.1 60.0 295.8 372.1 468.1 58.2 RJ 1888.9 1492.4 1179.2 -37.6 1177.8 925.4 727.2 -38.3 RS 1638.0 1487.7 1351.2 -17.5 1031.8 932.0 841.9 -18.4 SC 1141.6 1054.5 974.1 -14.7 731.8 672.3 617.6 -15.6 SP 1693.8 1447.9 1237.7 -26.9 997.7 848.1 721.0 -27.7
Cvd
Male female
Age range and states
1980 1989 1998 %v 1980 1989 1998 %v
60-69
AM 222.6 178.9 143.8 -35.4 177.0 141.5 113.1 -36.1 BA 152.9 160.6 168.7 10.3 136.8 142.9 149.3 9.1 ES 410.9 365.0 324.3 -21.1 319.2 282.0 249.1 -22.0 GO 237.8 251.7 266.5 12.1 192.0 202.1 212.8 10.9 MT 110.3 151.9 209.3 89.8 97.2 133.2 182.5 87.7 MG 394.7 335.7 285.6 -27.6 296.6 250.9 212.3 -28.4 PA 198.9 198.3 197.7 -0.6 162.7 161.3 159.9 -1.7 PR 473.5 423.3 378.5 -20.1 367.4 326.7 290.5 -20.9 PE 192.1 240.6 301.4 56.9 156.7 195.2 243.2 55.2 RJ 600.3 469.7 367.5 -38.8 440.0 342.4 266.5 -39.4 RS 420.2 378.0 340.0 -19.1 311.2 278.4 249.0 -20.0 SC 373.9 342.0 312.9 -16.3 281.8 256.3 233.2 -17.2 SP 441.6 373.8 316.5 -28.3 305.8 257.4 216.7 -29.1
70 and +
AM 735.8 567.4 437.5 -40.5 838.0 642.6 492.8 -41.2 BA 438.8 442.2 445.7 1.6 562.6 563.8 565.1 0.5 ES 1374.5 1171.5 998.6 -27.4 1529.1 1296.2 1098.7 -28.1 GO 726.9 738.4 750.1 3.2 840.7 849.3 858.0 2.1 MT 326.2 431.3 570.1 74.8 412.0 541.6 712.0 72.8 MG 1266.7 1033.9 843.9 -33.4 1363.6 1106.9 898.4 -34.1 PA 662.6 633.8 606.3 -8.5 776.5 738.6 702.6 -9.5 PR 1498.5 1285.5 1102.8 -26.4 1665.9 1421.3 1212.6 -27.2 PE 517.9 622.5 748.3 44.5 605.2 723.4 864.7 42.9 RJ 1817.1 1364.3 1024.3 -43.6 1908.1 1424.7 1063.7 -44.3 RS 1438.7 1241.7 1071.7 -25.5 1526.3 1310.0 1124.4 -26.3 SC 1217.8 1068.9 938.2 -23.0 1314.7 1147.6 1001.8 -23.8 SP 1471.2 1195.0 970.7 -34.0 1459.3 1178.9 952.3 -34.7
AM - Amazonas; BA - Bahia; ES - Espírito Santo; GO - Goiás; MG - Minas Gerais; MT - Mato Grosso; PA - Pará; PR - Paraná; PE - Pernambuco; RJ - Rio de Janeiro; RS - Rio Grande do Sul; SC - Santa Catarina; SP - São Paulo
other multivariable methods. 2nd Ed. Belmont, California: Duxbury Press; 1988: 41-80.
13. Sharovsky R, César LAM. Increase in mortality due to myocardial infarction in the Brazilian city of Sao Paulo during winter. Arq Bras Cardiol 2002; 78: 106-9.
14. Barros FC, Victora CG. Increased blood pressure in adolescents who were small for gestational age at birth: a cohort study in Brazil. Int J Epidemiol 1999; 28: 676-81.
15. Sichieri R, Siqueira KS, Pereira RA, Ascherio A. Short stature and hypertension in the city of Rio de Janeiro, Brazil. Public Health Nutr 2000; 3: 77-82.
16. Dressler WW, Balieiro MC, Santos JE. Culture, skin color, and arterial blood pressure in Brazil. Am J Hum Biol 1999; 11: 49-59.
17. Lima CT, Carvalho FM, Quadros C de A, Goncalves HR, Silva Junior JA, Peres MF, et al. Arterial hypertension and alcoholism among workers in an oil
18. Iribarren C, Luepker RV, McGovern PG, Arnett DK, Blackburn H. Twelve-year trends in cardiovascular disease risk factors in the Minnesota Heart Survey. Are socioeconomic differences widening? Arch Intern Med 1997; 157: 873-81.
19. Osler M, Gerdes LU, Davidsen M, Bronnum-Hansen H, Madsen M, Jorgensen T, et al. Socioeconomic status and trends in risk factors for cardiovascular diseases in the Danish MONICA population, 1982-1992. J Epidemiol Community Health 2000; 54: 108-13.
20. Hoeymans N, Smit HA, Verkleij H, Kromhout D. Cardiovascular risk factors in relation to educational level in 36,000 men and women in The Netherlands. Eur Heart J 1996; 17: 518-25.