Effects of Metformin on QT and QTc Interval Dispersion of Diabetic Rats
Eunice Cristina da Silva Costa, Antonio Ari Gonçalves, Miguel Arcanjo Areas, Rafael Gustavo Birochi Morgabel
Universidade Estadual de Campinas (Unicamp), Campinas, SP - BrazilMailing address: Eunice Cristina da Silva Costa •
Rua Izabel Negrão Bertotti, 30/102-B - Mansões Santo Antônio - 13087-508 - Campinas, SP - Brazil
E-mail: [email protected]
Manuscript received August 13, 2007; revised manuscript received October 31, 2007; accepted November 19, 2007.
Summary
Background: Several drugs can cause prolonged QT interval, as well as prolonged QT dispersion (QTd) in electrocardiographic (EKG) recordings. QTd may be a potentially sensitive marker of increased risk of cardiac arrhythmias and sudden cardiac death. Metformin is an effective antihyperglycemic agent used in the treatment of diabetes. However, studies have correlated dose-dependent effects of metformin on glycemia and cardiovascular risk markers.
Objective: To evaluate the dose-response effects of metformin on QT and QTd of diabetic rats.
Methods: Male Wistar rats were distributed in five groups: non-treated control (C), non-treated diabetics (D), diabetics treated with metmorfin at the doses of 3.5, 30 and 74 µg/kg/bw (DM 3.5, DM 30 and DM 74). Diabetes was induced by an alloxan injection (40 mg/kg, IV). EKG was recorded (days 1, 15 and 30) using four electrodes inserted into the subcutaneous layer of the paws. Both RR and QT intervals were measured, and then corrected QT and QT dispersion values were calculated.
Results: The DM 3.5 and DM 30 groups showed a significant reduction of glycemia (p< 0.05) when compared with the high dose (DM 74). Rats of the DM 74 group presented prolonged QTc, QTd and QTcd intervals, whereas rats of the DM 3.5 and DM 30 groups presented less prolonged intervals.
Conclusion: Metformin at high doses provided greater dispersion of the QT interval probably because of the increased ventricular repolarization inhomogeneity, whereas at low doses decreased QT intervals were observed in diabetic rats. (Arq Bras Cardiol 2008; 90(4): 232-238)
Key words: Diabetes mellitus, experimental; electrocardiography; metformin.
LQTS may be congenital – when abnormalities in sodium or potassium channels occur, or acquired – resulting from the use of medications, electrical abnormalities or metabolic disorders. The QT interval corresponds to the time necessary for the complete ventricular electrical excitation and recovery and is, therefore, the measurement of the duration of the “electrical” systole, which includes ventricular depolarization and repolarization, that is, the total duration of the ventricular electrical activity6. The QT interval varies inversely with heart
rate (HR), so that the higher the HR, the shorter the QT and vice versa. Accordingly, it should be corrected for HR, thus generating the QTc, which is preferably used7. Other parameters
to be assessed are QT dispersion and QTc dispersion (QTd and QTcd, respectively). This dispersion would result from inhomogeneity of repolarization times, and is defined as the difference between the maximum and minimum QT in the twelve electrocardiographic leads8. QT dispersion is a marker
of arrhythmogenesis, and its analysis is a noninvasive method for the detection of ventricular repolarization heterogeneity9.
Additionally, some studies associate increased QTd intervals with a higher risk of sudden death10,11 and as a prognostic
index in heart failure and hypertrophic cardiomyopathy8,12.
In diabetic individuals, increased QT interval is considered a precursor of increased risk of sudden death13.
Depending on their dosages, certain medications may prolong the duration of the ventricular action potential and
Introduction
Diabetes is a metabolic disorder characterized by increased blood glucose resulting from alterations in protein, lipid and carbohydrate metabolism due to impaired secretion of or peripheral resistance to insulin. These alterations increase the tendency to the development of cardiovascular diseases and neuropathies, which represent one of themajor causes of death of patients1,2. Alterations in carbohydrate and lipid
metabolism as well as electrolytic changes in blood calcium and potassium may cause modifications in the cardiovascular structure and physiology which, in turn, lead to alterations in electrocardiographic recording3,4.
Electrocardiogram (ECG) is one of the most important methods in the diagnosis of heart diseases5. Depending on
the extent and areas damaged, the propagation of action potentials in the heart muscle changes ECG waves and their respective intervals.
the QT interval by means of different ionic mechanisms. The biguanide metformin is an antihyperglicemic agent used to reduce blood glucose and consequently to improve the metabolic profile. It reduces blood glucose levels by inhibiting gluconeogenesis and in the presence of insulin it stimulates peripheral glucose uptake by the tissues – mainly skeletal muscles - and decreases absorption of glucose from the gastrointestinal tract. Its direct effect on b cells is still debatable. Metformindoes not cause hypoglycemia, but rather reduces glycosylated hemoglobin levels and improves the lipid profile and fibrinolytic activity14,15.
Despite the beneficial effects of metformin, studies have demonstrated that its use at high doses does not decrease hyperglycemia and increases the cardiovascular risks16-20.
Gastrointestinal disorders such as diarrhea are common, and the intestinal absorption of group B vitamins, especially folate, is impaired during chronic therapy. Frequently, this deficiency increases plasma homocysteine levels, which accelerate the progression of vascular disease due to adverse effects on blood vessels, clotting factors, and endothelium. One study found an association between high homocysteine levels and the overall mortality in patients with atherogenic disease15.
In some circumstances, metformin may lead to lactic acidosis, especially in patients with clinical conditions that predisposed to this complication, such as heart failure or myocardial infarction15.
Additionally, preliminary results (unpublished) showed that high metformin doses such as those recommended for human patients promoted a great increase in cardiac glycogen in alloxanized rats, whereas at low doses this increase was milder. In diabetic patients, the increased glycogen concentration in the ventricles is apparently associated with theseverity of diabetes, and makes the heart more susceptible to the effects of ischemia21,22, in addition to leading to cardiac malfunctioning,
since its accumulation in the conductive tissue is the cause of sinus and atrioventricular node dysfunction23.
Based on these findings, we investigated the effects of low and high metformin doses on blood glucose and on the QT interval, as well as on QTc, QTd, and QTcd of alloxan diabetic rats.
Methods
Animals
Male albino Wistar rats aged 10 weeks were supplied by Unicamp’s vivarium to be used in this study. They were kept in the vivarium of the Department of Physiology and Biophysics for adaptation for two weeks. The rats were fed on feed (Purina rodent) and had ad libitum access to water in a photoperiodic cycle of 12 h light and 12 h dark, at 22 ± 2o C. The experimental protocol was approved by the Ethics
Committee on Animal Experimentation of Unicamp under number 262-1.
Induction of diabetes
Before induction of diabetes, the rats were fasted for 24 hours with free access to water. After being anesthetized with sodium pentobarbital (40 mg/kg of body weight), the rats were injected with alloxan in saline (40 mg/kg/bw, IV, pH 4.5,
Sigma™)24,25. Established diabetes was verified by the presence
of glucose in urine the next day.
Treatment with metformin and groups
After induction of diabetes, the treatment was started. The rats in the groups treated received metformin (Lipha, Lyon, France) diluted in drinking water (3.5, 30 and 74 µg/g/bw) for 30 days, thus comprising the following groups: control (C; n = 5); diabetes (D; n = 6); diabetes metformin [3,5 µg/g/bw] (DM3.5; n = 8); diabetes metformin [30 µg/g/bw] (DM30; n = 7); and diabetes metformin [74 µg/g/bw] (DM74; n = 8).
Electrocardiogram
Anesthetized rats (sodium pentobarbital, 40 mg/kg/bw) were kept in the supine position with spontaneous breathing for ECG recording. The electrodes were connected to the computer channels (Heart Ware System), and six standard waves were recorded (I, II, III, aVR, aVR and aVF) with a 2N sensitivity at a 50-mm/second speed. The QT interval was measured in three consecutive beats from the beginning of the QRS-complex to the point of return of the T wave to the isoelectric line, defined as the TP segment26. QTd was
calculated in absolute values, by subtracting the shortest QT interval from the longest (QT = QT max – Qt min). This value was converted into a percentage (%QTd) by correcting the QTd for the shortest QT interval and multiplying this value by 100 (%QTd = Qt max – QT min/QT min x 100). The QT interval was corrected for the heart rate using Bazett’s
formula (QTc = QT/√R-R) and the QTc interval dispersion
was further calculated by subtracting the minimum QTc interval from the maximum QTc interval (QTcd = QTcmax - QTcmin). The percentage QTcd was also calculated (%QTcd = Qtcmax - QTcmin/ Qtcmin x 100). The analyses were made by a single observer blinded to the treatment the animals received, so as to minimize divergences in the dispersion measurement.
Determination of plasma glucose, Na+, K+ and Ca2+
Plasma glucose was determined with the glucose oxidase method, using a commercial kit (Laborlab, Sao Paulo, Brazil). Na+ and K+ were determined using the selective ion electrode
method (Roche™). Totalserum calcium was measured using the colorimetric method with cresolftaleine (o-cresolftaleine complexone – Roche™)27, with an automated analyzer
(Hitachi™).
Statistics
The results were expressed as mean ± MSD. Data were evaluated using the analysis of variance for two factors, followed by Tukey’s test. Significant values were considered those whose differences were lower than 5%.
Results
Effects of metformin on blood glucose
At the end of the experiment, similar levels were observed in rats of the control group.
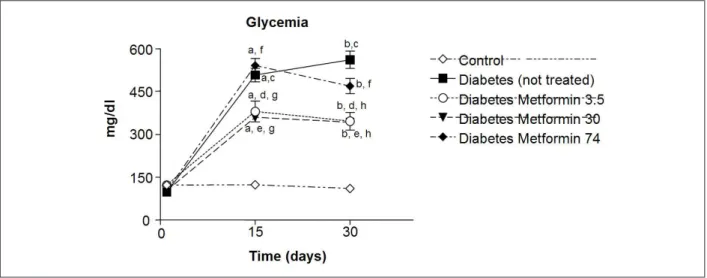
Administration of alloxan induced severe hyperglycemia on day 15, which was maintained until day 30 in the rats of group D (563 ± 61 mg/dl, p < 0.001; compared with blood glucose prior to alloxan administration). Rats that received daily metformin doses of 3.5 (DME.5) and 30 (DM30) mg/kg showed lower blood glucose levels on days 15 and 30 (381± 37 and 360 ± 14, respectively) of treatment when compared with rats of the control diabetic group. The administration of metfomin at 74 mg/kg marginally reduced blood glucose after day 30 in comparison with control diabetic rats (p >0.05) (Fig.1).
Effects of metformin on ECG
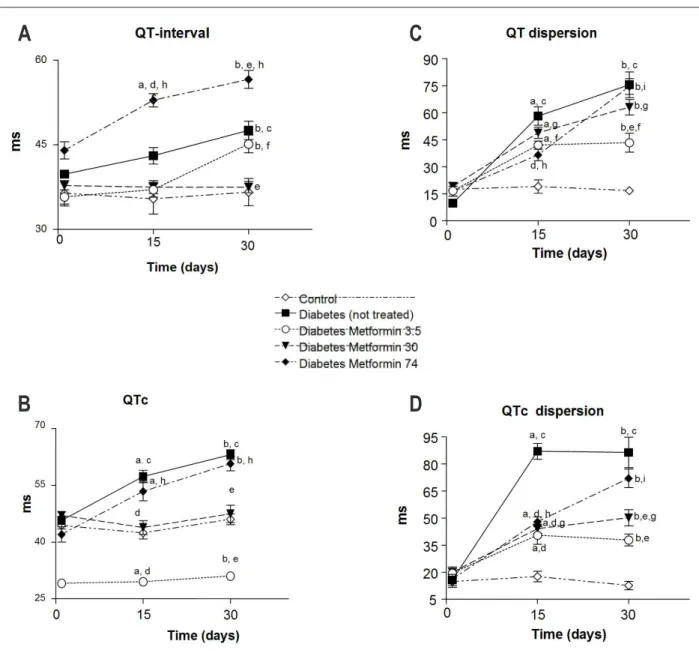
Figure 2 (A, B, C and D) shows that the QT (2A) and QTc (B) intervals, as well as QTd (2C) and QTcd (2D), were similar at the beginning of the experimental period. In diabetic rats, these intervals increased after 15 days of the administration of alloxan and remained similar 30 days later. On days 15 and 30, the QT interval of diabetic rats treated with 3.5 and 30 mg/kg was similar to that observed in the non-diabetic control group, but was significantly longer in rats treated with metmorfin at 74 mg/kg. The QTc interval of rats treated with lower metmorfin doses (3.5 and 30 mg/kg) was longer than that observed in rats of the control group (non-diabetic) 15 and 30 days after the administration of alloxan. However, it was significantly shorter than the values observed in diabetics (non-treated) and diabetics treated with metformin at high doses (74 mg/kg). Only metformin at lower doses (3.5 and 30 mg/kg) decreased QT and QTc dispersion whencompared with the group of non-treated diabetics. However, these differences were more evident after 30 days of treatment.
Figure 1 -Changes in glycemia (mg/dl) of rats after alloxan induction and after 15 and 30 days of treatment with metformin at low (3.5 µg/g/bw), medium (30 µg/g/bw)
and high doses (74 µg/g/bw). Data are expressed as mean ± MSD. a - signiicantly different from the control group on day 15 of the experimental period (p<0.05); b - signiicantly different from the control group on day 30 of the experimental period (p<0.05); c - signiicantly different from the diabetes group (not treated) on day 1 of the experimental period (p<0.05); d - signiicantly different from the diabetes metformin 3.5 group on day 1 of the experimental period (p<0.05); e - signiicantly different from the diabetes metformin 30 group on day 1 of the experimental period (p<0.05); f - signiicantly different from the diabetes metformin 74 group on day 1 of the experimental period (p<0.05); g - signiicantly different from the diabetes group (not treated) on day 15 of the experimental period (p<0.05); h - signiicantly different from the diabetes group (not treated) on day 30 of the experimental period (p<0.05).
Effects of metmorin treatment on serum ion concentration
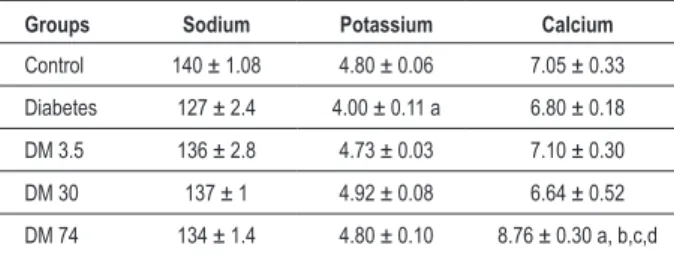
Table 1 shows a decrease in serum K+ concentration of
diabetic rats (non-treated) in comparison with the control group (non-diabetic).
It also shows an increase in Ca2+ concentration only in the
group treated with metformin at high doses. No alterations were observed in the other parameters.
Discussion
Type-2 diabetes is characterized by alterations in glucose and lipid metabolism, partly due to resistance to insulin action in peripheral tissues. If untreated, it may lead to several complications such as increased cardiovascular risk1,2.
The biguanide metformin is an antihyperglycemic agent used in the treatment of type-2 diabetics. However, the action mechanism of metformin is still unclear.
Studies have shown that metformin activates AMP activated protein kinase(AMPK) in liver cells and skeletal muscle of rats28. Recent studies indicate that AMPK plays a role in
the regulation of glucose and lipid metabolism. AMPK is an enzyme that promotes energy availability and is activated by skeletal muscle contraction and during myocardial ischemia; it is involved in the stimulation of glucose transport and fatty acid oxidation.
In the liver, AMPK activation results in increased fatty acid oxidation and decreased production of glucose, cholesterol and triglyceride29. This effect contributes to
Figure 2 A, B, C, D -Changes in QT, QTc, QTd, QTcd intervals (ms) in rats after alloxan induction and after 15 and 30 days of treatment with metformin at low (3.5
µg/g/bw), medium (30 µg/g/bw) and high doses (74 µg/g/bw). Data are expressed as mean ± MSD. a - signiicantly different from the control group on day 15 of the experimental period (p<0.05); b - signiicantly different from the control group on day 30 of the experimental period (p<0.05); c - signiicantly different from the diabetes group (not treated) on day 1 of the experimental period (p<0.05); d - signiicantly different from the diabetes group (not treated) on day 1 of the experimental period (p<0.05); e - signiicantly different from the diabetes group (not treated) on day 30 of the experimental period (p<0.05); f - signiicantly different from the diabetes metformin 3.5 group on day 1 of the experimental period (p<0.05); g - signiicantly different from the diabetes metformin 30 group on day 1 of the experimental period (p<0.05); h - signiicantly different from the diabetes metformin 74 group on day 30 of the experimental period (p<0.05); i - signiicantly different from the diabetes metformin 74 group on day 15 of the experimental period (p<0.05).
A
B
C
D
However, other studies demonstrated that high-dose metformin did not reduce hyperglycemia in diabetic animals, but could increase the cardiovascular risks16-20.
Our results (Figure 1) show that metformin at a high dose equivalent to that recommended for diabetic patients (74µg/g/bw) did not reduce blood glucose in diabetic rats, whereas at low (3.5 µg/g/bw) and medium doses (30 µg/g/ bw), it significantly reduced blood glucose in comparison with untreated diabetic rats. However, the blood glucose reduction induced by low doses of metformin was not enough
to normalize blood glucose levels.
The inefficacy of high doses of metformin in reducing blood glucose may have been caused by decreased b-cell responsiveness to glucose. An in vitro study with b cells showed that metformin at high doses (1 mM) and prolonged exposure (24 hours) activated AMPK and thus partially inhibited the synthesis and release of insulin in b cells, which caused the reduction of their glucose responsiveness32.
Table 1 - Effects of the treatment with metformin at low doses (3.5 µg/g/bw), at medium doses (30 µg/g/bw) and at high doses (74 µg/g/bw) on serum potassium (mEq/l), sodium (mEq/l) and calcium (mg/dl) concentrations. Data are expressed as mean ± MSD
Groups Sodium Potassium Calcium
Control 140 ± 1.08 4.80 ± 0.06 7.05 ± 0.33
Diabetes 127 ± 2.4 4.00 ± 0.11 a 6.80 ± 0.18
DM 3.5 136 ± 2.8 4.73 ± 0.03 7.10 ± 0.30
DM 30 137 ± 1 4.92 ± 0.08 6.64 ± 0.52
DM 74 134 ± 1.4 4.80 ± 0.10 8.76 ± 0.30 a, b,c,d
a - signiicantly different from the control group (n = 4) on day 30 of the experimental period (p< 0.05); b - signiicantly different from the diabetes group (non-treated) (n = 4) on day 30 of the experimental period (p< 0.05); c - signiicantly different from the diabetes metformin 3.5 group (n = 5) on day 30 of the experimental period (p< 0.05); d - signiicantly different from the diabetes metformin 30 group (n = 5) on day 30 of the experimental period (p< 0.05).
portion of the b subunity of its receptor. However, high doses of metformin inhibited tyrosine kinase activity and, consequently, insulin action33.
Diabetes, per se, causes changes in MAP kinase and in glucose transporters. The enhancement of K+ currents in
ventricular cells depends on the activation of MAP kinase, which reflects the synthesis of new channels. The decrease of insulin in diabetics probably leads to a reduction in K+
currents in the epicardium, thus causing increased duration of the cardiac action potential34.
The alterations promoted in carbohydrate and lipid metabolism and in electrolyte concentrations may cause changes in the cardiovascular physiology and structure, which can be recorded in the electrocardiogram. One of the most common problems detected in diabetics is prolongation of the QT interval, as well as of QTc, QTd and QTcd. This is due to a late depolarization and/or repolarization of the cardiac action potential, thus leading to an increased risk of arrhythmias and sudden death35.
Although the QT interval is used as a noninvasive method to identify the risk of developing malignant ventricular arrhythmias and sudden death, flaws are actually expected in the system proposed. When the equation QT max – QT min is used, a 12-lead ECG with a well-defined T-wave in each lead should ideally be obtained36. This was a limitation in our study
because only six leads can be recorded in rats according to the methodology used by other authors37. Additionally, in several
situations it was impossible to detect the end of the T-wave. In this circumstance, the methodology indicates that excluding this interval from the analysis is the most proper thing to do36,
as we did in our results. However, despite these limitations, some measures were taken to minimize the discrepancies in the dispersion measurement. The same electrode was used in all electrocardiographic recordings; the site where it was placed was also standardized. TheECG was always performed in the morning so as to lessen the possible effects of the circadian rhythm. Additionally, one single observer analyzed the QT interval in three consecutive beats, in order to decrease counting errors26. After determination of the values,
no statistically significant difference was found between the results calculated.
Thus, despite the limitations of the study, the QTc, QTd and QTcd intervals increased in alloxan diabetic rats, as shown in Figure 2 (B, C and D).
The causes of the increased intervals are unknown. However, this alteration observed in the electrocardiogram may be explained in function of polyuria, which is the most common clinical manifestation of diabetes mellitus38. Polyuria
observed in diabetic patients is traditionally attributed to the osmotic diuresis secondary to increased blood glucose (glicosuria)37. The excessive urinary loss causes a reduction
of potassium39 which can be responsible for the increased
membrane repolarization period40, with a consequent increase
in the QT interval. The reduction in serum K concentration observed in rats of the diabetes group is shown in Table 1.
The increased QT interval dispersion may also result from alterations in voltage-gated K+ channels41. In fact, diabetes
may change the magnitudeof K+ channels involved in the
cardiomyocyte membrane repolarization process34, thus
affecting the cardiac tissue.
Treatment of diabetic rats with high doses of metformin (74 µg/g) caused an increase in QT, QTd, QTc, and QTcd on days 15 and 30 of the experimental period (Figure 2 A-D).
This increase may result from the hypercalcemia observed in this group (Table 1), since increased calcium concentrations reduce the ventricular conduction velocity and shorten the effective refractory period, and thus may cause arrhythmias42.
However, factors that were not evaluated in this study may also have contributed to the increased QT interval. Persistent AMPK activity, as occurs during treatment with metformin at high doses, may promote mutations in PRKAG2, the gene for γ2 regulatory subunity of AMP-activated protein kinase. This mutation may increase glucose uptake by stimulating translocation of the glucose transporter GLUT-4 to the plasma membrane and increase hexokinase activity, thus leading to glycogen accumulation, which may cause sinus node and atrioventricular node dysfunction22,24.
Additionally, AMPK activation also promotes a dose-dependent increase in glycolysis and fatty acid oxidation in cardiomyocytes. Increased fatty acid oxidation inhibits glucose oxidation, and the acetyl-coA producedmay inhibit the pyruvate-dehydrogenase complex, thus limiting pyruvate oxidation. These events lead to increased glycolysis and, in this situation, the protons and lactate produced accumulate and provoke a decrease in pH, intracellular calcium overload and subsequent cell death, thus reducing the cardiac functional capacity16.
However, metformin at low and medium doses decreased the QT, QTc, QTd, and QTcd intervals, thus suggesting improved ventricular electric conduction. Additionally, serum electrolytes (calcium, potassium and sodium), which are other factors that may affect the electric conductivity, did not change in these groups.
References
1. Paulson D. The diabetic heart is more sensitive to ischemic injury. Cardiovasc Res. 1997; 34: 104-12.
2. Balkau B, Hu G, Qiao Q, Tuomilehto J, Borch-Johnsen K, Pyorala K. Prediction of the risk of cardiovascular mortality using a score that includes glucose as a risk factor. Diabetologia. 2004; 47 (12): 2118-28.
3. Tomaselli GF, Beuckelmann DJ, Calkins HG, Berger RD, Kessler PD, Lawrence JH, et al. Sudden cardiac death in heart failure: the role of abnormal repolarization. Circulation. 1994; 90: 2534-9.
4. Pye MP, Cobbe SM. Mechanism of ventricular arrhythmias in cardiac failure and hypertrophy. Cardiovasc Res. 1992; 26: 740-50.
5. Sgarbossa EB, Barold SS, Pinski SL, Wagner GS, Pahlm O. Twelve-lead electrocardiogram: the advantages of an olderly frontal lead display including lead-AVR. J Electrocardiol. 2004; 37 (3): 141-7.
6. Rocha e Silva M. As bases fisiológicas da eletrocardiografia. In: Aires MM. Fisiologia. Rio de Janeiro: Guanabara Koogan; 1999.
7. Arildsen H, May O, Christiansen EH, Damsgaard EM. Increased QT dispersion in patients with insulin-dependent diabetes mellitus. Int J Cardiol. 1999; 71: 235-42.
8. Day CP, McComb JM, Campbell RW. QT dispersion: an indication of arrythmia risk in patients with long QT intervals. Br Heart J. 1990; 63: 342-4.
9. Shimoni Y, Severson D, Giles W. Thyroid status and diabetes modulate regional differences in potassium currents in rat ventricle. J Physiol. 1995; 488 (Pt 3): 673-88.
10. Sawicki PT, Kiwitt S, Bender R, Berger M. The value of QT interval dispersion for identification of total mortality risk in non-insulin dependent diabetes mellitus. J Intern Med. 1998; 243: 49-56.
11. Christensen PK, Gall MA, Major-Pedersen A, Sato A, Rossing P, Breum L, et al. QTc interval length and QT dispersion as predictors of mortality in patients with non-insulin-dependent diabetes. Scand J Clin Lab Invest. 2000; 60: 323-32.
12. Dristas A, Gilligan D, Nihoyannopoulus P, Oakley CM. Amiodarone reduces QT dispersion in patients with hypertrophic cardiomyopathy. Int J Cardiol. 1992; 36: 345-9.
13. Brown DW, Giles WH, Greenlund KJ, Valdez R, Croft JB. Impaired fasting glucose, diabetes mellitus and cardiovascular disease risk factors are associated with prolonged QTc duration: results from the Third National Health and Nutrition Examination Survey. J Cardiovasc Risk. 2001; 8: 227-33.
14. Bailey CJ. Insulin resistance and antidiabetic drugs. Biochem Pharmacol.
1999; 58: 1511-20.
15. Fisman EZ, Tenenbaum A, Motro M, Adler Y. Oral antidiabetic therapy in patients with heart disease. Herz. 2004; 29: 290-8.
16. An D, Kewalramani G, Chan JK, Qi D, Ghosh S, Pulinilkunnil T, et al. Metformin influences cardiomyocyte cell death by pathways that are dependent and independent of caspase-3. Diabetologia. 2006; 49 (9): 2174-84.
17. Fisman EZ, Tenenbaum A, Benderly M, Goldbourt U, Behar S, Motro M. Antihyperglycemic treatment in diabetics with coronary disease: increased metformin-associated mortality over a 5-year follow-up. Cardiology. 1999; 91 (3): 195-202.
18. Grant PJ. The effects of high- and medium-dose metformin therapy on cardiovascular risk factors in patients with type II diabetes. Diabetes Care. 1996; 19 (1): 64-6.
19. Yajima K, Shimada A, Hirose H, Kasuga A, Saruta T. “Low dose” metformin improves hyperglycemia better than acarbose in type 2 diabetics. Rev Diabet Stud. 2004; 1 (2): 89-94.
20. Bailey CJ, Bagdonas A, Rubes J, McMorn SO, Donaldson J, Biswas N, et al. Rosiglitazone/metformin fixed-dose combination compared with uptitrated metformin alone in type 2 diabetes mellitus: a 24-week, multicenter, randomized, double-blind, parallel-group study. Clin Ther. 2005; 27 (10): 1548-61.
21. Higuchi M, Miyagi K, Nakasone J, Sakanashi M. Role of high glycogen in underperfused diabetic rat hearts with added norepinephrine. J Cardiol Pharm. 1995; 26: 899-907.
22. Donthi RV, Ye G, Wu C, McClain DA, Lange AJ, Epstein PN. Cardiac expression of kinase-deficient 6-phosphofructo-2-kinase/fructose-2,6-bisphosphatase inhibits glycolysis, promotes hypertrophy, impairs myocyte function, and reduces insulin sensitivity. J Biol Chem. 2004; 279 (46): 48085-90.
23. Arad M, Benson DW, Perez-Atayde AR, McKenna WJ, Sparks EA, Kanter RJ, et al. Constitutively active AMP kinase mutations cause glycogen storage disease mimicking hypertrophic cardiomyopathy. J Clin Invest. 2002; 109 (3): 357-62.
24. Steiner DF, Rauda V, Williams RH. Severe ketoacidosis in the alloxan diabetic rats. Endocrinology. 1961; 68: 809-15.
25. Scherer J. Action of alloxan on the pancreas of the guinea pig. Acta Anat (Basel). 1955; 23: 350-79.
26. Oliveira MA, Costa LS, Martins VS, Tress JC, Aldrighi JM, Wajngarten M, et al. Efeito da terapia de reposição hormonal e do raloxifeno a curto prazo sobre
dispersion is actually a more accurate and safe measurement than the measurement of QTc alone as a marker of cardiovascular risk, or whether it is merely one more accurate measure to be added to the clinical armamentarium of assessment of the cardiovascular risk. Regardless of this discussion, we conclude that since QTc dispersion measurement is simple and relatively inexpensive, it is important in order to study the influence of drugs on cardiovascular parameters. Because of the limitations of the methodology used in this study, the results and comments presented are based only on data obtained under our experimental conditions, so as not to incur the risk of improper extrapolations.
Conclusion
A significant increase in QT interval dispersion was observed with high metformin doses. Low and medium metformin doses decreased QT interval dispersion.
Acknowledgment
We would like to thank CNPq for their assistance and Lipha Group, Lyon, France, for supplying metformin.
Potential Conflict of Interest
No potential conflict of interest relevant to this article was reported.
Sources of Funding
This study was funded by CNPQ.
Study Association
This article is part of the thesis of doctoral submitted by Eunice Cristina da Silva Costa, from Universidade Estadual
o intervalo QTc e dispersão de QTc em mulheres idosas com hipertensão arterial sistêmica. Rev SOCERJ. 2005; 18 (1): 77-81.
27. Sarkar BC, Chauhan UPS. A new method for determining micro quantities of calcium in biological materials. Anal Biochem. 1967; 20: 155-66.
28. Misra P, Chakrabarti R. The role of AMP kinase in diabetes. Indian J Med Res. 2007; 125 (3): 389-98.
29. Zou MH, Kirkpatrick SS, Davis BJ, Nelson WG, Schlattner U, Neumann D, et al. Activation of the AMP-activated protein kinase by the anti-diabetic drug metformin in vivo. J Biol Chem. 2004; 279 (42): 43940-51.
30. Gonçalves AA, da Silva EC, Brito IJL, da Silva CA, Wiernsperger N. Metformin interacts with training to lower glycemia and to increase glycogen stores in diabetic rats. Diabetologia. 1999; 42 (Suppl): 52A.
31. Lecrere I, Woltersdorf WW, da Silva Xavier G, Rowe RL, Cross SE, Korbutt GS, et al. Metformin, but not leptin, regulates AMP-activated protein kinase in pancreatic islets: impact on glucose-stimulated insulin secretion. Am J Physiol Endocrinol Metab. 2004; 286: E1023-E1031.
32. Kefas BA, Cai Y, Kerckhofs K, Ling Z, Martens G, Heimberg H, et al. Metformin-induced stimulation of AMP-activate protein kinase in b-cells impairs their glucose responsiveness and can lead to apoptosis. Biochem Pharmacol. 2004; 68 (3): 409-16.
33. Stith BJ, Woronoff K, Wiernsperger N. Stimulation of the intracellular portion of the human insulin receptor by the antidiabetic drug metformin. Biochem Pharmacol. 1998; 55 (4): 533-6.
34. Shimoni Y, Severson D, Ewart HS. Insulin resistance and the modulation of rat cardiac K(+) currents. Am J Physiol Heart Circ Physiol. 2000; 279 (2):
H639-49.
35. Feuvray D, Lopaschuk GD. Controversies on the sensitivity of the diabetic heart to ischemic injury: the sensitivity of the diabetic heart to ischemic injury is decreased. Cardiovasc Res. 1997; 34: 113-20.
36. Sá R, Perez C. Dispersão do QT: seu significado clínico. Rev SOCERJ. 2004; 17 (3): 183-91.
37. Howarth FC, Jacobson M, Shafiullah M, Adeghate E. Long-term effects of streptozotocin-induced diabetes on the electrocardiogram, physical activity and body temperature in rats. Exp Physiol. 2005; 90 (6): 827-35.
38. Brodsky WA, Rapoport S, West CD. The mechanism of glycosuric diuresis in diabetic man. J Clin Invest.1950; 29: 1021-32.
39. Kitabchi AE, Wall BM. Diabetic ketoacidosis. Med Clin North Am. 1995; 79: 9-37.
40. Punske BB, Rossi S, Ershler P, Rasmussen I, Abel ED. Optical mapping of propagation changes induced by elevated extracellular potassium ion concentration in genetically altered mouse hearts. J Electrocardiol. 2004; 37 (Suppl): 128-34.
41. Nishiyama A, Ishii DN, Backx PH, Pulford BE, Birks BR, Tamkun MM. Altered K+ channel gene expression in diabetic rat ventricle: isoform switching
between Kv4.2 and Kv1.4. Am J Physiol Heart Circ Physiol. 2001; 281: H1800–H1807.