1Environmental Oceanography Postgraduate Program,Universidade Federal do Espírito Santo – UFES, Vitória (ES), Brazil. E‑mails: [email protected]/
[email protected], [email protected], [email protected], [email protected], [email protected] *Corresponding author.
Manuscript ID: 30274. Received: 03/31/2015. Approved: 10/13/2015. ABSTRACT: In areas of the continental shelf where sediment supply is greater than the sediment dispersion capacity, an exten‑ sive terrigenous deposits and consequently submerged deltas can be formed. he Eastern Brazilian shelf is characterized by the oc‑ currence of river‑feed deltas in between starving coasts. Herein, modern sedimentary processes acting along the Doce river adja‑ cent continental shelf are investigated. he main objective was to understand the shelf sediment distribution, recognizing distinct sedimentary patterns and the major inluence of river sediment discharge in the formation of shelf deposits. he study used 98 suricial samples that were analyzed for grain size, composition and bulk density. Results revealed 3 distinct sectors: south – dominated by mud fraction with a recent deposition from riverine input until 30 m deep and from this depth bioclastic sands dominate; central‑ ‑north – sand‑mud dominated, been recognized as a bypass zone of resuspended sediment during high energy events; and north – re‑ lict sands with high carbonate content. he modern sedimentation processes along the Doce river continental shelf is dominated by distinct sedimentary regimes, showing a strong luvial inluence associated with wave/wind‑induced sediment dispersion and a carbonate regime along the outer shelf. hese regimes seem to be controlled by the distance from the river mouth and bathymetric gradients.
KEYWORDS: Coastal delta; Sediment dynamics; Doce river; Continental shelf.
RESUMO: Deltas submersos e extensos depósitos sedimentares terrígenos podem ser formados em áreas da plataforma continental, onde o suprimento sedimentar é maior do que a sua dispersão. A plataforma leste brasileira é car‑ acterizada pela presença desses deltas entre áreas de baixo aporte sedimentar, aqui denominadas como áreas famintas. Neste trabalho, os processos sedimen‑ tares que ocorrem ao longo da plataforma continental adjacente à desemboca‑ dura do rio Doce foram investigados. Dessa forma, o principal objetivo desta pesquisa foi entender a distribuição sedimentar na plataforma em questão, reconhecendo padrões distintos de sedimentação, considerando a inluência do aporte luvial na formação desses depósitos. Para tal, foram realizadas análises granulométrica, composicional e de densidade em 98 amostras de sedimento supericial. Os resultados mostraram 3 setores distintos: sul – dominado pela fração lamosa ligada a uma deposição recente e oriunda do aporte luvial, que se extendia até a profundidade de 30 m, a partir da qual se observa o domínio de sedimento bioclástico; central‑norte – dominado por areia lamosa, sendo reconhecido como uma zona de “passagem” do sedimento ressuspendido duran‑ te eventos de alta energia; e norte – presença de areias relíquias com alto teor de carbonato. O processo sedimentar moderno ao longo da plataforma continen‑ tal em estudo é dominado por regimes sedimentares distintos, mostrando uma forte inluência luvial associada à dispersão sedimentar induzida pela ação de ventos e ondas, além de apresentar um domínio carbonático na plataforma externa. Os fatores controladores desses regimes estão relacionados com o gradi‑ ente batimétrico e a distância da desembocadura do rio.
PALAVRAS‑CHAVE: Delta costeiro; Sedimento dinâmico; Rio Doce; Plataforma continental.
Modern sedimentary processes along
the Doce river adjacent continental shelf
Processos sedimentares modernos ao longo da plataforma
continental adjacente à desembocadura do rio Doce
Valéria da Silva Quaresma1*, Geórgia Catabriga1, Silvia Nossa Bourguignon1, Estefânia Godinho1, Alex Cardoso Bastos1
INTRODUCTION
Modern shelf morphology and sediment distribution is strongly inluenced by processes acting in diferent time scales. Short‑term processes such as wave‑current induced sediment transport, associated with inter‑annual variations in sediment supply, shape the seabed morphology and control sediment dispersion. On the other hand, long‑term processes like relative sea‑level changes, associated with time‑integrated sediment supply, control the sedimentary system, deined by Gao and Collins (2014) as a set of deposits formed in one geomorphological environment, including coastline trans‑ gression/regression and facies distribution.
In low‑latitude regions, biogenic carbonate sedimenta‑ tion dominates, but, in some cases, terrigenous sediment supply may supplant this regime, leading to diferentia‑ tion in the sedimentation pattern (Nittrouer et al. 2007). hese situations are common in areas where luvial pro‑ cesses control the sediment supply to the shelf. In areas where sediment supply is greater than sediment dispersion capacity, extensive terrigenous deposits and consequently submerged deltas can be formed. Moreover, episodic events, such as heavy looding, may lead to an uneven supply. hus, during catastrophic events or seasonal behavior, the sediment supply to the shelf can be increased, and varia‑ tions in sediment grain size can also occur. For example, during periods of heavy rainfall, the contribution of iner fractions (e.g. mud) would be greater than in dry periods. In addition to river supply control, the sedimentary pat‑ tern can still be inluenced by the coastal dynamics itself (Nitrouer et al. 2007).
According to Dominguez (2004), the Brazilian east coast receives a considerable amount of sediments due to the humid climate and the presence of large rivers that drain a mountainous area. his region was classiied as deltaic coast dominated by waves, mainly characterized by beach ridge coastal plains resulted from the interaction of histori‑ cal shifts of river mouth position, relative sea‑level changes and longshore drift pattern variations. hese changes were mainly controlled by atmospheric circulation and river discharge (Dominguez & Wanless 1991; Dominguez et al.
1992; Dominguez 2004).
he Doce river delta (northern coast of the Espírito Santo State) is one example of the deltaic systems situated along the eastern Brazilian coast (Dominguez 2004). he inluence of the Doce river sediment discharge along the coast and on the adjacent continental shelf was reported by Albino and Suguio (2010). hese authors studied the modern sedimen‑ tation processes and morphodynamics of Doce river mouth adjacent beaches (deltaic plain of the Doce) and identiied diferent sedimentary sources and hydrodynamic processes
that are inluenced by the river sediment discharge, carbon‑ ate sedimentation and meteorological events.
Despite the recognition of the inluence of the Doce river in the adjacent inner shelf and coastline sedimenta‑ tion, not much is known about the deposits formed by the luvial input. he majority of the research developed in the area is generally related to technical reports in order to meet the environmental regulations, or to underpin the economic activities in the area. A scientiic gap still exists in terms of a better understanding on the formation of the eastern Brazilian river‑delta deposits along the inner shelf and how the local sediment dynamics inluence the facies distribution.
he lack of data in the study area is a serious matter and insuicient to generate efective conclusions about the sed‑ iment dynamics on the shelf and its deposits. Due to the regional growth and the presence of oil and gas reserves on the continental shelf, this information become vital to the establishment of management plans and environmental con‑ trol impacts, as well as being fundamental to the exploita‑ tion of living and mineral resources. herefore, this work aimed to contribute to a regional recognition of prevailing sedimentary processes acting along the Doce river adjacent inner shelf.
Herein, we investigate the surface sediment distribution along the adjacent Doce River Inner Shelf (DRIS), in order to understand modern sedimentary processes and to discuss the importance of the luvial sediment input to the shelf.
METHODOLOGY
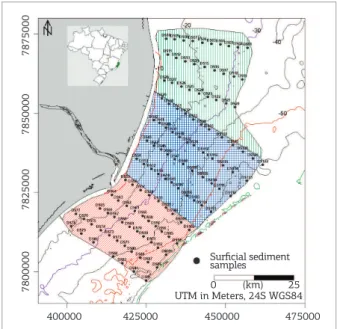
A total of 98 surface samples were collected using a Van Veen grab sampler. he sampling stations were deined based upon bathymetric and morphological gradients. Samples were collected from the deltaic lobe to the outer shelf, encom‑ passing water depths from 10 to 70 m (Fig. 1).
Sedimentological analysis included grain size, carbonate content and surface bulk density. he determination of sur‑ face bulk density was only carried out in 51 samples (about half of the total samples), due to water loss during the ield collection. Bulk density was deined using the equation below, from Amos and Sutherland (1994):
Ds = PS/VS (1)
Here, Ds is suricial bulk density (kg/m3), PS is the dry sed‑
iment weight (kg) and VS is wet sediment volume (m3).
wet sieving in a 63 μm sieve. he sand/gravel fractions were then subjected to mechanical sieving in 0.5 phi intervals, and the mud fractions were analyzed by a laser granulome‑ ter (Malvern Masterzise 2000). Calcium carbonate content was determined by dissolving the CaCO3 with hydrochlo‑ ric acid at 10%.
RESULTS
Sediment distribution
hree sectors were recognized based upon distinct sed‑ iment characteristics along the DRIS: south ‑ from the Doce river mouth to the southern boundary of the study area; central‑north ‑ on the stretch from the Doce river mouth up to 25 km northward; and north ‑ extending for approximately 28 km from the central‑north sector limit (Fig. 2). Based on this, the results are described consider‑ ing these three sectors.
Grain size and Calcium Carbonate content
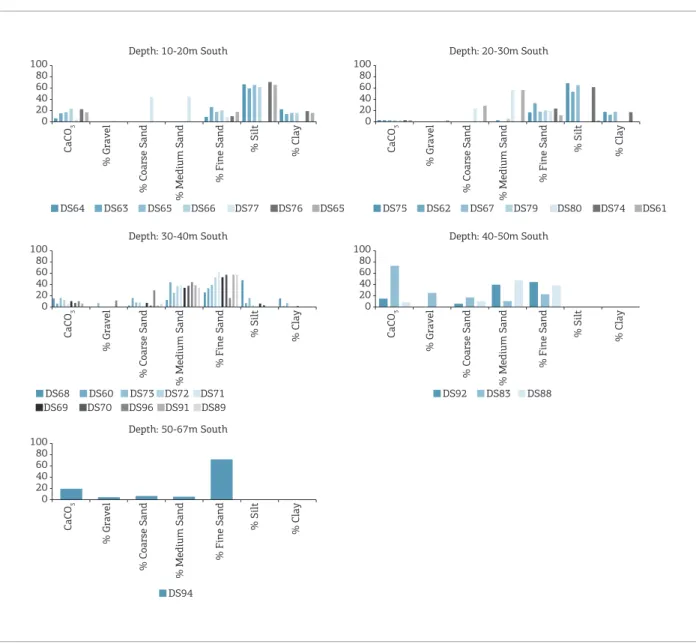
South sector presented the greatest mud content, reaching up to 90% in some samples. he highest content for clay‑component size was also observed in this sector (around 20%) (Fig. 3). his muddy deposit occurs from 10 to 30 m deep. Seaward (depth > 30 m), ine and very ine terrigenous sands become predominant. In terms of carbonates content, the average is around 20 and 15%
between 30 and 40 m. In areas deeper than 40 m, carbon‑ ate content increases signiicantly, reaching up to 70% (at the southern limit).
In the central‑north sector, the presence of a muddy deposit is still observed up to the 40 m water depth; how‑ ever, mud content is lower (45–50%) when compared with the southern sector (Fig. 4). Clay content did not exceed 10%. Fine to very ine terrigenous sands comprise up to 20%. Medium terrigenous sands are present (45% in some samples) between 30 and 40 m water depths. Deeper than 40 m, mud content decreases signiicantly, showing less than 20%. In general, ine to very ine terrigenous sands dominate, especially between depths of 30 and 50 m. In areas deeper than 50 m, the gravel fraction becomes more important, reaching 30% of the samples content. Note that in these deeper areas the carbonate content is higher, reach‑ ing up to 80%. According to the visual description, these samples were composed by bioclastic gravel/coarse sands and living rhodoliths.
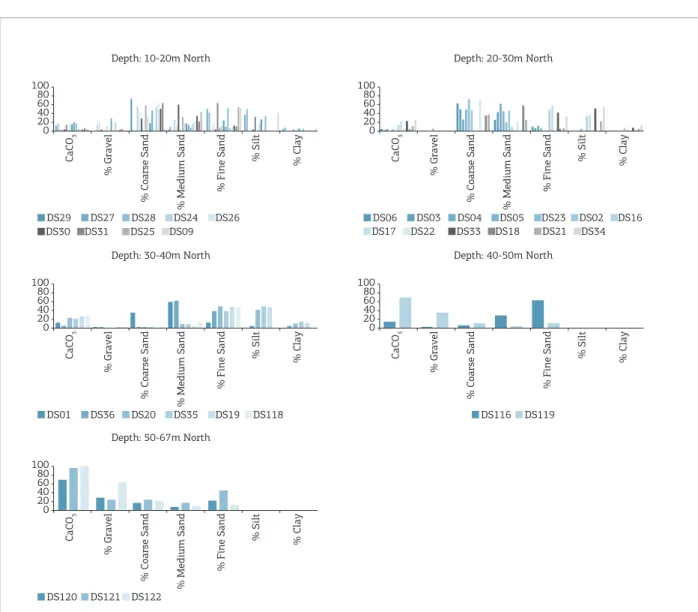
In the north sector, grain size distribution is more complex. Following a bathymetric gradient, there is no predominant grain size up to 20 m water depth. Grain size varies from gravel (about 20%) to sand (40%) and mud (about 40%) (Fig. 5). Between 20 and 30 m water depths, medium sand and mud predominate with a car‑ bonate content of up to 20%. Between 30 and 40 m water depths, mud content reaches up to 50%. Deeper than 40 m, despite the reduced number of samples, carbonate content reaches up to 80%, and living rhodoliths occur in combination with mud.
400000 425000
7875000
7850000
7825000
7800000
Sediment profiles
0 (km) 25 UTM in Meters, 24S WGS84
Surficial sediment samples
450000 475000
Figure 1. Location of the study area. Map showing the location of the samples presented in this study represented by black dots along a red line. DSx represents the sample label. The depth lines show a contour each 10 m depth. Coordinates are in UTM, Datum WGS84, 24S.
400000 425000
7875000
7850000
7825000
7800000 0 (km) 25
UTM in Meters, 24S WGS84 Surficial sediment samples
450000 475000
Surface bulk density
Analyses of surface bulk density were restricted to sam‑ ples collected at depths lower than 40 m. he results showed a clear sectorization of deposits with distinct bulk densities values associated. he distribution of these deposits is geo‑ graphically related to the Doce river mouth.
Southward from the river mouth, bulk density values ranged between 1,380 and 1,500 kg/m3 (Fig. 6). In most
samples, these values are related to higher mud concentration (Figs. 3 and 6). Northward from the river mouth, bulk den‑ sity measurements presented, in general, values higher than 1,500 kg/m3, reaching up to or greater than 2,000 kg/m3.
A trend in increasing bulk density values follows the sample distance from the coast and the water depth. Usually, sam‑ ples taken from 30 to 40 m water depths show bulk densities
values higher than 1,500 kg/m3. An important observation is
that the samples collected in central‑north and northern sec‑ tor had high plasticity, and in the southern sector the samples were liquidiied, indicating higher water content, indicated as well by their bulk density values. Moreover, higher bulk den‑ sity values are related to lower mud content (Figs. 5 and 6).
DISCUSSION
he results revealed that the continental shelf adjacent to the Doce river mouth presents diferent sedimentary patterns in terms of both depth and distance from the coast. In this case, it can be considered that the sedimentation patterns are diferent in relation to the source of terrigenous input.
Depth: 10-20m South Depth: 20-30m South
Depth: 30-40m South
CaCO
3
DS64 DS63 DS65 DS66 DS77 DS76
% Gravel
% Coarse Sand
% Medium Sand
% Fine Sand
% Silt % Clay
100 80 60 40 20 0
Depth: 50-67m South
Depth: 40-50m South DS65
CaCO
3
DS68 DS60 DS73 DS72 DS71 DS70
% Gravel
% Coarse Sand
% Medium Sand
% Fine Sand
% Silt % Clay
100 80 60 40 20 0
DS69 DS96 DS91 DS89
CaCO
3
DS94
% Gravel
% Coarse Sand
% Medium Sand
% Fine Sand
% Silt % Clay
100 80 60 40 20 0
CaCO
3
DS92 DS83 DS88
% Gravel
% Coarse Sand
% Medium Sand
% Fine Sand
% Silt % Clay
100 80 60 40 20 0
CaCO
3
DS75 DS62 DS67 DS79 DS80 DS74
% Gravel
% Coarse Sand
% Medium Sand
% Fine Sand
% Silt % Clay
100 80 60 40 20 0
DS61
Depth: 10-20m Central-North
CaCO
3
DS54 DS42 DS41 DS43 DS111 DS53
% Gravel
% Coarse Sand
% Medium Sand
% Fine Sand
% Silt % Clay
100 80 60 40 20 0
DS56 DS40 DS44
Depth: 20-30m Central-North
CaCO
3
DS39 DS45 DS97 DS52 DS38
% Gravel
% Coarse Sand
% Medium Sand
% Fine Sand
% Silt % Clay
100 80 60 40 20 0
DS46 DS51 DS58
Depth: 30-40m Central-North
CaCO
3
DS36 DS47 DS35 DS50 DS48 DS117
% Gravel
% Coarse Sand
% Medium Sand
% Fine Sand
% Silt % Clay
100 80 60 40 20 0
DS49 DS59 DS99 DS100 DS106 DS108 DS109
Depth: 50-67m Central-North
CaCO
3
DS36 DS47 DS35
% Gravel
% Coarse Sand
% Medium Sand
% Fine Sand
% Silt % Clay
100 80 60 40 20 0
Depth: 40-50m Central-North
CaCO
3
DS105 DS116 DS104 DS110
% Gravel
% Coarse Sand
% Medium Sand
% Fine Sand
% Silt % Clay
100 80 60 40 20 0
Figure 4. Diagrams showing the distribution of the grain size and carbonate content for the samples located in the central‑northern sector, according to water depth ranges, between 10 and 67 m. For sample location, see Fig. 1.
In order to discuss the sedimentary pattern along the Doce river adjacent continental shelf, some modern classic continental shelf sedimentation concepts should be resumed.
he equilibrium concept discusses the fact that the conti‑ nental shelf is subjected to physical forcing as winds, waves, currents and sediment input. hese driving forces vary in magnitude in a short time, and, even then, the observed sediment distribution pattern shows an equilibrium ratio, that is: forcing would be controlling the surface facies dis‑ tribution (Swift &horne 1991). hus, the continental shelf can be described in terms of accommodation and supply regimes. Continental shelves under an accommodation regime are subject to strong variations in sea level and/or high sediment dispersion rate, i.e., continental shelf that is subjected to marine transgression, with the presence of
erosive processes and estuarine environments. Supply regime continental shelves are those with a high rate of sediment input or higher sediment grain size that would not be mobi‑ lized by the hydrodynamic energy at the site, or regressive environments with progradation and/or presence of deltaic systems (Swift et al. 1987, Swift & horne 1991). In the case presented herein, the muddy deltaic lobe in the adja‑ cent inner shelf indicates a supply regime.
Depth: 10-20m North
CaCO
3
DS29 DS27 DS28 DS24 DS26
% Gravel
% Coarse Sand
% Medium Sand
% Fine Sand
% Silt % Clay
100 80 60 40 20 0
DS30 DS31 DS25 DS09
Depth: 20-30m North
CaCO
3
DS06 DS03 DS04 DS05 DS23
% Gravel
% Coarse Sand
% Medium Sand
% Fine Sand
% Silt % Clay
100 80 60 40 20 0 DS02 DS16 DS17 DS22 DS33 DS18 DS21 DS34
Depth: 30-40m North
CaCO
3
DS01 DS36 DS20 DS35 DS19
% Gravel
% Coarse Sand
% Medium Sand
% Fine Sand
% Silt % Clay
100 80 60 40 20 0 DS118
Depth: 50-67m North
CaCO
3
DS120 DS121 DS122
% Gravel
% Coarse Sand
% Medium Sand
% Fine Sand
% Silt % Clay
100 80 60 40 20 0
Depth: 40-50m North
CaCO
3
DS116 DS119
% Gravel
% Coarse Sand % Fine Sand
% Silt % Clay
100 80 60 40 20 0
Figure 5. Diagrams of distribution of the grain size and carbonate content for the samples located in the northern sector, according to water depth ranges, between 10 and 67 m. For sample location, see Fig. 1.
Depth: 10-20m South
DS63 2500
Surface Bulk Density
(kg/m 3) 2000 1500 1000 DS64 DS66 DS77
Depth: 10-20m Central-North
DS40 2500
Surface Bulk Density
(kg/m 3) 2000 1500 1000 DS41 DS42 DS43 DS44 DS07 DS08 DS10 DS11 DS14 DS03 DS04 DS05 DS06 DS18 DS45 DS46 DS52 DS38 DS58
Depth: 10-20m North
2500
Surface Bulk Density
(kg/m
3) 2000
1500
1000
Depth: 20-30m South
DS61 2500
Surface Bulk Density
(kg/m 3) 2000 1500 1000 DS75
Depth: 20-30m Central-North
2500
Surface Bulk Density
(kg/m
3) 2000
1500
1000
Depth: 20-30m North
2500
Surface Bulk Density
(kg/m
3) 2000
1500
1000 Depth: 30-40m South
DS71 2500
Surface Bulk Density
(kg/m 3) 2000 1500 1000 DS73 DS68
Depth: 30-40m Central-North
DS35 2500
Surface Bulk Density
(kg/m 3) 2000 1500 1000 DS36 DS47 DS49 DS50
Depth: 30-40m North
DS19 2500
Surface Bulk Density
(kg/m 3) 2000 1500 1000 DS35 DS36
Figure 6. Diagrams showing the sediment suricial bulk density values for each sample. The stations are grouped
Profile 1
Mean Grain Size Standard Grain Size 3.0 2.5 2.0 1.5 1.0 0.5 0.0 0.0 1.0 2.0 3.0 4.0 5.0 Phi Profile 2 3.0 2.5 2.0 1.5 1.0 0.5 0.0 0.0 1.0 2.0 3.0 4.0 5.0 Phi Profile 3 DS30 DS31DS32DS33 3.0 2.5 2.0 1.5 1.0 0.5 0.0 0.0 1.0 2.0 3.0 4.0 5.0 Phi Profile 4 3.0 2.5 2.0 1.5 1.0 0.5 0.0 0.0 1.0 2.0 3.0 4.0 5.0 Phi Profile 5 3.0 2.5 2.0 1.5 1.0 0.5 0.0 0.0 1.0 2.0 3.0 4.0 5.0 Phi Profile 6 3.0 2.5 2.0 1.5 1.0 0.5 0.0 0.0 1.0 2.0 3.0 4.0 5.0 Phi DS34 DS118 DS119 DS120 DS121 DS122 DS55 DS78 DS79 DS80 DS82 DS83
DS56 DS57 DS58
DS59 DS99 DS100 DS29 DS10DS09 DS08 DS43
DS65 DS66 DS67 DS68 DS69 DS70
DS90DS91 DS92
DS44 DS45DS46
DS47 DS48DS105
DS109DS110DS111
DS112
DS07 DS06 DS05DS04DS03 DS02 DS01
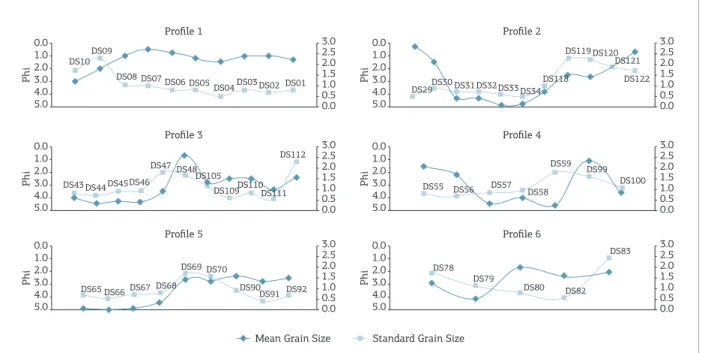
Figure 7. Relationship between mean grain size (mean) and standard deviation (SD) (values are according to Folk
and Ward 1957). Results show the distribution along distinct cross shelf sediment proiles. For the location of the sediment proiles, see Fig. 1.
ofshore direction, it would occurs a progressive sediment selection. As result, the coarser sediment is found near the coast, and iner sediment occurs ofshore. From this point of view, the grain size analysis for the study area does not show this clear pattern. Figure 7 shows sediment proiles along of the shelf presenting the relationship between mean grain size and standard deviation (values according to Folk and Ward 1957).
According to the Markov model (Swift et al. 1972), the relation between the mean grain size and standard deviation in a longitudinal section should be a decrease in grain size and a standard deviation increase from a particular site to deeper parts. he majority of the proiles for the study area does not follow the pattern described, however it should be noted that shoreface samples were not collected. he majority of the proiles showed an increase both in the mean and in the standard deviation towards ofshore, and this would be directly related to the presence of carbonates (Figs. 3 to 5). Results shows that coarser sediments are located towards the mid an outer shelf with an associated increase in carbonate content (up to 80%).
According to Albino and Suguio (2010), the river mouth adjacent beaches are composed mainly by coarse and medium terrigenous sands. hese authors demonstrate that modern riverine sand input is restricted to its mouth. hat would explain, in part, the absence of coarser sand fractions along the south and central‑north sectors. his would take the hypothesis that terrigenous sands found in the north sec‑ tor would be relict, i.e., these sands were not deposited by
modern prevailing luvial processes. An explanation is that these sands could be related to a Holocene ancient Doce river mouth, as proposed by Suguio et al. (1982), that are rarely mobilized today by prevailing wave action and/or longshore currents. he fact that this sector presents deposits with higher surface bulk density (~ 2,000 kg/m3) corrobo‑
rates this idea (Fig. 6). he sediments usually less consoli‑ dated are related to a recent deposition or constant resus‑ pension (Ross & Mehta 1989, Winterwerp & van Kestern 2004, Mehta 2013). he fact that they have a higher bulk density, and consequent higher compaction, may indicate an older and more stable deposit. In addition, these depos‑ its are found in a transition area for the Abrolhos continen‑ tal shelf (carbonate domain) and with no major terrigenous input contribution nearby.
Another point to highlight is that in the current stage of the Doce river delta development, the sands were depos‑ ited mainly in the deltaic plain and in proximal areas to the mouth, which would limit the contribution of these frac‑ tions ofshore (Holmes 1965, Fraser & Suttner 1986, Swift & horne 1991). hus, the suspended load, which is essen‑ tially the inest fraction (ine sand and mud), is transported and deposited in the inner continental shelf, forming muddy and muddy‑sandy deposits that were observed in the results.
In this case, considering grain size distribution, the southern sector has the highest mud content and also the higher clay content (Fig. 3). he position of this deposit, immediately at south of the river mouth, is due to the drift of the river plume, which is directed to the south, because of the dominance of northeasterly winds during fairweather. In this area, the bottom morphol‑ ogy is regular and smooth (Fig. 1), showing a lobe shape related to the deposition of iner material supplied by the Doce river.
hus, a sediment distribution analysis can provide valuable information on modern sedimentary process, based on well‑established theories found in the literature. Once the river plume reaches the marine environment, the particulate matter locculation process starts. his process is due to the muddy sediment cohesive property (Mehta & Partheniades. 1982, Berlamont et al. 1993, Torfs et al.
1996, Winterwerp & van Kesteren 2004, Mehta 2013). When the material in suspension meets saline water, the negative clays charges are neutralized by the salts (i.e. sodium). According to Mehta and Partheniades(1982), very low range of salinity values (between 2 to 10 ppt) allows the process to be completed. he locs are in turn formed by a mixture of clay, silt, very ine sand, organic matter, water and, in some cases, even gas (McAnally & Mehta 2001, Winterwerp & van Kesteren 2004). hus, soon as the plume meet seawater, the process begins, leading to a rapid deposition, once the locculation increases the set‑ tling velocity of the ine material. From this analysis, it was expected that deposition occurred immediately close the mouth, however these deposits are only observed from 10 m water depth.
he DRIS is located along a wave‑dominated environ‑ ment (Dominguez 2004). hus, even with the loccula‑ tion process, the river discharge energy coupled with wave action would transport ine material ofshore (> ‑10 m), not allowing immediate deposition close to the river mouth. In the DRIS case, it was observed that ine material depo‑ sition occurs in areas deeper than 10 m water depth. At this depth, ine sediments would not be remobilized by fair weather waves. his would explain the presence of the muddy deposit and the lower surface bulk density values (< 1,500 kg/m3) southward from the river mouth, indicat‑
ing a recent deposition and/or a process of lower consoli‑ dation phase (Figs. 6 and 8).
High density values usually are related to longer consoli‑ dation time and higher resistance to transport. As described elsewhere, dense sediment deposits have lower erosion sus‑ ceptibility (Jepsen et al. 1997, Lick & McNeil 2001, Bale
et al. 2006; 2007, Amos et al. 2004, Quaresma et al. 2004, Grabowski et al. 2011). hus, in the study area, we assumed
that higher density values would indicate longer consolida‑ tion time, and, in this case, values lower than 1,500 kg/m3
could indicate a less stable sediment bottom, i.e, higher sea‑ bed mobility potential. Also, it is clear from our dataset that values below 1,500 kg/m3 are concentrated in the shallow
south sector zone.
During cold front periods, higher energy waves from the S and SSE quadrant with higher wave orbital veloci‑ ties could remobilize and transport ine sediments north‑ ward (Bittencourt et al. 2007). It should be noted that the 30 m water depth represents the depth of bed remobili‑ zation by most frequent storm waves, which in the region have a signiicant height of 1.5 m and peak period of 6.5 s (Bittencourt et al. 2007). Another indication of this pro‑ cess is the higher bulk density values northwards (Figs. 6 and 8). As stated previously, this may indicate an older consolidated muddy deposit. As the locs are deposited, the interaction loc to loc and their own weight expel the water from the structure, leading to greater compaction of the deposit (Ross & Mehta 1989). his entire process takes time, and the material cannot be constantly resuspended for the process to complete.
he coarser grain sizes are found in deeper regions (Figs. 3 to 5) and are most related to the presence of bioclastic and rhodoliths, showing the limitation for terrigenous sediment transport. hese deeper areas have been characterized as car‑ bonate domain beds, extending along the Espírito Santo outer shelf as described by Bastos et al. (2015).
400000 425000
7875000
7850000
7825000
7800000
>75% Mud
>25% Carbonate Bulk Density > 1500 kg/m3
Bulk Density < 1500 kg/m3 50-75% Mud
0 (km) 25 UTM in Meters, 24S WGS84
450000 475000
CONCLUSIONS
he DRIS sedimentation pattern is directly inluenced by Doce river sediment supply. Riverine ine sediments are deposited to the south of the river mouth, forming a lower bulk density deposit with high mud content, comprising up to 12% of clay. he riverine modern sediment inluence reduces northward, where a higher bulk density deposits are observed, associated with greater mean grain size and lower mud content. he modern riverine terrigenous deposit is characterized by a deltaic lobe ending at 30 m water depth. Towards ofshore (water depths > 30 m), sandy facies are pre‑ dominant, and an increase in carbonate content is observed in areas deeper than 40 m. Mid‑outer shelf is characterized by typical marine carbonate sedimentation with the occur‑ rence of bioclastic sand and gravel and rhodoliths.
he DRIS sedimentation pattern can be described by the presence of three sectors:
■ South sector – dominated by riverine muds forming mod‑ ern deposits with bulk densities lower than 1,500 kg/m3
(ine sand and mud) and bioclastic sand/gravel ofshore (from 40 m depth). During storm events, inner shelf deposits can be remobilized and transported northward.
■ Central‑north sector – still an area of luvial inluence, but with less intense depositional processes. his would be a bypassing area for resuspended sediment during storm events when drift is reversed due to SSE winds.
Lower clay content and an increase in bulk density values were observed. Ofshore, ine to medium sands predom‑ inate, with an increase in carbonate content.
■ North sector – presence of relict sands with high carbonate content. he deposits found showed the highest bulk density values (> 2,000 kg/m3), indicating older or more stable deposit.
Modern sedimentation processes along the DRIS is inlu‑ enced by both luvial and the meteoceanographic conditions (as was expected). Sediment distribution is a result of tem‑ poral changes in riverine sediment supply with inter‑annual variability of meteoceanographic conditions, associated to fair weather and storm events. he integrated analysis of bulk density, grain size parameters and sediment composition has demonstrated that an immediate ine material deposi‑ tion occurs at the south of the river mouth in fairweather periods (N and NE winds), while northward transport pre‑ dominates during storm events associated with SSE winds.
ACKNOWLEDMENT
This study was supported by Coordenação de Aperfeiçoamento de Pessoal de Nível Superior (CAPES)/ Ciências do Mar (Grant number 224/2010) and by Fundação de Amparo à Pesquisa do Estado do Espírito Santo (FAPES, Grant number 54682860).
Albino J. & Suguio K. 2010. Sedimentation processes and beach morphodynamics active at the Doce River mouth, Espírito Santo State, Brazil. Anais da Academia Brasileira de Ciências,82(4):1031-1044.
Amos C.L. & Sutherland T.F. 1994. A rapid technique for the determination of dry sediment mass from saturated marine sands.
Journal of Sedimentary Research, 64(3):668-670.
Amos C.L., Bergamasco A., Umgiesser G., Cappucci S., Cloutier D., DeNat L., Flindt M., Bonardi M., Cristante S. 2004. The stability of tidal
lats in Venice Lagoon — the results of in‑situ measurements using
two benthic, annular lumes. Journal of Marine Systems,51:211-241.
Bale A.J., Widdows J., Harris C.B., Stephens J.A. 2006. Measurements of the critical erosion threshold of surface sediments along the
Tamar Estuary using a miniannular lume. Continental Shelf
Research,26(10):1206-1216.
Bale A.J., Stephens J.A., Harris C.B. 2007. Critical erosion proiles
in macro-tidal estuary sediments: implications for the stability of intertidal mud and the slope of mud banks. Continental Shelf Research,27(18):2303-2312.
Bastos A.C., Quaresma V.S., Marangoni M.B., D’Agostini D.P., Bourguignon S.N., Cetto P.H., Silva A.E., Amado Filho G.A., Moura R.L., Collins M. 2015. Shelf morphology as an indicator of sedimentary regimes: A synthesis from a mixed siliciclastice carbonate shelf on the eastern Brazilian margin. Journal of South American Earth
Sciences, 63:125-136.
Berlamont J., Ockenden M., Toorman E., Winterwerp J. 1993. The characterisation of cohesive sediment properties. Coastal
Engineering, 21:105-128.
Bittencourt A.C.S.P., Dominguez J.M.L., Martin L., Silva I.R., Medeiros K.O.P.2007. Past and current sediment dispersion pattern estimates through numerical modeling of wave climate: an example of the Holocene delta of the Doce River, Espírito Santo, Brazil. Anais da
Academia Brasileira de Ciências,79(2):333-341.
Dominguez J.M.L. 2004. The coastal zone of Brazil: an overview.
Journal of Coastal Research,SI39:16-20.
Dominguez J.M.L. & Wanless H.R. 1991. Facies architecture of a falling sealevel, Doce river coast, Brazil. International Association of
Sedimentologists Special Publication,14:259-281.
Dominguez J.M.L., Bittencourt A.C.S.P., Martin L. 1983. O papel da deriva litorânea de sedimentos arenosos na construção das planícies costeiras associadas a desembocaduras dos rios São Francisco (SE/ AL0), Jequitinhonha (BA), Doce (ES) e Paraíba do Sul (RJ). Revista
Brasileira de Geociências, 13(4):93-105.
Dominguez J.M.L., Bittencourt A.C.S.P., Martin L. 1992. Controls on quaternary coastal evolution of the east-northeastern coast of Brazil: roles of sea-level history, trade winds and climate. Sedimentary Geology, 80:213-232.
Folk R.L. & Ward W.C. 1957. Brazos River Bar: A study in signiicance of
Grain Size Parameters. Journal of Sedimentary Petrology, 27(1):3-26.
Fraser G.S. & Suttner L. 1986. Alluvial fans and fan deltas. Boston, Human Resources Development Corporation, 199 p.
Gao S. & Collins M.B. 2014. Holocene sedimentary systems on continental shelves. Marine Geology, 352:268-294.
Grabowski R.C., Droppo I.G., Wharton G. 2011. Erodibility of cohesive sediment: The importance of sediment properties. Earth‑Science
Reviews,105:101-120.
Holmes A. 1965. Principles of Physical Geology. London, Thomas Nelson Sons, 1288 p.
Jepsen R., Roberts J., Lick W. 1997. Efects of bulk density
on sediment erosion rates. Water Air and Soil Pollution,
99(1-4):21-31.
Lick W. & McNeil J. 2001. Efects of sediment bulk properties on
erosion rates. Science of the Total Environment, 266(1-3):41-48.
McAnally W.H. & Mehta A.J. (eds).2001. Collisional aggregation of
ine estuarial sediment. In: Coastal and Estuarine Fine Sediment
Processes. Elsevier Science B.V.,p. 19-39.
Mehta A.J. & Partheniades E. 1982. Resuspension of deposited cohesive sediments beds. Proc. 18th Int. Conf. Coastal Eng., ASCE.
1569-1588.
Mehta A.J. 2013. An introduction to hydraulic of ine sediment
transport. Singapore, World Scientiic Publishing, 1039 p.
Nittrouer C.A., Austin Jr. J.A., Field M.E., Kravitz J.H., Syvitski J.P.M., Wiberg P.L. 2007.Writing a Rosetta stone: insights into continental-margin sedimentary processes and strata. In: Nittrouer C.A., Austin Jr. J.A., Field M.E., Kravitz J.H., Syvitski J.P.M., Wiberg P.L. Continental margin sedimentation: from
sediment transport to sequence stratigraphy. Special Publication 37, International Association of Sedimentologists, Blackwell
Scientiic Publications.
Quaresma V.S., Amos C.L., Flindt M. 2004. The inluences of biological
activity and consolidation time on laboratory cohesive beds. Journal
of Sedimentary Research, 74(2):184-190.
Ross M.A. & Mehta A.J. 1989. On the mechanics of lutoclines and
luid mud. Journal of Coastal Research,SI5:51-61.
Suguio K., Martin L., Dominguez J.M.L. 1982. Evolução da Planície
Costeira do rio Doce (ES) durante o quaternário: inluência das lutuações
do nível do mar. In: IV Simpósio do Quaternário do Brasil, p. 93-116.
Swit D.J.P. & Thorne J.A. 1991. Sedimentation on continental
margins, I: a general model for continental shelf sedimentation. In:
Swit D.J.P., Oertel G.F., Tillman R.W., Thorne J.A. (eds). Shelf Sand
and Sandstone Bodies: Geometry, Facies and Sequence Stratigraphy. Oxford, Special Publication 14, International Association of
Sedimentologists, Blackwell Scientiic Publications, p. 3‑31.
Swit D.J.P, Ludwick J.C., Boehmer W.R. 1972. Shelf Sediment
Transport, a probability model. In: Swit D.J.P., Duane D.B., Pilkey O.H.
(eds). Shelf Sediment Transport: Process and Pattern. Stroudsbourg, PA, Dowden Hutchinson & Ross,195-223 p.
Swit D.J.P., Hudelson P.M., Brenner R.L., Thompson P. 1987. Shel
construction in aforeland basin: storm beds, shelf sand bodies and shelf-slope sequences in the Upper cretaceous Mesaverde group,
Book Clifs, Utah. Sedimentology, 34:423-457.
Torfs H., Mitchener H., Huysentruyt H., Toorman E. 1996. Settling and consolidation of mud/sand mixtures. Coastal
Engineering, 29:27-45.
Winterwerp J.C. & van Kesteren W.G.M. 2004. Introduction to the physics of cohesive sediments in the marine environment. Elsevier, Developments in Sedimentology, 56.