1Research and Graduation Program in Geology, Department of Geology, Institute of Geosciences, Universidade Federal da Bahia – UFBA, Salvador (BA), Brazil.
E-mails: [email protected]; [email protected]; [email protected]
2Department of Geology, Escola de Minas, Universidade Federal de Ouro Preto – UFOP, Ouro Preto (MG), Brazil. E-mail: [email protected] 3Department of Regional Geology and Geotectonics, School of Geology, Universidade do Estado do Rio de Janeiro – UERJ, Rio de Janeiro (RJ), Brazil.
E-mail: [email protected] *Corresponding author.
Manuscript ID: 30240. Received: 02/18/2015. Approved: 09/25/2015. ABSTRACT: he Paramirim Corridor represents the maximum inversion zone of the Paramirim Aulacogen. Reverse-to-reverse dex-tral shear zones and various types of folds dominate such corridor. hese structures relect a stress ield that is WSW-ENE oriented, de-veloped in units of Aulacogen basement, as well as in the Lagoa Real Intrusive Suite, of Statherian age, in Espinhaço and São Francisco supergroups, of Statherian-Tonian and Cryogenian ages, respecti-vely, and in the Macaúbas-Santo Onofre Group, of Tonian age at the most. A rich collection of extensional structures truncate compres-sional structures of the Paramirim Corridor, characterized by normal shear zones and foliation, which is sometimes mylonitic, down-dip stretching lineation, drag folds, traction fractures and S/C structures. In these shear zones, quartz occurs truncated by the foliation, while feldspars are fractured and altered to white mica. Distribution of the quartz c-axes is at a maximum of 14° from the Z-axis. hus, it suggests that the deformation activated mainly the basal glide planes in the <a> direction. he paleostress study using the Win-Tensor software demonstrated that the regimen ranged between radial and pure dis-tention. he S1 direction oscillated around a vertical trend, while s3 was sub-horizontal, with a predominant N230-050° direction. Ar-Ar ages in biotite obtained from the extensional shear zones ranged from 480 and 490 Ma. Together, data obtained for the structures associated with the late extensional regimen described in the present study sug-gest that its nucleation is associated with distal and brittle-ductile sec-tors of the gravitational collapse zone of Araçuaí-West Congo Orogen. KEYWORDS: Shear Zone; Paramirim Corridor; Gravitational Collapse.
RESUMO: O Corredor do Paramirim representa a zona de máxima inversão do Aulacógeno do Paramirim, no qual predominam zonas de cisalhamento reversas-reversas destrais e vários tipos de dobras. Essas es-truturas reletem um campo de tensão segundo WSW-ENE, os quais se desenvolvem nas unidades de embasamento do Aulacógeno, assim como na Suíte Intrusiva Lagoa Real, de idade estateriana, nos supergrupos Espinhaço e São Francisco, de idades estateriana-toniana e criogeniana, respectivamente, bem como no grupo Macaúbas-Santo Onofre, de idade máxima toniana. Um rico acervo de estruturas extensionais truncam as estruturas compressionais do Corredor do Paramirim, sendo caracteriza-do por zonas de cisalhamento normais e foliação, por vezes milonítica, lineação de estiramento down dip, dobras de arrasto, fraturas de tração e estruturas S/C. Nessas zonas de cisalhamento, o quartzo ocorre trunca-do pela foliação, enquanto o feldspato apresenta-se fraturatrunca-do e alteratrunca-do para mica branca. A distribuição dos eixos-c de quartzo encontra-se no máximo a 14º do eixo Z. Portanto, isso sugere que a deformação ativa os planos basais <a>. O estudo de paleotensão utilizando o programa Win-Tensor demonstrou que o regime variou entre a distensão radial e a pura. A direção de s1 oscilou ao redor da vertical, enquanto que s3 é sub-horizontal, com predominância da direção N230-050º. Idades Ar-Ar em biotita obtidas nas zonas de cisalhamento extensionais variou entre 480 e 490 Ma. Em conjunto, os dados obtidos para as estruturas as-sociadas com o regime extensional tardio descrito neste trabalho sugerem que a sua nucleação está relacionada com os setores distais, rúptil-dúcteis, da zona de colapso gravitacional do Orógeno Araçuaí-Oeste Congo.
PALAVRAS-CHAVE: Zonas de Cisalhamento; Corredor do Paramirim; Colapso Gravitacional.
Tectonic inversion of compressional
structures in the Southern portion of the
Paramirim Corridor, Bahia, Brazil
Inversão tectônica de estruturas compressionais da
porção Sul do Corredor do Paramirim, Bahia
Simone Cerqueira Pereira Cruz1*, Fernando Flecha Alkmim2,
Johildo Salomão Figueiredo Barbosa1, Ivo Dussin3, Luiz César Corrêa Gomes1
INTRODUCTION
Most deformation imprinted on old continental blocks is accommodated with reactivation of pre-existing structures (Charrier et al. 2002, Butler et al. 2006, Cunningham 2005, 2013, among others). One of the clearest examples of tectonic reactivation is the nucleation of reverse fault from existing normal faults in continental margins, which is known as the process of positive tectonic inversion (Letouzey 1990). he inversion of deformational structures has been recognized in intracontinental domains (for example Ziegler 1983, Letouzey 1990, Charrier et al. 2002, Cunningham 2005, 2013), in active continental margins, and in collisional environments (Ziegler 1983, Butler et al. 2006, Dhahri & Boukadi 2010). his process is well recorded in sectors that undergo several superimposed subsidence pulses, in areas where compression has afected a stratigraphic pile deposited in an extensional environment or even in reverse shear zones that were reactivated as normal ones (negative inversion) (Allmendinger et al.1983, Jolivet et al.1991, Faccenna et al. 1995).
Aulacogens are failed rifts developed in internal portions of continents (Burke & Whiteman 1973, Burke & Dewey 1973, Dewey & Burke 1974, Hofman et al.1974, Sengör
et al.1978). According to such authors, their inilling is marked by the presence of thick sequences of sedimen-tary rocks, which are often associated with volcanic rocks. heir lateral limits are marked by deep fault zones that con-trol sedimentation. Due to their position near orogenic belts, a great number of aulacogens is partially inverted.
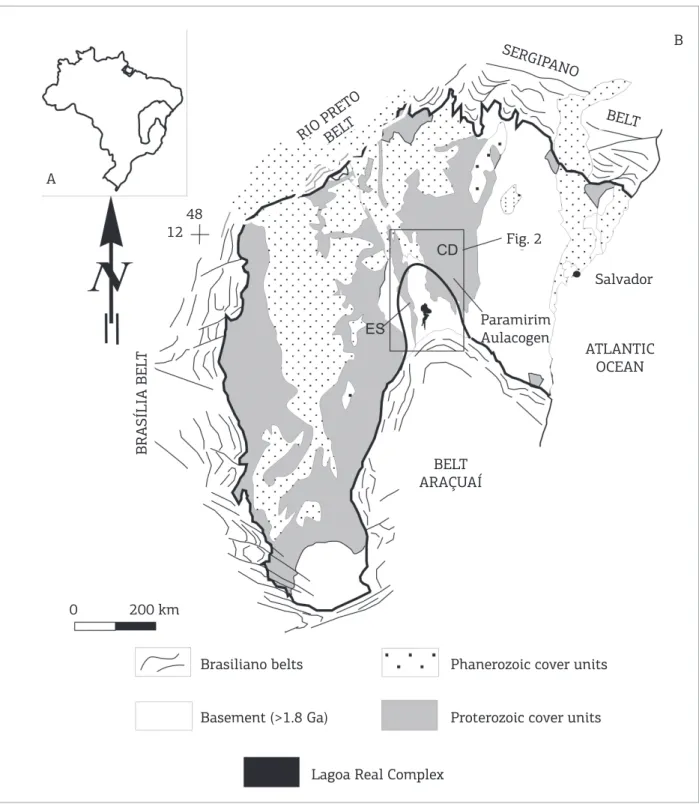
he Paramirim Aulacogen (Figs. 1 and 2), located in the center-eastern portion of the state of Bahia, in Brazil, corresponds to a succession of rifts that were developed between 1.7 and 0.65 Ma (Pedrosa-Soares & Alkmim 2011). During the Neoproterozoic, extensional structures were partially inverted. Moreover, the Paramirim Aulacogen zone of maximum positive inversion, denominated as Paramirim Corridor (Alkmim et al. 1993) (Figs. 1 and 2), presents a general NNW-SSE orientation. It is comprised of Chapada Diamantina Ocidental Fold hrust Belt, east-wards, and Northern Espinhaço Setentrional Fold hrust Belt, westwards. hese belts signalize the evolution of an Intracontinental Orogen, similar to what was described by Cunningham (2005, 2013).
From a tectonic point of view, two sectors can be sepa-rated in the Paramirim Corridor: the northern and southern (Cruz & Alkmim 2006), as seen in Figure 1. he northern sector includes the region of interaction between Paramirim Aulacogen and Rio Preto-Riacho do Pontal orogenic belt (Fig. 1), as well as the portion of the aulacogen in which the normal faults of the basement were spared from inversion
processes (Danderfer Filho 2000). he southern sector (Figs. 1 and 2) comprises the region of the Paramirim Aulacogen that was inverted in response to the collisions of Brasília Orogen and the counter-clockwise rotation of São Francisco-Congo Plate, culminating in the structure of the conined Araçuaí-West Congo Orogen (Alkmim et al. 2006) and the Rio Pardo Salient (Cruz & Alkmim 2006). According to these authors, in this sector, dextral transpressional shear zones were nucleated and these structures were responsible for juxtaposing the basement units over the Proterozoic cover units of the aulacogen.
he present study had the main objective of describing and interpreting the extensional structures that followed the compressional evolution of the Paramirim Corridor south-ern sector. he Paramirim Aulacogen represents an import-ant natural laboratory in which the structures of its positive inversion are very well preserved, as well as those coeval with late extensional reactivations. Since it is located within the intracontinental domain of a conined orogen, the Araçuaí Orogen, this is placed in a peculiar tectonic context, making this study widely interesting to the international literature.
MATERIALS AND METHODS
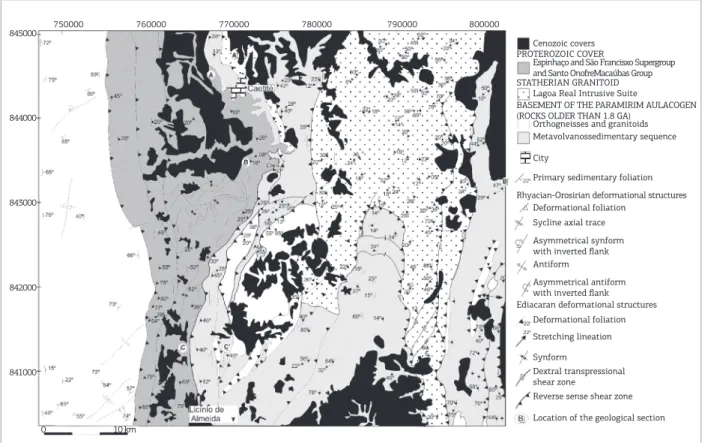
he present research involved ieldwork, during which geological mapping was performed at scales of 1:1,000; 1:25,000; 1:50,000 and 1:100,000. Moreover, descriptions of geological sections, microstructural analysis, and crystal-lographic fabric (quartz C-axis) and paleostress studies were carried out. Tectonite samples were collected from sites that are not illustrated in Fig. 2, but consisting in normal shear zones that either truncate or are parallel to Neoproterozoic compressional structures, especially tectonites generated by the deformation of Lagoa Real Intrusive Suite. his unit was chosen for the present study due to its Statherian age and because it presents only one deformation episode, which hap-pened during the Ediacaran Period (Cruz & Alkmim 2006). Microstructural and crystallographic fabric (C-axis) analyses were performed on the XZ plane of the inite strain ellipsoid of the normal shear zones. he quartz C-axis was determined through a U-stage available at the Microanalysis Laboratory (Microlab) of the Universidade Federal de Ouro Preto.
main stress tensor was performed through the Win-Tensor software developed by Delvaux (2012).
For the 40Ar/39Ar analyses, samples were irradiated with
the GA-1550 standard (McDougall & Harrison 1999) and then they were applied to the nuclear reactor of the Instituto
de Pesquisas Energéticas (IPEN) of Universidade de São Paulo
(USP), IPEN/CNEN IEA-R1, operating at 2 megawatts. Sample irradiation was performed in combination with an international standard (Fish Canyon – sanidine) to moni-tor the low of neutrons, with a complementary control of
A
B
SERGIP ANO
BELT
Salvador Fig. 2
Paramirim Aulacogen
0 200 km
Brasiliano belts Phanerozoic cover units
Proterozoic cover units
Lagoa Real Complex BELT ARAÇUAÍ
ATLANTIC OCEAN 1248
RIO PRETOBELT
BRASÍLIA BEL
T
Basement (>1.8 Ga)
other international standards (GA-1550 – biotite, AC – san-idine, Hb 3gr – hornblende). he 40Ar/39Ar laboratory used
a coherent argon laser source (480–540 ηm) with 6 watts of
nominal power, Innova 90, for extraction by either step heat-ing or total fusion of the irradiated samples. Measurements were taken through an argon extraction and puriication
0 50
Rio Pardo Salient
Site selected for the paleostress study
Location of sample SCP-1351 Cachoeira mine (uranium)
Location of sample SCP-711
Site selected for the microstrutural and quartz C-axis analyses Santo-Onofre-Macaúbas Group
São Francisco Supergroup Mesozoic covers
Cenozoic covers
Espinhaço supergroup Lagoa Real Intrusive Suite Basement (age > 1.8 Ga)
Normal sense shear zone Reverse sense shear zone Dextral and sinistral sense shear zone
Inverted normal shear zone Metamorphic foliation
Stretching lineation Antiform axial trace Synform axial trace Synform axial trace with inverted limb Paramirim corridor
100 150 km
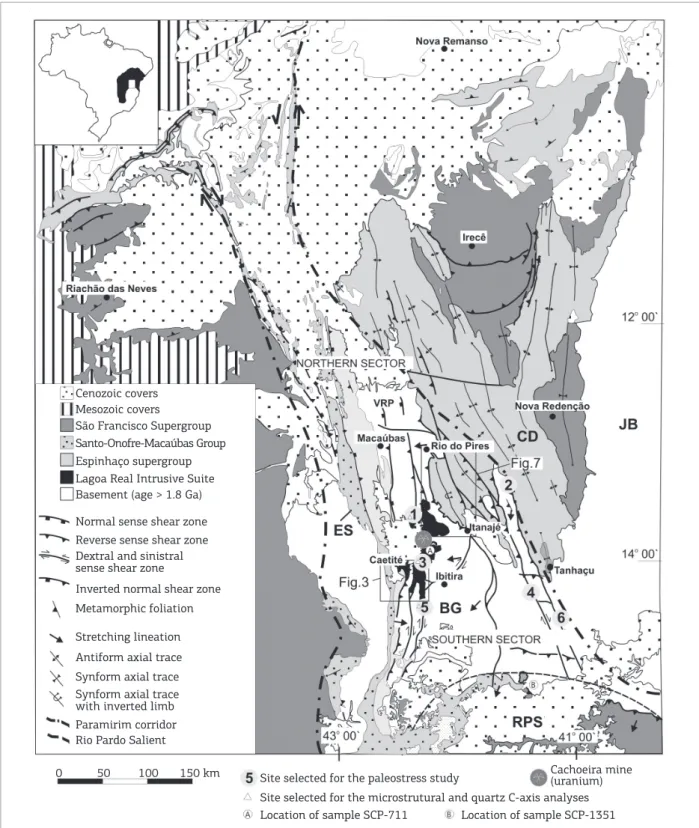
Figure 2. Simpliied geological map of the Paramirim Aulacogen, emphasizing the main geological units and the tectonic structures of Ediacaran age (Cruz & Alkmim 2006). Figures 3 and 7 are located herein.
system with ultra-high-vacuum capacity connected to a high sensitivity mass spectrometer, MAP-215-50 Mass Analyser Products (England), as described in Vasconcelos et al. (2002).
REGIONAL GEOLOGICAL CONTEXT
he Paramirim Aulacogen (Pedrosa-Soares et al. 2001) is a large morphostructural feature located on the São Francisco-Congo Paleoplate that includes the Northern Serra do Espinhaço mountain range, Paramirim and São Francisco valleys, and Chapada Diamantina (Fig. 2).
Generated from a succession of rift/syneclise stages that took place between 1.75 and 0.67 Ma (Pedrosa-Soares & Alkmim 2011), the Paramirim Aulacogen experienced a pro-nounced inversion during the Ediacaran (Danderfer Filho 2000, Cruz & Alkmim 2006, Guimarães et al. 2005, 2012, Cruz et al. 2012). he aulacogen substrate is composed of Archean granitoids, which were gneissiied and migmatized, Paleoproterozoic metavolcanossedimentary sequences and Siderian, Rhyacian and Orosirian granitoids (Santos-Pinto
et al. 1998, Bastos Leal et al.1998, 2000).
he Lagoa Real Intrusive Suite represents the alkaline and anorogenic granitoids of this aulacogen (Teixeira 2000). his intrusive suite includes predominantly syenites, syenogran-ites and alkali-feldspar gransyenogran-ites, which are leucocratic and mostly either porphyritic or medium phaneritic in their texture (Cruz et al. 2007b). he crystallization age of these rocks is around 1.7 Ga (Turpin et al. 1988, Cordani et al. 1992, Cruz et al. 2007b).
The aulacogen infilling units are Espinhaço, São Francisco Supergroups and the Macaúbas-Santo Onofre Group (Fig. 2). he Espinhaço Supergroup is represented by a sequence of siliciclastic rocks with acid metavolca-nic rocks, including the deposition age varying between 1.75 and 0.9 Ga (Chemale-Júnior et al. 2012, Guadagnin
et al. 2015). he São Francisco Group of Cryogenian age (Misi et al. 2011) comprises diamictites, quartz-sand-stones, greywackes, arkoses and pelites on its base, which is covered of carbonate lithofacies (Guimarães et al. 2012). In turn, the Santo Onofre-Macaúbas Group, with max-imum age of 0.9 Ga (Babinsky et al. 2011), includes feldspar metasandstones and metaquartz sandstones, oligomictic metaconglomerates, phyllites and hematite metapelites, which are rich in graphite, manganese or sericites (Guimarães et al. 2012).
he rocks from Espinhaço Supergroup are cut by maic and tholeiitic dikes and sills from the continental intraplate environment (Teixeira 2005, 2008, among others), with ages between 1.4 – 1.6 and 0.8 – 0.9 Ga (Guimarães et al. 2005, Danderfer Filho et al. 2009, among others).
he Paramirim Aulacogen presents the following four sets of deformation structures:
■ structures that are exclusive to the aulacogen basement, which comprises gneissic banding, folds and gneissic domes observed especially in the Rhyacian-Orosirian units;
■ extensional structures that are associated with the aulaco-gen formation from the Statherian to the Tonian period, and were preserved to the north from parallel 12° 45’ S and south from parallel 12° 15’ S. his set comprises normal-to-normal dextral shear zones that outcrop north from the municipality of Macaúbas (Fig. 2);
■ structures that relect its positive inversion (Fig. 2), rep-resented, in general, by reverse to transpressional shear zones and regional folds, distributed along the north-ern and southnorth-ern sectors of the Paramirim Corridor (Fig. 2); and
■ late extensional structures that relect its negative inver-sion (Cruz & Alkmim 2006), especially in its southern sector, and which are the subject of the present study.
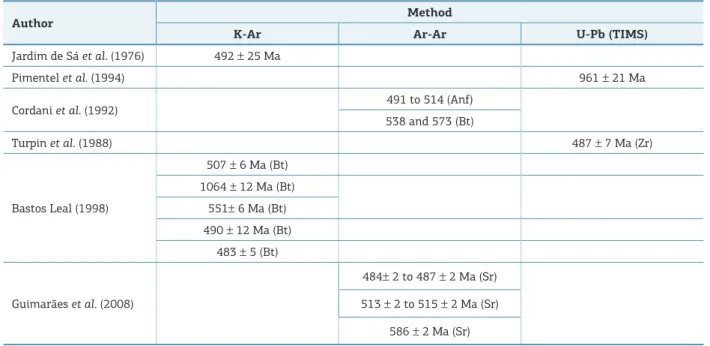
he collection of available geochronological data for the Neoproterozoic shear zones of Paramirim Corridor (Fig. 2) are detailed in Table 1.
COMPRESSIONAL DEFORMATION
STRUCTURES ASSOCIATED WITH
THE POSITIVE INVERSION OF
PARAMIRIM AULACOGEN
his group of structures has been extensively described by Danderfer Filho (2000), Lagoeiro (1990), Cruz and Alkmim (2006, 2007a), Guimarães et al. (2005, 2012), Cruz et al. (2007b, c, 2012) and Borge et al. (2015), among others. It relects a regional stress ield oriented WSW-ENE (Cruz & Alkmim 2006). In the southern portion of the Aulacogen, two sets of older deformation structures were hierarchized by Cruz and Alkmim (2006) as Da and Dp, respectively. he Da structures are represented by schistosity (sensu Fettes & Desmons 2007) and gneissic banding, which are parallel to each other and positioned at a low dipping angle, as well as by high rake stretching lineation and sheath folds that mark the Rio Pardo Salient (Cruz & Alkmim 2006). Based on such investigators, these structures are developed predom-inantly in units of the Archean-Paleoproterozoic basement of the aulacogen, as well as in those of the Macaúbas Group.
connected to the shear zones that were mapped by Silva (2010). hey are present in the rocks of the aulacogen sub-strate, where they truncate deformation structures older than 1.8 Ga in Lagoa Real Intrusive Suite and in Proterozoic units (Cruz & Alkmim 2006, 2007a, Cruz et al. 2007b,c, 2012). his deformation phase was responsible for nucle-ating the Espinhaço Setentrional and Chapada Diamantina Fold hrust Belts.
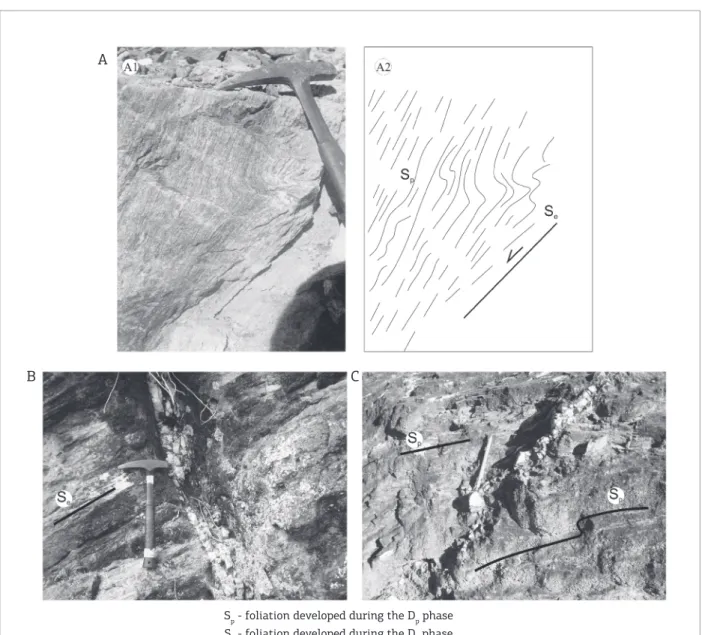
In the basement rocks of Paramirim Aulacogen and in Lagoa Real Intrusive Suite, the Dp structures are either reverse or reverse-dextral, ductile to ductile-brittle, shear zones (Figs. 2, 3, 4A, 5A-B, 6A-B, 7, 8A-B), with NNW/ SSE orientation (Fig. 9A), and also pop-up structures (Cruz 2004, Borge et al. 2015). he shear-sense indicators in these zones are S/C structures. Intrafolial isoclinal folds integrate the structural framework (Fig. 6B). Folds with asymmetrical and symmetrical enveloping are associated with such defor-mation phase in the metavolcanossedimentary sequences of the basement (Borge et al. 2015), as seen in Figures 6A and 6C. Moreover, a prominent mylonitic foliation was formed in Lagoa Real Intrusive Suite, parallel to a gneissic banding (Fig. 5B).
Southwards from parallel 12° 45’ S (Fig. 2), the Dp shear zones caused thrusting of Archean and Paleoproterozoic units over Proterozoic cover units. Examples are the occur-rences of reverse shear zones of Chapada Diamantina Fold hrust Belt between the municipalities of Rio do Pires and Itanajé (Figs. 2, 7, 8A-C), and the Espinhaço Setentrional Fold hrust Belts in the region of the municipality of Caetité (Figs. 2, 4C). Sinistral wrench shear zones with high plung-ing angles and general E-W orientation form this framework.
In the region of Ibitira municipality, these shear zones were in charge of thrusting the Statherian rocks of Lagoa Real Intrusive Suite over the basement units of Paramirim Aulacogen (Figs. 5A-C), which are Archean-Paleoproterozoic.
In turn, the Proterozoic aulacogen cover units (Espinhaço and São Francisco Supergroups, in addition to Santo Onofre Group) absorbed the deformation through the development of regional folds (Fig. 8D), with general NNW-SSE orien-tation, open to closed enveloping surfaces, symmetrical or asymmetrical geometry, parasitic folds in S, Z, M or W, and a high dipping angle for the axial foliation plane (Danderfer Filho 2000, Cruz & Alkmim 2006, Cruz et al. 2012). Inter and intra-strata shear zones, which are either reverse or thrusting, besides duplexes and imbricate fans preceded the formation of regional folds in Chapada Diamantina Fold hrust Belt (Cruz & Alkmim 2006, Cruz et al. 2007c). Stratigraphic inversions can be observed in the units of Espinhaço Supergroup that are outcropped on the western margin of Chapada Diamantina (Água Quente Synclinal, Cruz et al. 2007a,b,c) and on the eastern border of Northern Espinhaço (southwards from Caetité municipality).
In the Northern Espinhaço Fold hrust Belt, the top structure is oriented WNW (Cruz & Alkmim 2006) (Figs. 2, 5 to 7), while in the Chapada Diamantina Fold hrust Belt (Figs. 2 to 4), the tectonic transport associated with the structures of the Dp family is, in general, oriented towards ENE (Cruz 2004, Cruz et al. 2007c).
Figure 9A illustrates the general orientation of phase Dp shear zones nucleated in the Lagoa Real Intrusive Suite and in the inilling units of Paramirim Aulacogen. Figure 9B shows the distribution of the stretching lineation identiied
Table 1. Synthesis of the geochronological data available for the shear zones of Paramirim Corridor.
Author Method
K-Ar Ar-Ar U-Pb (TIMS)
Jardim de Sá et al. (1976) 492 ± 25 Ma
Pimentel et al. (1994) 961 ± 21 Ma
Cordani et al. (1992) 491 to 514 (Anf)
538 and 573 (Bt)
Turpin et al. (1988) 487 ± 7 Ma (Zr)
Bastos Leal (1998)
507 ± 6 Ma (Bt) 1064 ± 12 Ma (Bt)
551± 6 Ma (Bt) 490 ± 12 Ma (Bt)
483 ± 5 (Bt)
Guimarães et al. (2008)
484± 2 to 487 ± 2 Ma (Sr)
513 ± 2 to 515 ± 2 Ma (Sr)
586 ± 2 Ma (Sr)
in these zones. Structures with high obliquity are predom-inant, although lineation with medium to low rake angles can be found, especially to the south of Caetité and Itanajé municipalities (Cruz & Alkmim 2006).
he Irecê region (Fig. 2) comprises a set of folds and thrust faults with general E-W direction, formed through mass movements that occurred from north to south, which were originated from Riacho do Pontal Fold hrust Belt (Lagoeiro 1990), and that follow the structure family of phase Dp.
RECORD OF THE LATE
EXTENSIONAL DEFORMATION OF
PARAMIRIM AULACOGEN: RESULTS
Main macroscopic structures of phase D
ehe characteristic elements regarding the De deforma-tion phase comprises: normal, planar or anastomotic shear zones (sensu Passchier & Trouw 2005), with thickness vary-ing between 1 cm and 1 m (Figs. 5D-E; 6D; 8E-F), which were identiied in several outcrops in the area, but occur subordinately in relation to the compressional structures, making mapping diicult in a regional scale.; one foliation,
at times mylonitic, and one down dip stretching lineation; asymmetrical, parasitic, inclined, reclined with plunge folds (sensu Fleuty 1964) (Figs. 4D, 5D, 10A) or recumbent ones, with the possibility of crenulation; traction fractures that are, in general, either vertical or in a high angle (Figs. 10B-C); and S/C structures (Fig. 8E).
In essence, the formation of De structures occurred through extensional reactivation of Dp structures, i.e. either through their negative inversion or by the develop-ment of normal shear zones that truncate the structures of phase Dp (Figs. 4 to 6 and 8). In the irst case, since the structures are the product of reactivation, it is common to observe reverse and normal movement domains in the same outcrop, which alternate longitudinally and trans-versally (Figs. 8E-F). In the second case, parasitic folds are seen (Figs. 5D-E).
Extensional De structures can be observed in the gneis-siied rocks of Lagoa Real Intrusive Suite, which truncate the mylonitic and compressional, Dp, foliation of these rocks. For example, normal shear zones were found east-wards from this belt, in the region near the municipality of Caetité (Fig. 5D), as well as in Cachoeira Mine (Fig. 10A).
In the Northern Espinhaço Setentrional Fold hrust Belt, eastwards from the municipality of Caetité (Fig. 2),
Cenozoic covers
Location of the geological section BASEMENT OF THE PARAMIRIM AULACOGEN (ROCKS OLDER THAN 1.8 GA)
STATHERIAN GRANITOID PROTEROZOIC COVER 800000
790000 780000
770000 760000
750000 845000
844000
843000
842000
841000
0 10 km
Rhyacian-Orosirian deformational structures
Ediacaran deformational structures
Reverse sense shear zone Dextral transpressional shear zone Synform Stretching lineation Deformational foliation Asymmetrical antiform with inverted flank Antiform
Asymmetrical synform with inverted flank Sycline axial trace Deformational foliation Primary sedimentary foliation City
Metavolvanossedimentary sequence Orthogneisses and granitoids Lagoa Real Intrusive Suite Espinhaço and São Francisxo Supergroup and Santo OnofreMacaúbas Group
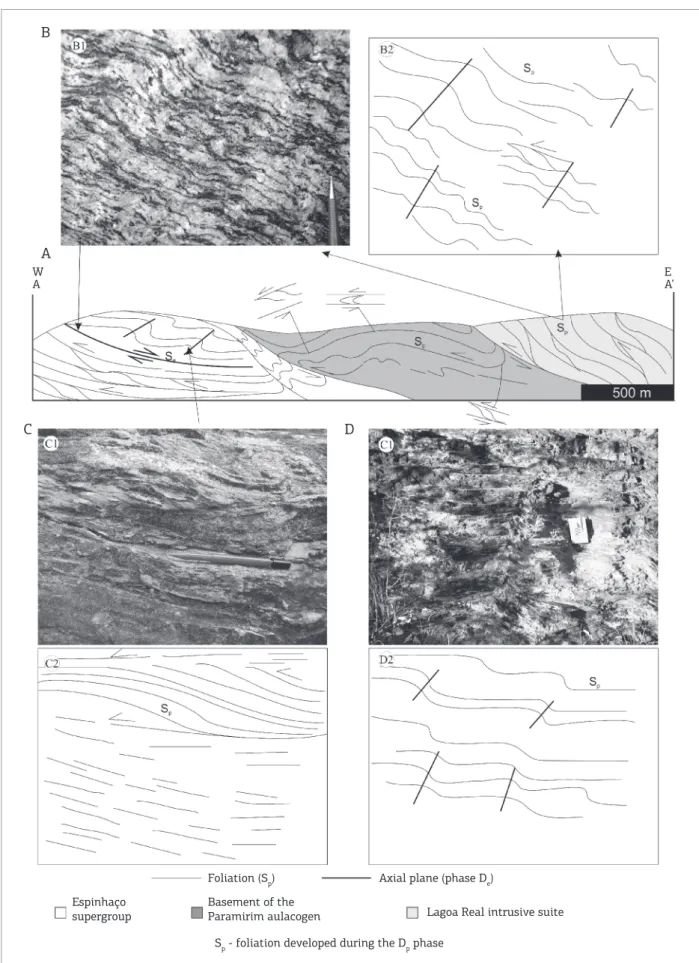
Foliation (Sp)
A
W
A EA’
B
C D
Axial plane (phase De)
Espinhaço supergroup
Sp - foliation developed during the Dp phase
Lagoa Real intrusive suite Basement of the
Paramirim aulacogen
Figure 4. (A) Schematic proile of the structures of the Northern Espinhaço Fold Thrust Belt southwards from the municipality of Caetité. (B, C) Structures of the Dp phase present in the Lagoa Real Intrusive Suite and in the
the reverse shear zones of phase Dp presented tectonic transport towards SW and were responsible for thrust-ing rocks of Lagoa Real Intrusive Suite over rocks from the basement of Paramirim Aulacogen, and then over the
units of the Espinhaço Supergroup (Figs. 3 and 4A-B). hus, a prominent deformation foliation is developed in metasandstones of Espinhaço Supergroup, while S/C struc-tures suggest tectonic transport towards SW (Fig. 4B).
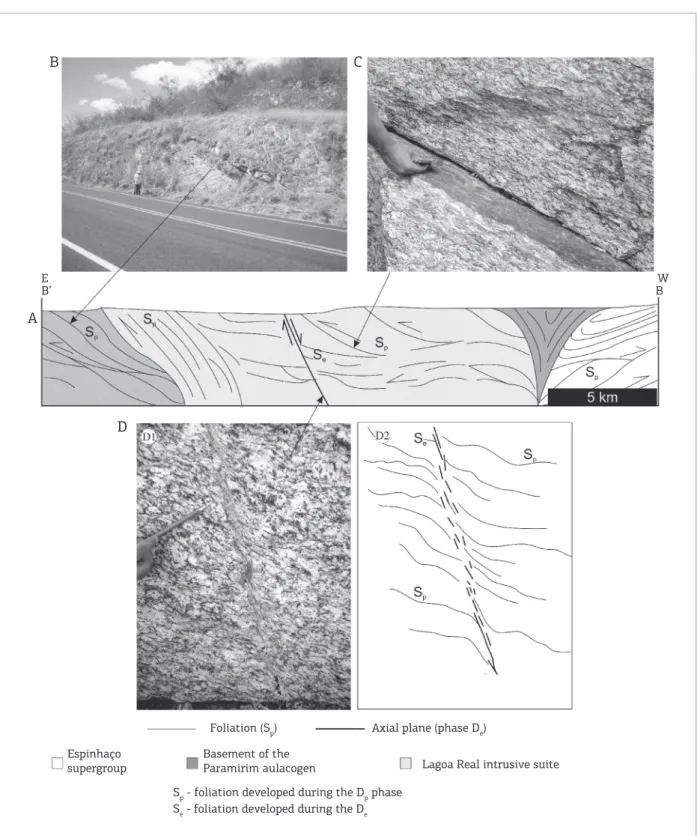
Foliation (Sp)
A
B’
E W
B
B C
D
Axial plane (phase De)
Espinhaço supergroup
Se - foliation developed during the De
Sp - foliation developed during the Dp phase
Lagoa Real intrusive suite Basement of the
Paramirim aulacogen
Figure 5. (A) Geological proile positioned eastwards from the municipality of Caetité (see location in Fig. 3). (B, C) Deformations of phase Dp in the metavolcanossedimentary rocks of the basement of Paramirim Aulacogen and in
Foliation (SP)
A
D
B C
C
W E
C’
Axial plane (phase DE)
Espinhaço Supergroup
SE - foliation developed during the DE SP - foliation developed during the DP phase
Basement of the Paramirim aulacogen (older than 1.8 Ga)
Figure 6. (A) Geological proile positioned southwards from the municipality of Caetité (see location in Fig. 3). (B, C) Intrafolial isoclinal folds and folds from phase Dp in the metavolcanossedimentary sequence of the
basement of the Paramirim Aulacogen. (D) Normal shear zones and negative lower structure from phase De in
the metavolcanossedimentary sequence of the basement of Paramirim Aulacogen.
In this same outcrop, De elements, such as asymmetri-cal kink shear folds, which are moderately inclined (sensu
Fleuty 1964) and with vergence directed towards NE (Fig. 4C-D), fold the Sp foliation. his is opposed to the struc-tural top of phase Dp, which is directed towards SW. Folds
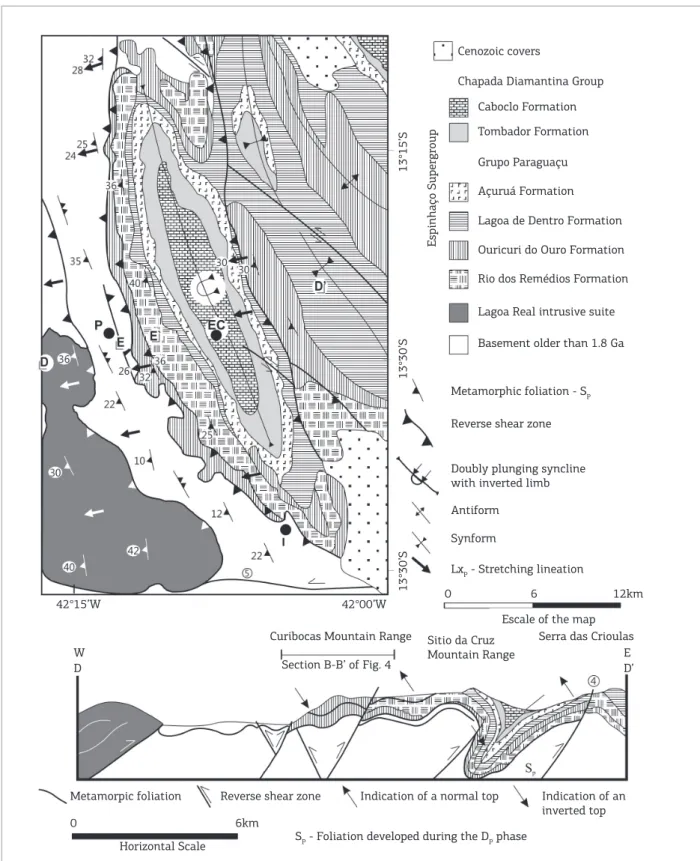
Cenozoic covers
Rio dos Remédios Formation
Basement older than 1.8 Ga
Metamorphic foliation - SP
0 6 12km
Escale of the map Curibocas Mountain Range
Metamorpic foliation Reverse shear zone
6km 0
Horizontal Scale SP - Foliation developed during the DP phase
Indication of a normal top Indication of an
inverted top Sitio da Cruz
Mountain Range
Serra das Crioulas
Section B-B’ of Fig. 4 W
D
E D’ 42°00’W
13°30’S
13°30’S
13°15’S
Espinhaço Supergroup
42°15’W
LxP - Stretching lineation Synform
Antiform
Doubly plunging syncline with inverted limb Reverse shear zone
Lagoa Real intrusive suite Ouricuri do Ouro Formation Lagoa de Dentro Formation Açuruá Formation Grupo Paraguaçu Tombador Formation Caboclo Formation Chapada Diamantina Group
Figure 7. Schematic geological map and proile of the western margin of Chapada Diamantina Fold Thrust Belt in the Paramirim region. Note the position of proiles D-D’ and E-E’. Modiied from Cruz et al. (2007c).
structure in the basement units of the aulacogen (Fig. 6). hese extensional structures truncate shear zones and folds from phase Dp, which were responsible for thrusting the basement units over Espinhaço Supergroup units.
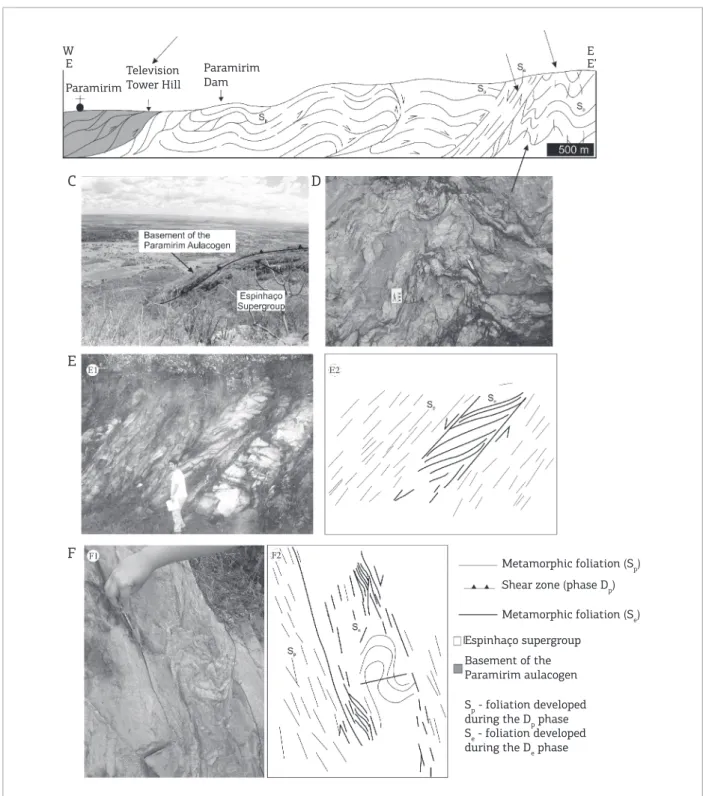
W E
C D
E
F
Paramirim
Television Tower Hill
Paramirim Dam
Metamorphic foliation (Sp)
Espinhaço supergroup
Se - foliation developed
during the De phase Sp - foliation developed during the Dp phase
Basement of the Paramirim aulacogen
Metamorphic foliation (Se) Shear zone (phase Dp)
E E’
Figure 8. (A) Schematic geological proile of the region between Paramirim and Érico Cardoso municipalitiesshowing structures of the Dp phase. (B) Imbricate fans of phase Dp in basement rocks of the Paramirim Aulacogen. (C) Panoramic photo of the shear zone that thrusts the basement units of Paramirim Aulacogen over the rocks of Espinhaço Supergroup. (D) Folds from phase Dp in the rocks of Espinhaço Supergroup. (E) S/C structure in an extensional shear zone developed in the rocks of Espinhaço Supergroup. (F) Refolding developed during De in the rocks of Espinhaço Supergroup.
tectonic transport associated with the compressional structures of phase Dp is towards NE. Moreover, non-coaxial refolding features generating recumbent folds are also seen (Fig. 8F).
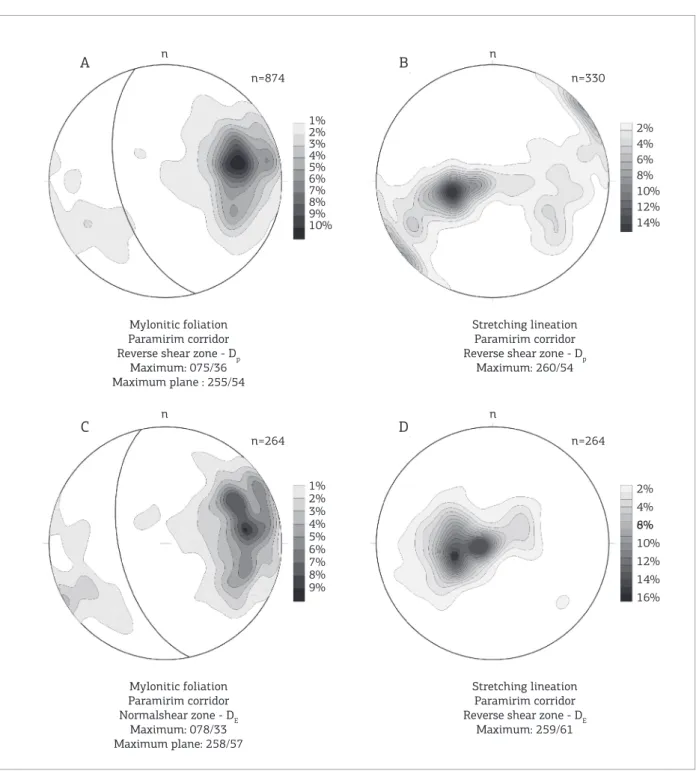
Mylonitic foliation Paramirim corridor Reverse shear zone - Dp
Maximum: 075/36 Maximum plane : 255/54
n
n=874
1%
2% 2%
4% 6% 8% 10% 12% 14% 3%
4% 5% 6% 7% 8% 9% 10%
1%
2% 2%
4% 6% 8% 10% 12% 14% 16% 3%
4% 5% 6% 7% 8% 9%
n=330
n=264 n=264
A B
C D
n
n n
Stretching lineation Paramirim corridor Reverse shear zone - Dp
Maximum: 260/54
Mylonitic foliation Paramirim corridor Normalshear zone - DE
Maximum: 078/33 Maximum plane: 258/57
Stretching lineation Paramirim corridor Reverse shear zone - DE
Maximum: 259/61
Figure 9. Synoptic stereographic diagrams (lower hemisphere) of the mylonitic foliation poles (A, C) and stretching lineation (B, D) of the shear zones of Paramirim Corridor. Values calculated for 1% of the circle area.
Cutting and superposition relationships between Dp and De structures are frequently observed and very clear. Undoubtedly, De ele-ments afect the characteristic ele ele-ments of phase Dp in all situations.
Microstructural analysis
and quartz C-axis fabric analysis
In the De shear zones, quartz, which is the main compo-nent of supracrustal units and is also present in the Lagoa
A
B C
Se - foliation developed during the De phase Sp - foliation developed during the Dp phase
Figure 10. (A) Folds from phase De in the rocks of Lagoa Real suite; (B, C) Quartz veins in normal shear zones. assemblage associated with the extensional shear zones is formed by epidote, muscovite, chlorite, quartz, and calcite.
Tectonite samples generated by granitoid deformation in Lagoa Real Intrusive Suite and located in the normal shear zones of phase De showed a quartz C-axis crystallo-graphic fabric positioned at a high angle with the Se foliation (Fig. 13). he distribution of the maximum values demon-strated that the maximum was at 14° from the Z-axis, thus suggesting that deformation mainly activated the basal glide planes in the <a> direction.
Dynamic meaning of D
estructures
he analysis carried out considering only normal shear zones and faults with small displacement revealed that the active regimen during the De phase varied between radial and rocks of Espinhaço Supergroup is associated with pressure
solution, considering the presence of grains that have been truncated at an angle through the foliation connected to the extensional shear zones (Fig. 12A).
K-feldspar is intensely fractured when found in the fel-sic metavolcanic rocks of Espinhaço Supergroup and in the tectonites of Lagoa Real Intrusive Suite, which were trun-cated by shear zones of phase De. Some domains also pres-ent intense transformation of K-feldspar and amphibolite into white mica (Fig. 12B) and chlorite, respectively, result-ing in the formation of phyllonites. he intensity of hydro-thermal alteration is variable and, in the domains of greater alteration, foliation is developed with variable anastomotic, discontinuous, planar or continuous characteristics (sensu
A B
QUARTZ VEINS PARAMIRIM CORRIDOR
NORMAL SHEAR ZONE - De
n
n=76 n=76
1% 2% 3% 4% 5% 6% 7% 8% 9% n
Figure 11. Stereographic diagrams of planes (A) and polar isodensity of quartz veins (B) lodged in extensional shear zones within the Paramirim Corridor. Lower hemisphere. The contour intervals are equal to 1, 2, 3, 4 and 5% by 1% of area.
pure extensions (Fig. 14). he direction of s1 oscillated near the vertical position, while s3 was sub-horizontally, though N230-050° was the predominating direction (Tab. 2).
Tensile fractures illed by either quartz or calcite may also be used as important indicators for the tectonic history of a region, as suggested by Durney and Ramsay (1973), Beutner and Diegel (1985), and Etchecopar and Malavieille (1987). In their interior, mineral ibers indicate the opening trajectory of the fractures that, in turn, is related to the posi-tion of the inite strain ellipsoid. As shown in the diagram
of Fig. 13, the preferential direction of the veins in the De shear zones occurs as NW-SE. More subordinately, NE-SW orientation is also observed among some veins. his radial distribution is compatible with the obtained regimens.
39
Ar/
40Ar Analysis
In both analyzed samples (SCP 711 and SCP 1351), biotite presented pleochroism, varying from brown to greenish-brown and was lamellar and subidioblastic, with granulation between 0.02 and 0.08 mm. Undulating extinction was strong to moderate.
A B
Figure 12. Deformational fabric in extensional shear zones. (A) Quartz (Qtz) aggregates truncated by Se foliation,
A D
B E
C F
N
Outcrop 1 n=162
Outcrop 3 n=128
σ1:102/78
σ1:076/79
Radial Extensive
Radial Extensive
Radial Extensive
N
N N
N N
Outcrop 4 n=105
Outcrop 5 n=144 Outcrop 2
n=174
Outcrop 6 n=144
σ1:194/87
σ3:053/02
σ2:323/02
Radial Extensive
Pure Extensive
Pure Extensive
σ3:230/07
σ2:321/10
σ3:232/10
σ2:323/04
σ1:171/67
σ3:028/19
σ2:294/13
σ1:159/70
σ3:062/03
σ2:331/20
σ1:140/71
σ3:234/02
σ2:325/19
Figure 14. Paleostress direction diagram using data obtained from the sites presented in Fig. 2 and using the Win-Tensor sotware (Devaulx 2012).
A B C
n=118
X Z
X Z
X Z
n=122 N=128
C-axis of quartz Lagoa real intrusive suite
Normal shear zone Maximum: 013/08 C-axis of quartz
Lagoa real intrusive suite Normal shear zone Maximum: 017/11 C-axis of quartz
Lagoa real intrusive suite Normal shear zone Maximum: 346/06
Figure 13. Stereographic diagrams of the C-axis quartz determined from tectonites of De normal shear zones from
Results obtained for the grains of biotite in samples SCP 711 and SCP 1351 are expressed in the 39Ar/40Ar
dia-grams. hese indicate a weighed age for concordant indi-vidual errors within the experimental errors (1 SD), using ive step-heating processes (B; C; D; E and F) and then six step-heating processes (B; C; D; E; F and G), respectively (Figs. 15A-B; 16A). he plateau ages obtained for sample SCP 711 were 489.4 ± 2.0 and 492.3 ± 1.5 Ma (Figs. 15A-B, respectively), while it was 484.1 ± 1.3 Ma (Fig. 16A) for sample SCP 1351. Still considering sample SCP 1351, but for the ive step-heating processes (B; C; D; E and F), the plateau age was determined as 485.7 ± 1.2 Ma (Fig. 16B).
he softened histogram for age versus probability of the two extracted grains ofers the possible age of system opening. he diagrams built from the analyses performed describe well deined plateaus, which indicate a probable mean age of 491 ± 2 Ma for sample SCP 711 and 484.9 ±
1.9 Ma for SCP 1351 (Figs. 15C and 16C). Coherently, the weighed means (Figs. 15D and 16D) ofer a probable age of 491.3 ± 7.0 Ma for sample SCP 711 and 484.9 ±
5.9 Ma for SCP 1351. Tables 3 and 4 present the analyti-cal geochronologianalyti-cal data obtained from Ar-Ar for samples SCP-711 and SCP 1351, respectively.
DISCUSSION
he Paramirim Aulacogen has an evolution history of complex deformation, with the development of successive phases associated with its formation (Danderfer Filho 2000, Guimarães et al. 2012) and inversion (Cruz & Alkmim 2006, 2007a; Cruz et al. 2007b,c). Southwards from parallel 12° 45’ S, in Lagoa Real Intrusive Suite and in Espinhaço Setentrional and Chapada Diamantina Fold hrust Belts, compressional deformation structures predominate associ-ated with a stress ield oriented WSW-ENE. he collisions
Table 2. Synthesis of the results obtained in the paleostress study using the Win-Tensor sotware and data gathered in ornamented shear fractures.
Station 1 2 3 4 5 6
Coordinate 23 L 780009/8499031 24 L 221668/8509740 23 L 792842/8475607 24 L 233149/8434285 23 L 791509/8431824 24 L 2702208412196
σ1 102/78 076/79 171/67 194/87 140/71 159/70
σ2 321/10 323/04 294/13 323/02 325/18 331/20
σ3 230/07 233/07 025/05 053/01 233/05 062/03
R 0.21 0.03 0.24 0.17 0.37 0.34
Regime Radial
extension
Radial extension
Radial extension
Radial extension
Pure extension
Pure extension
of the Brasília Orogen would have led to the counter-clock-wise rotation of São Francisco-Congo plate, forming the Araçuaí-West Congo Collisional Orogen (Alkmim et al. 2006). he northern extremity of Paramirim Aulacogen presents reactivation and inversion evidence of its exten-sional structures and of a mountain range construction within the intracontinental domain (sensu Cunningham 2005, 2013) of Araçuaí-West Congo Orogen, which is represented through Espinhaço Setentrional and Chapada Diamantina Fold hrust Belts in the Paramirim Corridor. his mountain range was most likely formed as the result of a relex efect related to a regional shortening due to the formation of Western Gondwana (Cruz & Alkmim 2006).
In Araçuaí-West Congo Orogen, the greatest thickening of the crust is believed to have occurred in the southernmost sectors, leading to the development of intense syn- to tar-di-collisional anatexis between 590 and 530 Ma (Pedrosa-Soares et al. 2011), followed by post ones between 530 and 480 Ma. his late granite genesis seems to be associated with post-orogenic gravitational collapse. Marshak et al. (2006) described the structural collection regarding the late extension of this orogen. he set of structures presented in this study, and synthesized in Figure 17, either truncates or reactivates compressional deformation structures in the Paramirim Corridor that were formed during the contion phase of Araçuaí-West Congo Orogen. A strong struc-tural control of the Dp compressional structures over the De extensional ones can be observed in the comparison of modal distribution of these structures.
he regimen acting during phase De varied between radial extension and pure extensions. In the site where a pure exten-sion regimen was seen, the extenpure exten-sion orientation was the same as that interpreted by Alkmim et al. (2006) and Cruz and Alkmim (2006) for the regional shortening, but in the opposite direction.
Negative inversion of compressional structures has been documented in several orogenic domains (Rey et al. 2001, Vanderhaeghe & Teyssier 2001, Israel et al. 2013, Wang et al. 2014, among others). In many situations, they have been attributed to the gravitational collapse that afects systems in more advanced phases of their evolution. In orogenic domains, one of the main factors that contributes to collapse is the lateral variation in the accumulation of potential grav-itational energy (Rey et al. 2001, among others). he efects associated with this extension varied since the develop-ment of faults, in brittle-to-brittle ductile conditions, until the development of partial fusions and metamorphic core complexes, in ductile conditions (Vanderhaeghe & Teyssier 2001). he microstructural analysis conducted in the late extensional shear zones of Paramirim Corridor revealed that,
at a microscale, ductile deformation features predominated in quartz, while brittle fracturing in K-feldspar. he quartz C-axes distribution happens predominantly according to the Z-axis of the inite strain ellipsoid, suggesting the acti-vation of basal planes. Based on the studies by Simpson (1986), FitzGerald and Stünitz (1993) and Okudaira et al. (1995), these characteristics allow the maximum temperature estimation at 550°C for deformation in the studied shear zones. his is compatible with the minimum temperature required for ductile deformations of K-feldspars, i.e. 550ºC (FitzGerald & Stünitz 1993, among others). Microstructural and C-axis data suggest that deformations at De shear zones are ductile-ruptile and were developed under conditions of greenschist facies.
Post-collisional granitoids were found at not only the Araçuaí Orogen, but also southwards from this orogen at the Ribeira Belt, which were interpreted by Valeriano
et al. (2011) as being associated with the orogenic collapse during the Cambrian. hus, considering the Ar-Ar ages of cooling achieved in this study, which varied between 480 and 490 Ma, and the ages obtained by Pedrosa-Soares
A B
C D
Bt 01
Sample SCP - 711
100 8 4 0 8 4 0 12 4 8 0 600 550 500 450 400 350 0.040 530 510 490 470 450 0.020 0.000 1.0 0.8 0.6 0.4 0.2 0.0 0 10
460 470 480 490 500 510 520 530
20 30 40 50 60 70 80 90 100 0 10 20 30 40 50 60 70 80 90 100
50 0 100 600 550 500 450 400 350 50 0 SCP - 711
SCP - 711
SCP - 711
SCP - 711
Age (Ma)
Probability
39 Ar (Mols)
Apperance age (Ma)
%Rad
Ca/K Ca/K
Apperance age (Ma)
Analyzes
Age
%Rad
Integrated Age = 480.8 ± 1.2 Ma
Mean: 491.3 ± 7.0[1.4%] 95% Conf. MSWD = 0.070, probability = 1.00 489.4 ± 2.0 Ma
A A
B C D E F G B C D EF
G H
491 ± 2 490
494.1
492.3 ± 1.5 Ma
Integrated Age = 484.3 ± 0.8 Ma
% Cumulative of 39Ar
% Cumulative of 39Ar
Bt 02
A
C
D
Bt 01
Sample SCP - 1351
0 50 100 15 5 10 0 520 500 480 440 460 420 400 0.040 530 510 490 470 450 410 0.020 0.000 1.8 1.6 0.8 0.6 0.4 0.2 0.0 0 10
460 470 480 490 500 510 520 530
20 30 40 50 60 70 80 90 100 540
SCP - 1351
SCP - 1351
SCP - 1351
Age (Ma)
Probability
39 Ar (Mols)
Apperance age (Ma)
Analyzes
Age
Integrated Age = 482.3 ± 0.9 Ma
Mean: 484.9 ± 5.9 [1.2%] 95% Conf. MSWD = 0.054, probability = 1.00 484.1 ± 1.3 Ma
A
B C D E F G
H
484.9 ± 1.9 485.9 % Cumulative of 39Ar
1.0 1.2 1.4
430
B Bt 02
0 50 100 520 500 480 440 460 420 400
0 10 20 30 40 50 60 70 80 90 100
540
SCP - 1351
Apperance age (Ma)
Integrated Age = 481.7 ± 0.9 Ma 485.7 ± 1.2 Ma
A
B C D
E F
G
% Cumulative of 39Ar
Figure 16. Results of the Ar-Ar analyses for sample SCP-1351.
et al. (2011) and Valeriano et al. (2011), for post-colli-sional granitoids crystallization in the Araçuaí-West Congo Orogen and in the Ribeira Belt, respectively, evidence sug-gest that by the end of the Cambrian, the crustal thicken-ing generated by the collisions linked to the formation of Western Gondwana was followed by a regional extension that spread to the continental domains, i.e. to Paramirim Corridor (Fig. 18). Hence, the temperature associated with the formation of the extensional shear zones and with metamorphism, would have progressively decreased southwards, after the development of an extensive anatexis, directed northwards, and the formation of brittle-ductile to ductile-brittle normal shear zones.
CONCLUSIONS
Although compressional structures associated with the inversion of Paramirim Aulacogen, which occurred in the Ediacaran, predominate in the Paramirim Corridor, normal
shear zones with a rich array of structures can be described reactivating the compressional structures. In these zones, the movement indicators are S/C structures, while a down dip mineral stretching lineation can also be identiied. he struc-tural framework that was surveyed demonstrated a strong control over past structures in the nucleation of the exten-sional shear zones, which rotated the nucleated elements in the compressional phase.
he microstructural analysis demonstrated features that suggest the presence of processes involving the plastic defor-mation and dissolution by quartz pressure, as well as brit-tle fracturing of K-feldspar and intense transformation of K-feldspar and amphibolite into white mica and chlorite, respectively. he quartz C-axis distribution and the defor-mation processes might show metamorphic conditions with temperatures below 550°C.
N Power 40Ar* 40Ar ± σ40 39Ar ± σ39 38Ar ± σ38 37Ar ± σ37 36Ar
(W) (moles) (10-9A) (10-9A) (10-9A) (10-9A) (10-9A) (10-9A) (10-9A) (10-12A) (10-13A)
01A - 0.2 1.7E-14 0.888607 0.000731 0.010484 0.000035 0.000167 0.000006 0.000030 0.000012 0.000061
01B - 0.2 1.7E-14 0.875089 0.000561 0.009576 0.000043 0.000149 0.000011 0.000016 0.000010 0.000018
01C - 0.3 1.8E-14 0.954989 0.000461 0.010328 0.000049 0.000155 0.000006 0.000022 0.000008 0.000042
01D - 0.5 1.2E-14 0.614583 0.000491 0.006700 0.000068 0.000096 0.000006 0.000007 0.000011 0.000018
01E - 0.6 6.3E-15 0.328489 0.000282 0.003570 0.000029 0.000071 0.000007 0.000038 0.000011 0.000021
01F - 0.8 8.3E-15 0.438005 0.000352 0.004685 0.000036 0.000073 0.000010 0.000014 0.000008 0.000020
01G - 1.2 2.9E-15 0.151701 0.000163 0.001648 0.000027 0.000002 0.000009 -0.000001 0.000012 -0.000014
01H - 2.8 1.9E-15 0.097732 0.000114 0.001093 0.000014 0.000040 0.000006 0.000016 0.000011 0.000015
Σ 8.3E-14
Plateau Age (steps B; C; D; E e F)
02A - 0.2 2.7E-14 1.426779 0.000711 0.016779 0.000055 0.000224 0.000014 -0.000033 0.000006 0.000006
02B - 0.2 2.9E-14 1.529240 0.001000 0.016814 0.000037 0.000192 0.000014 -0.000035 0.000007 -0.000014
02C - 0.3 3.4E-14 1.773626 0.002000 0.019166 0.000059 0.000247 0.000011 -0.000011 0.000007 0.000018
02D - 0.5 3.0E-14 1.567509 0.000950 0.017051 0.000061 0.000232 0.000015 0.000013 0.000009 0.000002
02E - 0.7 8.7E-15 0.457902 0.000581 0.005072 0.000045 0.000073 0.000010 -0.000010 0.000006 -0.000005
02F - 1.2 3.7E-15 0.194401 0.000163 0.002229 0.000028 0.000002 0.000012 -0.000038 0.000011 -0.000034
02G - 3.2 5.3E-15 0.276311 0.000252 0.003328 0.000031 0.000049 0.000010 -0.000009 0.000010 0.000001
Σ 1.4E-13
Plateau Age (steps B; C; D; E e F)
Standart :
FCs Lab # : GR-006 Age: 28.02 Ma D1 : 1.0064 ± 0.0025 HEATING: 11 S
Irradiation coordinates: x=0.53 cm; y=0.85 cm; z=0.31 cm
Explanatios
D1: Mass discrimination per AMU based on pawer law
Δt2: Time interval (days) between end of irradiation and beginning of analysis Blank Type3. Ave=average; LR=linear regression versus time
Constant used
Atmospheric argon ratios Surces
(40Ar/39Ar)A 296 ± 0.74 Nier (1950)
(38Ar/36Ar)A 0.188 ± 0.0001 Nier (1950)
Interferig isotope production ratios
(40Ar/39Ar)K 0.0007 ± 0.00005 Renne et al. (2009)
(38Ar/39Ar)K (1.22 ± 0.00)E-02 Renne et al. (2005)
(37Ar/39Ar)K (2.24 ± 0.16)E-04 Renne et al. (2005)
(39Ar/37Ar)Ca 0.000662 ± 0.0000047 Renne et al. (2009)
(38Ar/37Ar)Ca (1.96 ± 0.08)E-05 Renne et al. (2005)
(36Ar/37Ar)Ca 0.000262 ± 0.000003 Renne et al. (2009)
(36Cl/38Cl)Cl 263 ± 2
Decay Constants
40K λe (5.81 ± 0.00)E-11 a-1 Steiger and Jäger (1977) 40K λβ (2.58 ± 0.03)E-03 a-1 Steiger and Jäger (1977)
39K (2.58 ± 0.03)E-03 a-1 Stonner et al. (1965)
37Ar (5.4300 ± 0.0063)E-02 a-1 Renne and Norman (2001)
36Cl4 λβ (2.35 40K ± 0.02)E-06 a-1 Endt (1998)
Table 3. Analytical data for sample SCP-711 in Lagoa Real Intrusive Suite. UTM coordinates (Córrego Alegre Datum): 23 L, 794148/8508976.
N Power ± σ36 %40Ar* 40Ar*/ ± σ 40Ar* 40Ar* Age ± σ
(W) (10-14A) 39Ark Cumulative % Cumulative (Ma) (Ma)
01A - 0.2 0.000005 2.0E+01 83.39909 0.35571 1.7E-14 2.0E+01 450.8 1.7
01B - 0.2 0.000005 2.0E+01 91.16364 0.46528 3.4E-14 4.1E+01 487.6 2.2
01C - 0.3 0.000006 2.2E+01 91.62115 0.48997 5.2E-14 6.2E+01 489.7 2.3
01D - 0.5 0.000005 1.4E+01 91.24931 0.98370 6.3E-14 7.7E+01 488.0 4.6
01E - 0.6 0.000006 7.6E+00 90.88746 0.90834 7.0E-14 8.4E+01 486.3 4.3
01F - 0.8 0.000006 1.0E+01 92.65694 0.82524 7.8E-14 9.4E+01 494.6 3.9
01G - 1.2 0.000006 3.5E+00 94.80014 1.89882 8.1E-14 9.8E+01 504.6 8.8
01H - 2.8 0.000006 2.2E+00 86.29737 1.96132 8.3E-14 1.0E+02 464.7 9.3
Plateau Age (steps B; C; D; E e F)
02A - 0.2 0.000005 2.0E+01 85.44078 0.33266 2.7E-14 2.0E+01 460.6 1.6
02B - 0.2 0.000005 2.1E+01 91.71756 0.27523 5.6E-14 4.1E+01 490.2 1.3
02C - 0.3 0.000006 2.5E+01 92.81429 0.35111 9.0E-14 6.5E+01 495.3 1.7
02D - 0.5 0.000005 2.2E+01 92.46394 0.37857 1.2E-13 8.7E+01 493.7 1.8
02E - 0.7 0.000005 6.3E+00 91.08495 0.87519 1.3E-13 9.4E+01 487.2 4.1
02F - 1.2 0.000005 2.7E+00 92.04704 1.32553 1.3E-13 9.6E+01 491.7 6.2
02G - 3.2 0.000006 3.8E+00 83.45596 0.93332 1.4E-13 1.0E+02 451.1 4.5
Plateau Age (steps B; C; D; E e F)
Standart : FCs
Explanatios
D1: Mass discrimination per AMU based on pawer law
Δt2: Time interval (days) between end of irradiation and beginning of analysis Blank Type3. Ave=average; LR=linear regression versus time
Constant used
Atmospheric argon ratios
(40Ar/39Ar)A
(38Ar/36Ar)A
Interferig isotope production ratios
(40Ar/39Ar)K
(38Ar/39Ar)K
(37Ar/39Ar)K
(39Ar/37Ar)Ca
(38Ar/37Ar)Ca
(36Ar/37Ar)Ca
(36Cl/38Cl)Cl
Decay Constants
40K λe
40K λβ
39K
37Ar
36Cl4 λβ
N Power 40Ar* 40Ar ± σ40 39Ar ± σ39 38Ar ± σ38 37Ar ± σ37 36Ar
(W) (moles) (10-9A) (10-9A) (10-9A) (10-9A) (10-9A) (10-9A) (10-9A) (10-12A) (10-13A)
01A - 0.2 2.4E-14 1.277534 0.000840 0.014522 0.000070 0.000165 0.000007 -0.000039 0.000010 0.000012
01B - 0.2 2.2E-14 1.157440 0.000681 0.012804 0.000048 0.000149 0.000006 -0.000034 0.000009 0.000003
01C - 0.3 2.9E-14 1.554251 0.000830 0.017340 0.000050 0.000202 0.000007 -0.000010 0.000010 0.000009
01D - 0.5 2.6E-14 1.355744 0.000761 0.014999 0.000055 0.000150 0.000007 -0.000013 0.000009 -0.000008
01E - 0.6 1.2E-14 0.631469 0.000651 0.006975 0.000037 0.000065 0.000007 -0.000036 0.000008 -0.000009
01F - 0.8 1.5E-14 0.775932 0.000651 0.008568 0.000057 0.000088 0.000007 -0.000002 0.000009 0.000010
01G - 1.2 7.7E-15 0.407224 0.000371 0.004530 0.000028 0.000036 0.000007 -0.000023 0.000011 -0.000007
01H - 2.8 1.3E-15 0.072098 0.000391 0.000768 0.000032 0.000016 0.000009 0.000001 0.000009 0.000010
Σ 1.4E-13
Plateau Age (steps B: C; D; E; F e G):
02A - 0.1 1.5E-14 0.798383 0.000631 0.009152 0.000041 0.000145 0.000006 0.000014 0.000019 0.000061
02B - 0.2 3.5E-14 1.822626 0.001001 0.020093 0.000053 0.000247 0.000007 0.000010 0.000012 0.000017
02C - 0.3 2.3E-14 1.230268 0.000621 0.013574 0.000041 0.000188 0.000007 0.000004 0.000012 0.000021
02D - 0.5 2.8E-14 1.486212 0.000741 0.016448 0.000057 0.000209 0.000008 -0.000005 0.000010 0.000015
02E - 0.7 8.3E-15 0.435802 0.000421 0.004816 0.000057 0.000102 0.000010 0.000021 0.000015 0.000030
02F - 1.1 2.0E-15 0.103051 0.000154 0.001131 0.000019 0.000036 0.000009 -0.000002 0.000010 0.000012
02G - 3.0 8.8E-16 0.046742 0.000089 0.000539 0.000015 0.000005 0.000014 -0.000008 0.000009 0.000009
Σ 1.1E-13
Plateau Age (steps B; C; D; E e F):
Standart : FCs Lab # : GR-006 Age: 28.02 Ma D1 : 1.0064 ± 0.0025 HEATING: 11 S
Irradiation coordinates: x=0.53 cm; y=0.85 cm; z=0.31 cm
Explanatios
D1: Mass discrimination per AMU based on pawer law
Δt2: Time interval (days) between end of irradiation and beginning of analysis
Blank Type3. Ave=average; LR=linear regression versus time
Constant used
Atmospheric argon ratios Surces
(40Ar/39Ar)A 296 ± 0.74 Nier (1950)
(38Ar/36Ar)A 0.188 ± 0.0001 Nier (1950)
Interferig isotope production ratios
(40Ar/39Ar)K 0.0007 ± 0.00005 Renne et al. (2009)
(38Ar/39Ar)K (1.22 ± 0.00)E-02 Renne et al. (2005)
(37Ar/39Ar)K (2.24 ± 0.16)E-04 Renne et al. (2005)
(39Ar/37Ar)Ca 0.000662 ± 0.0000047 Renne et al. (2009)
(38Ar/37Ar)Ca (1.96 ± 0.08)E-05 Renne et al. (2005)
(36Ar/37Ar)Ca 0.000262 ± 0.000003 Renne et al. (2009)
(36Cl/38Cl)Cl 263 ± 2
Decay Constants
40K λe (5.81 ± 0.00)E-11 a-1 Steiger and Jäger (1977) 40K λβ (2.58 ± 0.03)E-03 a-1 Steiger and Jäger (1977)
39K (2.58 ± 0.03)E-03 a-1 Stonner et al. (1965)
37Ar (5.4300 ± 0.0063)E-02 a-1 Renne and Norman (2001)
36Cl4 λβ (2.35 40K ± 0.02)E-06 a-1 Endt (1998)
Table 4. Analytical data for sample SCP-1351 in the basement of the Paramirim Corridor. UTM coordinates (Córrego Alegre Datum): 24 L, 252896/8339686.
Table 4. Continuation.
N Power ± σ36 %40Ar* 40Ar*/ ± σ 40Ar* 40Ar* Age ± σ
(W) (10-14A) 39Ark Cumulative % Cumulative (Ma) (Ma)
01A - 0.2 0.000006 1.8E+01 88.00687 0.46785 2.4E-14 1.8E+01 472.7 2.2
01B - 0.2 0.000006 1.6E+01 90.61531 0.39749 4.6E-14 3.4E+01 485.0 1.9
01C - 0.3 0.000005 2.1E+01 89.75033 0.31172 7.6E-14 5.5E+01 481.0 1.5
01D - 0.5 0.000005 1.9E+01 90.81448 0.38093 1.0E-13 7.4E+01 486.0 1.8
01E - 0.6 0.000005 8.8E+00 91.18965 0.55434 1.1E-13 8.3E+01 487.7 2.6
01F - 0.8 0.000006 1.1E+01 90.48872 0.65784 1.3E-13 9.3E+01 484.4 3.1
01G - 1.2 0.000006 5.6E+00 90.62318 0.68158 1.4E-13 9.9E+01 485.1 3.2
01H - 2.8 0.000005 9.6E-01 90.51482 4.38713 1.4E-13 1.0E+02 484.6 20.6
Plateau Age (steps B: C; D; E; F e G):
02A - 0.1 0.000006 1.4E+01 85.88734 0.47223 1.5E-14 1.4E+01 462.7 2.3
02B - 0.2 0.000006 3.1E+01 91.01627 0.30332 5.0E-14 4.4E+01 486.9 1.5
02C - 0.3 0.000005 2.1E+01 90.72214 0.33803 7.3E-14 6.5E+01 485.5 1.6
02D - 0.5 0.000005 2.5E+01 90.63126 0.36414 1.0E-13 9.0E+01 485.1 1.7
02E - 0.7 0.000005 7.4E+00 89.35449 1.13830 1.1E-13 9.7E+01 479.1 5.4
02F - 1.1 0.000006 1.7E+00 88.68401 2.13793 1.1E-13 9.9E+01 475.9 10.1
02G - 3.0 0.000005 7.9E-01 82.46083 3.46516 1.1E-13 1.0E+02 446.3 16.6
Plateau Age (steps B; C; D; E e F):
Standart : FCs
Irradiation coordinates: x=0.53 cm; y=0.85 cm; z=0.31 cm
Explanatios
D1: Mass discrimination per AMU based on pawer law
Δt2: Time interval (days) between end of irradiation and beginning of analysis
Blank Type3. Ave=average; LR=linear regression versus time
Constant used
Atmospheric argon ratios
(40Ar/39Ar)A
(38Ar/36Ar)A
Interferig isotope production ratios
(40Ar/39Ar)K
(38Ar/39Ar)K
(37Ar/39Ar)K
(39Ar/37Ar)Ca
(38Ar/37Ar)Ca
(36Ar/37Ar)Ca
(36Cl/38Cl)Cl
Decay Constants
40K λe 40K λβ
39K
37Ar
The field relations and the ages obtained suggest that the set of extensional structures described in the pres-ent study may be associated with the gravitational col-lapse of the Araçuaí-West Congo Orogen and, region-ally, may represent the most distal and coldest sector of this collapse.
ACKNOWLEDGEMENTS
he authors would like to express their gratitude to the Companhia de Pesquisa de Recursos Minerais (CPRM), the Companhia Baiana de Pesquisa Mineral (CBPM), and the Graduation Program of Universidade Federal da Bahia for their support towards the research. In addition, they are thankful for the Brazilian National Counsel of Technological and Scientiic Development (CNPq) for the Fellowship Grant (Processes 307590/2009-7 and 306744/2012-0) given to Simone C. P. Cruz and for the Universal Project Call (Process 473806/2010-0). hey also thank doctor Damien Delvaux of the Royal Museum for Central Africa, Tervuren, Belgium, for making the Win-Tensor software freely available. In addition, they also would like to thank sincerely the anonymous reviewer for the important contributions to improve the quality of the manuscript.
σ3
Shear sense Quartz veins Direction of the stress
σ3
σ1
Figure 17. Schematic model for the De extensional structures and interpretation of paleostress. (A) Normal shear
zones with quartz veins. (B) Asymmetrical folds and quartz veins. (C) Crenulation cleavage. (D) Fold propagation fault. (E) Recumbent folds.
Paraty
Vitória
Orogenic Collapse Domain Atlantic Ocean22°s
14°s
Alkmim F.F., Brito Neves B.B., Alves J.A.C. 1993. Arcabouço tectônico do Cráton do São Francisco – uma revisão. In: Dominguez J.M. & Misi A. (eds.) O cráton do São Francisco. Reunião preparatória do II Simpósio sobre o cráton do São Francisco. Salvador, SBG/ Núcleo BA/ SE/SGM/CNPq, p. 45-62.
Alkmim F.F., Marshak S., Pedrosa-Soares A.C., Peres G.G., Cruz S.C.P., Whittington A. 2006. Kinematic evolution of the Aracuaí-West Congo orogen in Brazil and Africa: Nutcracker tectonics during the Neoproterozoic assembly of Gondwana. Precambrian Research,
149:43-64.
Allmendinger R.W., Sharp J.W., Von Tish D., Serpa L., Brown L., Kaufmans S., Olivier J., Smith R.B. 1983. Cenozoic and Mesozoic structures of the Eastern Basin and range Province, Utah, from
COCORP seismic relection data. Geology, 11:532-536.
Babinsky M., Pedrosa-Soares A.C., Trindade R.I.F., Martins M.C.M., Noce L.D. 2011. Neoproterozoic glacial deposits from the Araçuaí orogen, Brazil: Age, provenance and correlations with the São Francisco craton and West Congo belt. Gondwana Research, 2(3):1-15.
Bastos Leal L.R., Teixeira W., Cunha J.C., Leal A.B.M., Macambira M.J.B., Rosa M.L.S. 2000. Isotopic signatures of paleoproterozoic granitoids of the Gavião block and implications for the evolution of the São Francisco craton, Bahia, Brazil. Revista Brasileira de Geociências, 30:66-69.
Bastos Leal L.R., Teixeira W., Cunha J.C., Macambira M.J.B. 1998. Archean tonalitic-trondhjemitic and granitic plutonism in the Gavião block, São Francisco Craton, Bahia, Brazil: Geochemical and geochronology characteristics. Revista Brasileira de Geociências,
2:209-220.
Beutner E.C. & Diegel F.A. 1985. Determination of folds kinematics
from syntectonics ibres in pressure shadows, Martinsburg Slates,
New Jersey. American Journal of Science, 285:16-50.
Borge J.O., Cruz S.C.P., Barbosa J.S.F. 2015. Structural framework of the the Lagoa D’Anta mine area, iron-manganese Urandi-Caetité-Licínio de Almeida District, Bahia, Brasil. Brazilian Journal of Geology. In press.
Burke K. & Dewey J.F. 1973. Plume-generated triple junctions: key indicators in applying plate tectonics to old rocks. Journal of Geology,
81:406-433.
Burke K. & Whiteman A.J. 1973. Uplit, riting and the
break-up of Africa. In: Tarling D.H. & Runcorn S.K. (eds.) Implications of
continental drit to the Earth Sciences. London, Academy Press, p. 735-755.
Butler R., Tavarnelli E., Grasso M. 2006. Tectonic inversion and structural inheritance in mountain belts. Journal of Structural Geology, 28(11):1891-1892.
Charrier R., Baeza O., Elgueta S., Flynn J.J., Gans P., Kay S.M., Muñoz N., Zurita E. 2002. Evidence for Cenozoic extensional basin development
and tectonic inversion south of the lat-slab segment, southern
Central Andes, Chile (33°–36°S.L.). Journal of South American Earth Sciences, 15(1):117-139.
Chemale-Júnior F., Dussin I.A., Alkmim F.F., Martins M.S., Queiroga G., Armstrong R., Santos M.N. 2012. Unravelling a Proterozoic basin history through detrital zircon geochronology: the case of the Espinhaço Supergroup, Minas Gerais Brazil. Gondwana Research,
22:200-206.
Cordani U.G., Iyer S.S., Taylor P.N., Kawashita K., Sato K., Mcreath I. 1992. Pb-Pb, Rb-Sr, and K-Ar sistematic of the Lagoa Real uranium province (south-central Bahia, Brazil) and the Espinhaço Cycle (ca. 1.5-1.0 Ga). Journal of South American Earth Sciences, 1:33-46.
REFERENCES
Cruz S.C.P. 2004. A interação tectônica entre o Aulacógeno do Paramirim e o Orógeno Araçuaí-Oeste Congo. Tese de Doutorado, Universidade Federal de Ouro Preto, Ouro Preto, 505 p.
Cruz S.C.P. & Alkmim F.F. 2006. The tectonic interaction between the Paramirim Aulacogen and the Araçuaí Belt, São Francisco Craton region, Easter Brazil. Anais da Academia Brasileira de Ciências,
1:151-173.
Cruz S.C.P. & Alkmim F.F. 2007a. A história de inversão do aulacógeno do Paramirim contada pela sinclinal de Ituaçu, extremo sul da Chapada Diamantina (BA). Revista Brasileira de Geociências,
37:92-110.
Cruz S.C.P., Alkmim F.F., Leite C.M.M., Evangelista H.J., Cunha J.C., Matos E.C., Noce C.M., Marinho M.M. 2007b. Geologia e arcabouço estrutural do Complexo Lagoa Real, Vale do Paramirim, Centro-Oeste da Bahia. Revista Brasileira de Geociências, 37:28-146.
Cruz S.C.P., Dias V.M., Alkmim F.F. 2007c. A interação tectônica embasamento/cobertura em aulacógenos invertidos: um exemplo da Chapada Diamantina Ocidental. Revista Brasileira de Geociências,
37:111-127.
Cruz S.C.P., Alkmim F.F., Pedreira A., Teixeira L., Pedrosa-Soares A.C., Gomes L.C.C., Souza J.S., Leal A.B.M. 2012. O Orógeno Araçuaí. In: Barbosa J.S.F., Mascarenhas J.F., Corrêa-Gomes L.C., Domingues J.M.L, Oliveira, J.S.S. (eds.) Geologia da Bahia. Pesquisa e Atualização de Dados. Salvador, CBPM, 2, p.131-178.
Cunningham D. 2005. Active intracontinental transpressional
mountain building in the Mongolian Altai: deining a new class of
orogen. Earth and Planetary Science Letters, 240:436-444.
Cunningham D. 2013. Mountain building processes in intracontinental oblique deformation belts: lessons from the Gobi Corridor, Central Asia. Journal of Structural Geology, 46:255-282.
Danderfer Filho A. 2000. Geologia sedimentar e evolução tectônica do Espinhaço Setentrional, estado da Bahia. Tese de Doutoramento, Instituto de Geociências, Universidade Federal de Brasília, Brasília, 497 p.
Danderfer Filho A., DeWaele B., Pedreira A., Nalini H.A. 2009. New geochronological constraints on the geological evolution of Espinhaço basin within the São Francisco Craton – Brazil. Precambrian Research, 170:116-128.
Delvaux D. 2012. Release of program Win-Tensor 4.0 for tectonic stress inversion: statistical expression of stress parameters. EGU General Assembly, Vienna, 2012. Geophysical Research Abstracts, v. 14, EGU2012-5899.
Dewey J.F. & Burke K. 1974. Hot Spot and continental break-up: implications for collisional orogeny. Geology, 2:57-60.
Dhahri F. & Boukadi N. 2010. The evolution of pre-existing structures during the tectonic inversion process of the Atlas chain of Tunisia. Journal of African Earth Sciences, 56:139-149.
Durney D.W. & Ramsay J.G. 1973. Incremental strain measured by syntectonic crystals growts. In: De Jong K.A. & Scholten R. (eds.) Gravity and tectonics. Wiley, New York, p. 67-39.
Endt P.M. 1998. Supplement of energy levels of A=44 nuclei (VII). Nuclear Physics, A633:1-220.
Etchecopar A. & Malavieille J. 1987. Computer models of pressure shadows: a method for strain measurement and shear sense determination. Journal of Structural Geology, 9:667-677.
Faccenna C., Nalpas T., Brum J.P., Davy P. 1995. The inluence of
Fettes D. & Desmons J. 2007. Metamorphic rocks: a classiication
and glossary of terms: recommendations of the International Union of Geological Sciences Sub-commission on the Systematics of Metamorphic Rocks. Cambridge, Cambridge University Press, 244 p.
FitzGerald J.D. & Stünitz H. 1993. Deformation of granitoids at low metamorphic grade I: Reactions and grain size reduction. Tectonophysics, 221:269-297.
Fleuty M.J. 1964. The descriptions of folds. Proceedings of the Geologists’ Association, 75:461-492.
Guadagnin F., Chemale Jr. F., Magalhães A.J.C., Santana A., Dussin I.,
Takehara L. 2015. Age constraints on crystal-tuf from the Espinhaço
Supergroup – Insight into the Paleoproterozoic to Mesoproterozoic intracratonic basin cycles of the Congo-São Francisco Craton. Gondwana Research, 27:363-376.
Guimarães J.T., Teixeira L.R., Silva M.G. Martins A.A.M., Filho E.L.A., Loureiro H.S.C., Arcanjo J.B., Dalton de Souza J., Neves J.P., Mascarenhas J.F., Melo R.C., Bento R.V. 2005. Datações U/Pb em
rochas magmáticas intrusivas no Complexo Paramirim e no Rite
Espinhaço: uma contribuição ao estudo da Evolução Geocronológica da Chapada Diamantina. In: SBG/BA-SE, Simpósio do Cráton do São Francisco, 3, Anais de Resumos Expandidos, p. 159-161.
Guimarães J.T., Alkmim F.F., Cruz S.C.P. 2012. Supergrupos Espinhaço e São Francisco. In: Barbosa J.S.F., Mascarenhas J.F.M., Corrêa-Gomes L.C., Domingues J.M.L. (eds.) Geologia da Bahia. Pesquisa e Atualização de Dados, Salvador, CBPM, 2, p. 33-86.
Hofman P.F., Dewey J.F., Burke K. 1974. Aulacogens and their
genetic relation to geosynclines with a Proterozoic example from Great Slave Lake, Canada: In: Dott R.H. & Siever R.H. (eds.) Modern and Ancient Geosynclinal Sedimentation. Tulsa Society of Economic Paleontologists and Mineralogists, Special Publication, 19, p. 38-55.
Israel S.A., Kennedy L.A., Friedman R.M. 2013. Strain partitioning in
accretionary orogens, and its efects on orogenic collapse: Insights
from western North America. Bulletin of the Geological Society of America, 125:1260-1281.
Jardim de Sá E.F., Bartels R.L., Brito-Neves B.B., McReath I. 1976. Geocronologia e o modelo tectonomagmático da Chapada Diamantina e do Espinhaço Setentrional, Bahia. In: SBG, Congresso Brasileiro de Geologia, 29, Anais, p. 205-227.
Jolivet L., Daniel J.M., Fournier M. 1991. Geometry and kinematics of the Alpine Corsica. Earth and Planetary Science Letters,
104:278-291.
Lagoeiro L.E. 1990. Estudo das deformações nas seqüências carbonáticas do Grupo Una na região de Irecê, BA. Dissertação de Mestrado, Departamento de Geologia, Universidade Federal de Ouro Preto, Ouro Preto, 150 p.
Letouzey J. 1990. Fault reactivation, inversion and fold-thrust belt. In: Letouzey J. (ed.) Petroleum and Tectonic Mobile Belts. Editions Technip, Paris, p. 101-128.
Marshak S., Alkmim F.F., Whittington A., Pedrosa-Soares A.C. 2006. Extensional collapse in the Neoproterozoic Aracuaí Orogen, eastern Brazil: a setting for reactivation of asymmetric crenulation cleavage. Journal of Structural Geology, 28:129-147.
McDougall I. & Harrison T.M. 1999. Geochronology and Thermochronology by the 40Ar/ 39Ar Method. Oxford, Oxford University Press, 269 p.
Misi A., Kaufman A.J., Azmy K., Dardenne M.A., Sial A.N., Oliveira T.F. 2011. Neoproterozoic successions of the São Francisco Craton, Brazil: the Bambuí, Una, Vazante and Vaza Barris/Miaba groups and their glaciogenic deposits. Geological Society of London (Memoirs),
36:509-522.
Nier A.D. 1950. A determination of the relative abundance of the isotopes of carbon, nitrogen, oxygen, argon, and potassium. Physical Reviews, 77:789-783.
Okudaira T., Takechita T., Hara I., Ando J. 1995. A new estimate of the conditions for transition from basal <a> to prism [c] slip in naturally deformed quartz. Tectonophysics, 250:31-46.
Passchier C.W. & Trouw R.A.J. 2005. Microtectonics. Berlin, Edition Springer, 366 p.
Pedrosa-Soares A. & Alkmim F.F. 2011. How many riting events
preceded the development of the Araçuaí-West Congo orogen? Geonomos, 2:244-251.
Pedrosa-Soares A.C., Noce C.M., Wiedemann C.M., Pinto C.P. 2001.
The Araçuaí-West-Congo Orogen in Brazil: an overview of a conined
orogen formed during Gondwanaland assembly. Precambrian Research, 1-4:307-323.
Pedrosa-Soares A.C., De Campos C.P., Noce C., Silva L.C., Novo T., Roncato R., Medeiros S., Castañeda C., Queiroga G., Dantas E., Dussin I., Alkmim F. 2011. Late Neoproterozoic–Cambrian granitic magmatism in the Araçuaí orogen (Brazil), the Eastern Brazilian Pegmatite Province and related mineral resources. Geological Society, 350:25-51.
Pimentel M.M., Machado N., Lobato L.M. 1994. Geocronologia U/ Pb de rochas graníticas e gnáissicas da região de Lagoa Real, Bahia, e implicações para a idade da mineralização de urânio. In: SBG, Congresso Brasileiro de Geologia, 38, Boletim de Resumos Expandidos, p. 389-390.
Poirier J.P. & Guillopé M. 1979. Deformation induced recrystallization of minerals. Bulletin of Mineralogy, 102:67-74.
Renne P.R. & Norman E.B. 2001. Determination of the half-life of 37Ar by mass spectrometry. Physical Review, C63:1-3.
Renne R.P., Deino A.L., Hames W.E., Heizler M.T., Hemming S.R., Hodges K.V., Koppers A.A.P., Mark D.F., Morgan L.E., Phillips D., Singer B.S., Turrin B.D., Villa I.M., Villeneuve M., Wijbrans J.R. 2009. Data reporting norms for 40Ar /39Ar geochronology. Quaternary Geochronology, 45:346-352.
Renne P.R., Knight K.B., Nomade S., Leunoy K.N., Lou T.P. 2005.
Application of deuteron-deuteron (D-D) ission nêutrons 40Ar/39Ar geochronology. Applied Radiation and Isotopes, 62:25-32.
Rey P., Vanderhaeghe O., Teyssier C. 2001. Gravitational collapse of
the continental crust: deinition, regimes and modes. Tectonophysics,
342:435-449.
Santos-Pinto M.A.S., Peucat J.J., Martin H., Sabaté P., 1998. Recycling of the Archaean continental crust: the case study of the Gavião Block, Bahia, Brazil. Journal of South American Earth Science, 11:487-498.
Sengör A.M.C., Burke K., Dewey J.F. 1978. Rits at high angles to
orogenic belts: tests for their origin and the Upper Rhine Graben as an example: American Journal of Science, 278:24-40.
Silva C.M.T. 2010. Os sistemas transcorrentes da porção sudoeste do Orógeno Araçuaí e norte da Faixa Ribeira: geometria e signiicado
tectônico. Tese de Doutorado, Universidade Federal de Ouro Preto, Ouro Preto, 221 p.
Simpson C. 1986. Fabric development in brittle-to-ductile shear zones. Pure Applied Geophysics, 124:269-288.
Steiger R.H. & Jäger E. 1977. Subcommission and Geochronology: convention and the use of decay constant in geo- and cosmochronology. Earth and Planetary Science Letters, 36:359-362.
Stonner R.W., Schoefer O.A., Katcolf S. 1965. Half-lives of argon-37,