Article
0103 - 5053 $6.00+0.00
*e-mail: [email protected]
Determination of Paracetamol at a Graphite-Polyurethane Composite Electrode as an
Amperometric Flow Detector
Priscila Cervini and Éder Tadeu Gomes Cavalheiro*
Instituto de Química de São Carlos, Departamento de Química e Física Molecular, Universidade de São Paulo, Av. Trabalhador São-carlense, 400, 13566-390 São Carlos-SP, Brazil
Um eletrodo compósito de grafite-poliuretana sem modificação foi avaliado como um detector amperométrico para análise em fluxo, na determinação de paracetamol (APAP) em formulações farmacêuticas. Uma curva analítica foi obtida com região linear entre 5,00 x 10⁻⁵ e 5,00 x 10⁻³mol L-1,
com um limite de detecção de 18,9 mol L-1e 180 determinações por hora, depois de parâmetros
otimizados como potencial de detecção, volume de amostragem, e vazão da solução carregadora. Interferência de ácido ascórbico foi observada, entretanto foi possível contorná-la, como visto pelos resultados que concordaram com HPLC com nível de confiança de 95%. Estes resultados mostraram que o compósito grafite-poliuretana pode ser usado como um detector amperométrico para análise em fluxo na determinação de APAP.
A bare graphite-polyurethane composite was evaluated as an amperometric flow injection detector in the determination of paracetamol (APAP) in pharmaceutical formulations. A linear analytical curve was observed in the 5.00 x 10⁻⁵ to 5.00 x 10⁻³ mol L-1 range with a minimum
detectable net concentration of 18.9 mol L-1and 180 determinations h-1, after optimization of
parameters such as the detection potential, sample loop volume, and carrier solution flow rate. Interference of ascorbic acid was observed, however, it was possible overcome the interference, reaching results that agreed with HPLC within 95% confidence level. These results showed that the graphite-polyurethane composite can be used as an amperometric detector for flow analysis in the determination of APAP.
Keywords: paracetamol, graphite-PU composite electrode, FIA
Introduction
Paracetamol (N-acetyl-p-aminophenol, acetaminophen, APAP) had been used for a long time and is one of the most extensively employed drugs in the world. It was first used in medicine by von Mering in 1893. However, it was first discovered to have both analgesic and antipyretic properties in the late 19th century. APAP is the active ingredient of several pharmaceutical products, in different dosage forms and doses, alone or in association. It is a suitable alternative for the patients who are sensitive to aspirin and safe up to therapeutic doses.1
It has low toxicity when used at the recommended doses.2 Nevertheless, the ease with which the general public
can access this drug makes it frequently associated with overdoses, in this situation causing serious or even fatal hepatic damage.3 The treatment of a supposed overdose
of APAP demands a rapid and reliable determination of its concentration in blood serum. So, APAP and its metabolites have been extensively investigated.4
Several analytical techniques such as titrimetry,5
spectrophotometry,6,7 spectrofluorometry,8 colorimetry,9
HPLC,10,11 and many other methods are proposed for
the determination of APAP. Electrochemical methods, especially the voltammetric and amperometric ones gave the opportunity to study the oxidation mechanisms. The cyclic voltammetric study concerning the electrochemical oxidation of APAP was described in the work of Kissinger
et al.12
Since voltammetric techniques are more selective, less costly and less time-consuming, they are widely used for the determination of APAP in pharmaceutical formulations and body fluids. Voltammetric determinations of APAP at chemically modified electrodes,13 glassy carbon electrode,14
platinum electrode,15 and at other electrodes16 have been
On the other hand, flow injection analysis (FIA) has been used routinely since its inception to provide sample handling automated control.17 FIA involves the injection
of a reproducible sample volume into a continuous flowing unsegmented carrier solution, followed by quantification at a detector device. In addition to automated control, FIA offers other advantages. These include convective mass transport, matrix exchange, and increased precision. The combination of FIA with electrochemical detection is attractive because of the flexibility of the former and the diagnostic power of the latter.18,19
In order to join the advantages of both FIA and voltammetric techniques, an electrode suitable to use under hydrodynamic conditions is necessary. We have recently proposed the use of a graphite-polyurethane composite as an electrode material that is inexpensive, long life, easy to prepare, and that can be used over a wide range of potentials and pH. We also found that for non-adsorbent analytes the electrode did not require frequent surface renewing and operates as an amperometric sensor in flow systems.20-22
Recently an extensive review on methods for determination of APAP was presented by Espinosa and co-workers.23 In that paper is possible to note that although flow
injection procedures with spectrophotometric detection and several electroanalytical methods have been described for APAP detection, few works on direct determination in an amperometric flow injection system is described. An other remarkable fact is that with the graphite polyurethane composite electrode the detection potential can be lowered down to 0.5 (vs. Ag/AgCl).
This work describes the optimization of a flow injection system with electrochemical detection for the determination of APAP in pharmaceutical formulations, using a 60% (m/m) graphite-polyurethane (PU) composite electrode as an amperometric detector in a flow injection procedure.
Experimental
Apparatus
All the reference or sample solutions were injected manually into the carrier stream using a laboratory-constructed three-piece injector-commutador made of polymethylmethacrylate (PMMA),24 with two fixed side bars
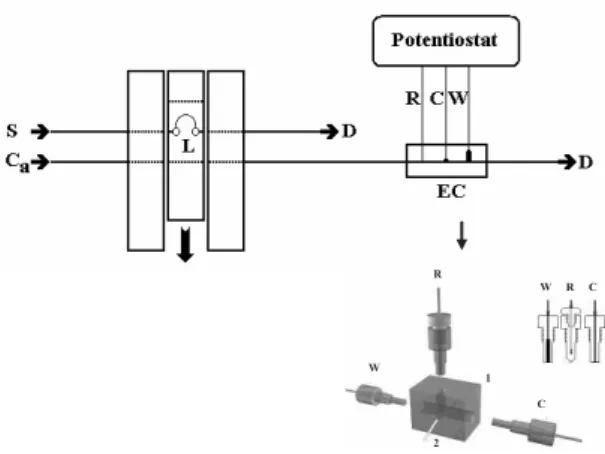
and a sliding central bar, which is moved for sampling and injection. The solutions were conducted with polyethylene tubing (0.8 mm i.d, Fiotubos, Brazil) and propelled with an IPC 8-channel peristaltic (Ismatec, Swtizerland) pump. An illustration of such system is presented in Figure 1.
Potentials were measured with an AUTOLAB PGSTAT-30 (Ecochemie, The Netherlands) potentiostat/
galvanostat coupled to a personal computer and controlled with a GPES 4.9 software. The measurements were performed in a three-electrode configuration flow cell (details in Figure 1) using the graphite-PU composite electrode 60% (graphite, m/m) or a glassy carbon (GC) as working electrodes. An Ag/AgCl, KCl 0.1 mol L–1 was
used as reference and a platinum disk ( = 3mm) was a counter electrode.
The body of the electrochemical flow cell (details in Figure 1) was fabricated with an unmodified castor oil polyurethane resin (Poliquil, Brazil) with an effective volume of 25 µL.20
Reagents and solutions
Solutions were prepared with twice distilled water in a quartz stiller. The APAP used was of analytical reagent grade (Natural Pharma, Brazil). Stock 5.00 mmol L-1 APAP
in universal buffer pH 8 solution was freshly prepared and adequately diluted in order to obtain the working solutions. The pharmaceutical samples were Tylenol (Janssen-Cilag Farmacêutica LTDA, Brazil), Resfenol (Kley Hertz S.A., Brazil), Buscopan Plus (Boehringer Ingelheim, Brazil) and Trimedal (Novartis Biociências S.A., Brazil).
Procedures for pharmaceutical formulation analysis
A c c o r d i n g t o t h e B r a z i l i a n P h a r m a c o p e a recommendations,25 twenty tablets were weighed and
powdered. Accurately weighed portions of powder equivalents to 750, 500 and 500 mg for Tylenol, Buscopan
Figure 1. Scheme of the flow injection system with electrochemical
detection used for the determination of APAP: S: sample, 5.00 x 10⁻³ mol
L-1 APAP solution; Ca: carrier, universal buffer pH 8.0; D, waste; L, loop;
Plus and Trimedal, respectively, and 40 mg of Resfenol solution were dissolved in 25 mL of universal buffer pH 8 to obtain solutions correspondent to 2.00 10-3 mol L-1
in APAP. The solutions were sonicated for 10 minutes to complete the dissolution.
Procedures for working electrode
The composite 60% (graphite, m/m) electrode was prepared as previously described.20 Briefly, adequate
amounts of the polyol and hardener, in proportion of 0.8 to 1 according to the manufacturer recommendation, and graphite (Aldrich, USA) were mixed in a mortar for 5 min in order to obtain a mixture with 60% of graphite (m/m). The resulting mixture is inserted in a manual press and extruded as 3.0 mm diameter rods, with geometrical area 0.0707 cm2. The composite was cured for 24 h at
room temperature and cutted in pieces with 1.0 cm long. A copper wire ( 1.0 mm) was attached to these rods with the help of a silver epoxy (EPO-TEK 410E, Epoxy Technology, USA), conducting resin in order to reach electric contact. This set was then inserted in an electrode body built up in PU resin, 5.0 mm i.d. (detail Figure 1) and sealed with the PU resin. A curing time of 24 h was adopted before use. Surface renewal was not necessary during the experiments as no APAP adsorption on the electrode surface was observed.
Flow injection measurements
The effect of different parameters relative to the flow system, such as carrier solution flow rate (1.4, 2.6, 3.9, 5.2, 6.5 and 7.7 mL min-1), detection potential (400, 450, 500,
550 and 600 mV vs. Ag/AgCl) and sample loop volume (25, 50, 75, 100, 126 and 151 µL) were evaluated.
Before the measurements the composite electrode was placed in the voltammetric cell in contact with the carrier solution, flowing during 2 min. This showed to be enough to obtain a stable baseline.
Using the optimized conditions an analytical curve was obtained by injection of different concentrations of APAP, in increasing order from 5.00 10-5 to 5.00 10-3mol L-1,
using the optimized parameters. The same procedure was repeated, but now in decreasing order to check if any memory effect was present. The injections were performed in quintuplicate, only for the standard solutions.
In the determination of APAP in pharmaceutical formulations, each standard APAP solution was injected three times in the increasing order from 5.00 10-5
to 3.00 10-3mol L-1, after that, four samples of
2.00 10-3mol L-1 APAP content in pharmaceutical
formulations (Tylenol, Resfenol, Buscopan Plus and Trimedal) were injected three times. Then, the same procedure was repeated, but now in decreasing order, for the standard solutions only.
Comparison method
The comparison method was realized according to the American Pharmacopea recommendations.26 Liquid
chromatography (HPLC) were recorded in a Shimadzu SCL-10A VP chromatograph, equipped with a RP-18 column (150 4.6 mm, 5 µm, Aldrich, USA). The detector used was an UV vis SPD-10A VP (Shimadzu, USA).
Results and Discussion
Flow injection parameters
The following parameter were optimized: the flow rate, a hydrodynamic factor which plays an important role in the efficiency of mass transport of analyte from bulk solution toward the electrode surface, being a major factor affecting the magnitude of peak currents in flow injection amperometry; the detection potential, which plays an important role in the selectivity and sensitivity of the analysis and the sample volume that defines the amount of analyte to be detected.
The effect of the flow rate on the peak current was evaluated between 1.4 and 7.7 mL min-1 by successive
injections of 5.00 10-3 mol L-1APAP solution in universal
buffer, pH 8 in which better sensitivity and peak resolution have been observed previously. The current increased continuously over the all range of flow rates investigated. Then 6.5 mL min-1 was chosen for further studies, since
above this flow rate the increase in the current signal is not enough to justify the reagent consumption and waste generation. Additionally, for higher flow rates, the standard deviation is higher.
The effect of the detection potential was evaluated between 400 and 600 mV by successive injection of 5.00 10-3 mol L-1APAP solution. These values were
chosen because in cyclic voltammetric the oxidation peak of APAP occurs in approximately 400 mV (Figure 2.a). The effect of the detection potential showed that there is no difference in the currents obtained at potential values higher than 500 mV, remaining practically constant (Figure 2.b). Thus, 500 mV was chosen for further studies since it presented less standard deviation between successive measurements and lower risk of oxidizing other species.
5.00 10-3 mol L-1APAP solution, under a flow rate of
6.5 L min-1 and detection potential fixed at 500 mV. The
current signal increased significantly up to 100 µL. For higher sample loop volumes the signal remained practically constant. So, this volume was selected.
Analytical curve
The analytical curve (Figure 3) was obtained in order to evaluate the behavior of the amperometric response of the composite 60% (graphite, m/m) in comparison to the concentration of APAP.
Using the optimized conditions, a linear response was obtained in the 5.00 10-5 to 5.00 10-3 mol L-1
APAP concentration range (Figure 3). The observed
linear region in all the analyzed range, follows the linear equation 1.
y= -0.35 µA + 8.8 mA mmol-1 L C APAP,
(n = 5, R =0.999) (1)
Analytical frequencies of 180 determinations per hour were observed under the optimized conditions. The limit of detection (LOD) obtained in this interval was of 18.9 µmol L-1, determined as three times the standard
deviation of the blank (Sd) divided by the angular coefficient of straight line (b)27
LOD = 3 Sd / b (2)
The LOD for APAP at a glassy carbon electrode with a geometrical area of 0.196 cm2, used as amperometric
flow detector under the same experimental conditions for comparison was 108 mol L-1, i.e. six times higher,
and it presented saturation at the electrode surface for concentrations values higher than 1.00 10-3 mol L-1.
A peak current of 32.1 ± 0.1 A for 10 successive injections of a 5.00 10-3 mol L-1 APAP solutions under the
optimized conditions were observed, a variance coefficient of 0.3%.
Determination of APAP in pharmaceutical formulations
The applicability of the composite electrode 60% (graphite, m/m) as a FIA amperometric detector for the determination of APAP was verified analyzing four pharmaceutical formulations as described previously.
Figure 2. (a) Ciclic voltammogram of 1.00 x 10⁻³ mol L-1APAP solution
using 60% (graphite, m/m) composite electrode in universal buffer pH 8, v = 25 mV s-1. (b) Effect of the detection potential in the amperometric
response of a 1.00 10-3 mol L-1 APAP solution in the FIA system using
an universal buffer solution pH 8.0 as carrier, 3.9 mL min-1flow rate,
50 µL sample loop, at the 60% (graphite, m/m) composite as working electrode.
Figure 3. Transient signals obtained at the composite 60% (graphite, m/m) electrode using (a) 5.00 10-5, (b) 1.00 10-4, (c) 5.00 10-4, (d)
1.00 10-3 and (e) 5.00 10-3 mol L-1 of APAP and universal buffer pH 8
as a carrier, flow rate of de 6.5 mL min-1, detection potential of 500 mV
Figure 4 shows the transient signals obtained for standard and sample solutions, and the resulting analytical curve.
Table 1 presents the obtained results using the proposed flow procedure and the HPLC as a comparative method. The results agreed within 95% of confidence level according to the t-Student test.28
Interference study was carried out in order to investigate the effect of ascorbic acid on the amperometric response of APAP since some commercial formulations can contain both analytes. FIA experiments were carried out for 5.00 10-4 mol L-1 APAP in presence of differentof ascorbic
acid concentrations. Interference was represented as an increase of 10, 15 e 14% in the APAP current, respectively for 2.50, 5.00 and 10.0 10-4 mol L-1of ascorbic acid.
One of the formulations analyzed (Trimedal) present both ascorbic acid and APAP. However, it was possible to determine APAP in the presence of AA even in this sample reaching results that agreed with those from chromatography, as observed in Table 1. This is probably
related to the very low concentration of the interferant in the formulation, since the sample contains 500 mg of APAP and only 40 mg of AA.
As any interference was observed by the other components of the pharmaceutical formulations it might be possible that this procedure can be used for APAP quantification.
Conclusions
According to these results it can be concluded that the composite 60% (graphite, m/m) electrode represents an interesting alternative to be used in FIA for the determination of APAP with a detection limit in the µmol L-1 level without modification. The method has
been satisfactorily applied to determination of APAP in pharmaceutical formulations.
Although lower detection limits can be found in the literature, the graphite-PU composite electrode is an inexpensive and long life device that can be used with any further modification.
Acknowledgments
The authors are indebted to the Brazilian agencies CNPq and FAPESP for PC post-doctoral fellowship, and FAPESP for financial support (05/04297-1).
References
1. Wade, A. ed. In Martindale, The Extra Pharmacopea, 27th ed., The Pharmaceutical Press: London, 1978.
2. Sweetman, S. C. ed. In Martindale, The Complete Drug Reference, 3rd ed., The Pharmaceutical Press: London, 2002.
3. Anker, A.; Clinical Toxicology, W. B. Saunders Company: Philadelphia, 2001.
4. Miner, D. J.; Rice, J. R..; Riggin, R. M.; Kissinger, P. T; Anal. Chem.1981,53, 2258.
5. Kumar, K. G.; Letha, R..; J. Pharm. Biomed. Anal.1997,15, 1725.
Figure 4. Transient signals for determination of APAP in pharmaceutical formulations using 60% (graphite, m/m) composite electrode in universal buffer pH 8 as a carrier, flow rate of de 6.5 mL min-1, detection potential
of 500 mV (vs. Ag/AgCl) and sample loop volume of 100 µL, at (a) 5.00 10-5, (b) 1.00 10-4, (c) 5.00 10-4, (d) 1.00 10-3, (e) 3.00 10-3mol
L-1, (S
1), (S2), (S3) and (S4), referent to Tylenol, Resfenol, Buscopan Plus
and Trimedal 2.00 10-3 mol L-1, respectively. In the detail the linear
region of the analytical curve.
Table 1. Determination of APAP in pharmaceutical formulations using both the proposed FIA procedure at the 60% (graphite, m/m) composite electrode and HPLC one
Sample Paracetamol (mg /tablet) E1% E2 %
Labeled FIAa HPLCb
Tylenol 750 748 ± 1 747 ± 1 + 0.07 - 0.27
Resfenolc 40.0 40.6 ± 0.2 39.8 ± 0.1 + 2.01 + 1.50
Buscopan Plus 500 514 ± 1 498 ± 1 + 3.15 + 2.80
Trimedal 500 482 ± 1 499 ± 1 - 3.33 - 3.60
a result ± standard deviation (n = 3); b 2 determination; c 40 mg/ 100 mL of solution; E
1: FIA vs. HPLC (FIA-HPLC/HPLC) x100%; E2: FIA vs. labeled
6. Canadá, M. J. A.; Reguera, M. I. P.; Medina, A. R.; de Cordova, M. L. F.; Diaz, A. M.; J. Pharm. Biomed. Anal.2000,22,59. 7. Ni, Y.; Liu, C.; Kokot, S.; Anal. Chim. Acta2000,419, 185. 8. Vilchez, J. L.; Blanc, R.; Avidad, R.; Navalon, A.; J. Pharm.
Biomed. Anal.1995,13, 1119.
9. Knochen, M.; Giglio, J.; Reis, B. F.; J. Pharm. Biomed. Anal. 2003,33, 191.
10. Ravisankar, S.; Vasudevan, M.; Gandhimathi, M.; Suresh, B.; Talanta1998,46, 1577.
11. Al-Obaidy, S. S.; Po, A. L. W.; McKiernan, P. J.; Glasgow, J. F. T.; Millership, J.; J. Pharm. Biomed. Anal.1995, 13, 1033. 12. Kissinger, P. T.; Roston, D. A.; Van Benschoten, J. J.; Lewis, J.
Y.; Heineman, W. R.; J. Chem. Educ.1983, 60, 772. 13. He, F. Y.; Liu, A. L.; Xia, X. H.; Anal. Bioanal. Chem.2004,
379, 1062.
14. Sandulescu, R.; Mirel, S.; Oprean, R.; J. Pharm. Biomed. Anal.
2000,23, 77.
15. Zen, J. M.; Ting, Y. S.; Anal. Chim. Acta.997,342, 175. 16. Vieira, I. C.; Lupetti, K. O.; Fatibello-Filho, O.; Quim. Nova
2003,26, 39.
17. RÙžika, J.; Hansen, E. H.; Anal. Chim. Acta1975,78, 145. 18. RÙžika, J.; Hansen, E. H.; Flow Injection Analysis, John
Willey: New York, 1988.
19. Karlberg, B.; Pacey, G. E.; Techniques and Instrumentation in Analytical Chemistry, Flow Injection Analysis: A Practical
Guide, Elsevier: New York, 1989.
20. Mendes, R. K.; Claro-Neto, S.; Cavalheiro, E. T. G.; Talanta
2002,57, 909.
21. Mendes, R. K.; Cervini, P.; Cavalheiro, E. T. G.; Talanta 2006, 68,708.
22. Cervini, P.; Ramos, L. A.; Cavalheiro, E. T. G.; ACAIJ2006,2, 187.
23. Espinosa Bosch, M.; Ruiz Sánchez, A. J.; Sánchez Rojas, F.; Bosch Ojeda, C.; J. Pharm. Biomed. Anal.2006,42, 291. 24. Ramos, L. A.; Prieto, K. R.; Cavalheiro, C. C. S.; Cavalheiro,
E. T. G.; J. Chem. Educ.2005,82, 1815.
25.Farmacopéia Brasileira, 4th ed., Parte I, Atheneu Editora: São Paulo, 1988.
26.The United States Pharmacopeia National Formulary XXVII, U.S. Pharmacopeia Convention: Rockville, 2004.
27. Long, G. L.; Winefordner, J. D.; Anal. Chem.1983, 55, 712A.
28. Harris, D.C.; Análise Química Quantitativa, LTC Editora: Rio de Janeiro, 2001.
Received: July 2, 2007
Web Release Date: March 25, 2008