Prevalence of prediabetes in patients with metabolic risk
Prevalência de pré-diabetes em pacientes com risco metabólico
Lívia Nascimento de Matos
I, Guilherme de Vieira Giorelli
I, Amir Saado
I, Cristiane Bitencourt Dias
IIDepartment of Internal Medicine, Institute for Medical Treatment, Hospital do Servidor Público Estadual de São Paulo –
Francisco Morato de Oliveira, São Paulo, Brazil
ABSTRACT
CONTEXT AND OBJECTIVE: Early diagnosis of prediabetes should be done to avoid complications relat-ing to diabetes mellitus (DM). The aim here was to assess the prevalence of prediabetes among individuals at high risk of developing DM, and to seek variables relating to glucose intolerance (GI) among individuals with normal fasting plasma glucose (FPG).
DESIGN AND SETTING: Cross-sectional study at Hospital do Servidor Público Estadual, São Paulo.
METHODS: The FPG and glucose tolerance test (GTT) were analyzed, from which the subjects were di-vided as follows: group 1 (FPG and GTT both normal), group 2 (normal FPG but abnormal GTT), group 3 (abnormal FPG but normal GTT), and group 4 (FPG and GTT both abnormal). The subjects’ clinical, labora-tory and anthropometric profile was determined.
RESULTS: 138 subjects were studied: 44 in group 1, 11 in group 2, 33 in group 3 and 50 in group 4. The prev-alence of prediabetes was 68.0%. Group 4 individuals were older than group 1 individuals [69.0 (55.5-74.0) versus 58.9 ± 11.8 years; P < 0.05], with greater prevalence of risk conditions for DM [5.0 (4.0-5.0) versus 4.0 (3.0-5.0); P < 0.05]. Among individuals with normal FPG, GI prevalence was 20.0%. No variables analyzed correlated with GTT.
CONCLUSION: The prevalence of prediabetes was 68.0%, and 20.0% of subjects with normal FPG had GI. Although some anthropometric, clinical and laboratory variables have been correlated with DM and prediabetes, none, except for GTT, was able to screen for GI among subjects with normal FPG in the pres-ent study.
RESUMO
CONTEXTO E OBJETIVO: Deve-se diagnosticar o estado pré-diabético precocemente para evitar as com-plicações do diabetes mellitus (DM). Objetiva-se avaliar a prevalência de estado pré-diabético entre indi-víduos sob risco de desenvolvimento de DM, buscando variáveis relacionadas à intolerância à glicose (IG) naqueles com glicemia de jejum (GJ) normal.
TIPO DE ESTUDO E LOCAL: Estudo transversal no Hospital do Servidor Público Estadual, São Paulo.
MÉTODOS: Analisou-se GJ e teste oral de tolerância a glicose (GTT), que determinaram a seguinte divisão: grupo 1 (GJ e GTT normais), grupo 2 (GJ normal e GTT alterado), grupo 3 (GJ alterada e GTT normal) e grupo 4 (GJ e GTT alterados). Determinou-se o perfil clínico, laboratorial e antropométrico dos indivíduos estudados.
RESULTADOS: Estudaram-se 138 indivíduos: 44 no grupo 1, 11 no grupo 2, 33 no grupo 3 e 50 no grupo 4. A prevalência de estado pré-diabético foi 68,0%. Indivíduos do grupo 4, em relação ao grupo 1, demons-traram idade mais avançada [69,0 (55,5-74,0) versus 58,9 ± 11,8 anos, P < 0,05] e maior prevalência de con-dições de risco para o DM [5,0 (4,0-5,0) versus 4,0 (3,0-5,0), P < 0,05]. Dentre aqueles com GJ normal, 20,0% apresentaram IG. Nenhuma variável se correlacionou com o GTT.
CONCLUSÃO: A prevalência de estado pré-diabético foi 68,0%; 20,0% daqueles com GJ normal apresen-taram IG. Apesar de algumas variáveis clínicas, antropométricas e laboratoriais estarem descritas como relacionadas ao DM e ao estado pré-diabético, no presente estudo, nenhuma, à exceção do GTT, foi capaz de rastrear a presença de IG entre aqueles com GJ normal.
IMD. Postgraduate Student, Department of Internal Medicine, Institute for Medical Treatment, Hospital do Servidor Público Estadual de São Paulo – Francisco Morato de Oliveira, São Paulo, Brazil.
IIMD, PhD. Attending Physician, Department of Internal Medicine, Institute for Medical Treatment, Hospital do Servidor Público Estadual de São Paulo – Francisco Morato de Oliveira, São Paulo, Brazil.
KEY WORDS
Glucose intolerance. Glucose tolerance test. Diabetes mellitus. Prediabetic state. Hyperglycemia.
PALAVRAS-CHAVE
Intolerância à glucose. Teste de tolerância a glucose. Diabetes mellitus.
INTRODUCTION
Diabetes mellitus is a metabolic disorder characterized by high plasma glucose levels, resulting from lower insulin secretion, resis-tance to its peripheral action, or both.1 On the other hand, predia-betes may be deined as a state of abnormal fasting plasma glucose, glucose intolerance, or both.1
Over recent decades, this condition has come to be con-sidered a worldwide pandemic. Data from the World Health Organization (WHO) indicate that the prevalence of diabetes mellitus is 2.8% among the world population over 20 years of age.2 Estimates from WHO have predicted that the worldwide prevalence will reach 4.4% by 2030, among aging individuals. In absolute numbers, this represents an increase from 171 million diabetic adults in 2000 to approximately 366 million around the world in 2030.2 hese data may still be an underestimate, since the projections were made assuming that the overweight and obesity levels would remain stable among the world population over the coming decades.2 Brazil appears in eighth highest posi-tion out of 191 countries in relaposi-tion to the ranking of diabetes mellitus rates among WHO members.2
However, many individuals have unknown diabetic or pre-diabetic metabolic abnormalities and live with high plasma glu-cose levels (either fasting or postprandial) for many years. Such levels may lead to establishment of tissue damage even before the classical signs and symptoms of this condition have become clinically established (polyuria, polydipsia, weight loss with or without polyphagia, and blurred vision). his has been recog-nized as increasing the risk of developing renal, cardiac, neu-rological, ophthalmological, macrovascular and microvascular complications, as well as infectious diseases.1,3 At the time when type II diabetes mellitus is diagnosed, some individuals already present some of those complications in laboratory tests.2 During this asymptomatic period, abnormal carbohydrate metabolism can be demonstrated through assessment of plasma glucose lev-els ater 8-12 hours of overnight fasting (fasting plasma glucose, FPG) or through the glucose tolerance test (GTT), in which 75 g of glucose is ingested and the plasma glucose level is measured 120 minutes later.1 Plasma glucose levels may luctuate between physiological and pathological levels among diabetics, depend-ing on the extent of the underlydepend-ing metabolic disorder, since the same clinical condition could lead to abnormalities only in postprandial glycemia, while FPG is normal, and vice versa.1 For such patients, interventions like weight loss, physical activity and use of oral hypoglycemic agents may lead to adequate gly-cemic control.1
he following conditions have been considered to increase the risk of developing diabetes mellitus: hypertension; overweight and obesity, deined as body mass index (BMI) ≥ 25 kg/m2; large waist circumference; irst-degree kinship with diabetics; Asian,
Hispanic or African-American ethnicity; mothers of large-for-gestational-age newborns or who presented gestational diabetes mellitus; fasting serum high-density lipoprotein (HDL) choles-terol < 35 mg/dl; and triglycerides > 250 mg/dl.4
Anthropometric indicators of central obesity have been asso-ciated with insulin resistance, demonstrated by high homeostasis model assessment of insulin resistance index (HOMA-IR); glu-cose intolerance and cardiovascular events, such as the conicity index5 and waist-to-height ratio (WHtR);6 as well as indicators of fat distribution body, such as waist-to-hip-ratio (WHR).7,8
Rosenbaum et al., who studied populations at high risk of developing metabolic disease, observed that glucose intolerance had an independent efect on endothelial dysfunction, which was characterized in their study by the presence of albuminuria.9 Fur-thermore, glucose intolerance is a condition of increased risk of developing diabetes mellitus.10 However, progression to diabetes mellitus is not inevitable,2 which suggests that early diagnosis of this clinical condition is desirable, such that prophylactic inter-ventions can be adopted.
In Brazil, the prevalence of diabetes mellitus was estimated to be 7.6% and glucose intolerance was found to be 7.8%, 25 years ago, according to the Brazilian Multicenter Study, conducted between 1986 and 1988.9 Another study conducted in São Paulo between 1996 and 1997 showed higher estimated prevalence of diabetes mellitus (12.1%) and around the same glucose intoler-ance rate (7.7%).10 Another Brazilian study showed estimated prevalence of glucose intolerance of 14.7% among patients at high risk of metabolic syndrome in 1998.11
We believe that studies among non-diabetic populations that are at higher risk of developing diabetes mellitus are impor-tant for establishing preventive strategies directed towards this population.
OBJECTIVES
METHODS Study design
We conducted a cross-sectional study in which we analyzed data from outpatients followed between July 2008 and December 2009 in the Department of Internal Medicine of the Institute for Med-ical Treatment, Hospital do Servidor Público Estadual de São Paulo – Francisco Morato de Oliveira, São Paulo, Brazil. Most of the individuals included were undergoing outpatient follow-up treatment for hypertension and/or dyslipidemia. he study was approved by the research ethics committee of the same hospi-tal (protocol number 0010.338.000-08) and the research subjects gave their written informed consent.
Inclusion criteria
he study included individuals who had at least one of the fol-lowing conditions relating to higher risk of developing diabetes mellitus: hypertension; BMI ≥ 25 kg/m2; waist circumference > 80 cm for women and > 94 cm for men; irst-degree kinship with diabetics; mothers of large-for-gestational-age newborns or who presented gestational diabetes mellitus; fasting serum HDL-cho-lesterol < 35 mg/dl; and triglycerides > 250 mg/dl. Since the Bra-zilian population is one of the most mixed in the world, ethnic groups were not considered as inclusion criteria alone.
Exclusion criteria
he following were exclusion criteria: prior diagnosis of diabetes mellitus or a prediabetic state; use of oral hypoglycemic agents or insulin; use of drugs that would interfere with glucose and insu-lin metabolism, such as angiotensin-converting enzyme inhibi-tors, angiotensin receptor blockers and thiazide diuretics; use of drugs that would interfere with the serum levels of HDL-cho-lesterol and triglycerides; and use of any pharmacological drugs in order to treat obesity. Changes in lifestyle such as treatment for obesity, dyslipidemia, metabolic syndrome or any pathologi-cal condition did not constitute exclusion criteria. he only lip-id-lowering drugs that were used by some research subjects were statins. Previous diagnoses of diabetes mellitus were deined as plasma glucose > 200 mg/dl at any time, FPG > 125 mg/dl, or GTT ≥ 200 mg/dl. Two results were necessary for the diagnosis when the patient was asymptomatic.
Sample size calculation and study population
he study sample was calculated by estimating a prevalence of prediabetic state of 25%; the null hypothesis was deined as 15% prevalence. he alpha and beta errors were set at 0.05 and 0.20, respectively. hrough the test sample calculation for single pro-portions, the minimum sample size required was estimated to be 106 individuals.
Initially, the study sample included 142 individuals, who were mostly followed because of hypertension and dyslipidemia.
Of these, four (2.8%) were excluded because of FPG ≥ 126 mg/dl, thus leaving 138 subjects. hese were divided into groups (1, 2, 3 and 4) according to their FPG and GTT, as showed in the low-chart of Figure 1.
Anthropometric measurements
All the data were evaluated by physicians trained in the current techniques recommended for each anthropometric measure-ment. We assessed weight and height while the subjects were wearing light clothes, using the techniques proposed by Jellife;12 waist circumference while the patients were standing, at the end of exhalation, at the midpoint between the lower costal border and the top of the iliac crest, using an inelastic tape in a horizon-tal position;8 and hip circumference, at the level of the greater trochanter,13,14 in order to calculate the WHR.8,13,14 We calculated the BMI, WHR, WHtR and conicity index. he formulas used to calculate the indices studied were as follows:
Body mass index8 =
height² (m) weight (kg)
Waist-to-hip ratio13 = waist circumference (cm) hip circumference (cm)
Waist-to-height ratio6 = waist circumference (cm) height (cm)
Conicity index5 = waist circumference (m)
0.109 x
√
height (m) weight (kg)
Clinical evaluation
We conducted a medical consultation covering the subject’s his-tory and focusing on asking about symptoms relating to dia-betes mellitus, especially polyuria, polydipsia and weight loss with or without polyphagia. We assessed the research subjects’ blood pressure, presence of diagnoses of hypertension and dys-lipidemia and use of any antihypertensive, lipid-lowering or other drugs.
Diagnoses of dyslipidemia were evaluated in accordance with the laboratory criteria established in the Fourth Brazilian Guide-lines on Dyslipidemia and Atherosclerosis Prevention,8 or were
established if lipid-lowering medications were being used, regard-less of the serum lipoprotein cholesterol and triglyceride levels.8
Laboratory analysis
Blood samples were collected from the research subjects ater they had spent 12 hours fasting (overnight) and ater ive min-utes resting in a seated position. his was done by means of ante-cubital venous puncture. All the blood samples were analyzed by the same team in the same laboratory, using the same kits sup-plied by the same manufacturer. he GTT was performed using the blood samples collected ater fasting and again, 120 minutes ater ingestion of 75 g of glucose.
he research subjects underwent FPG and GTT analysis. hey were instructed to adhere to a high-carbohydrate diet for three days prior to the GTT; not to use any laxative on the day before the test; and not to do any physical exertion just before the test. If indi-viduals presented diarrhea during the 48-hour period preceding the GTT, it was scheduled for another day. Individuals were also instructed to avoid walking and they were not allowed to smoke throughout the test; ingestion of food of any kind was also pro-hibited during the test. he plasma glucose level was determined using an enzymatic method.
We evaluated the plasma insulin levels ater the 12 hours of overnight fasting. hese were determined using the immunomet-ric method in a two-sided solid-phase chemiluminescent assay (Immulite 2000, SiemensTM). his assay shows high agreement levels between assays and within assays, according to information provided by the manufacturer. Plasma uric acid levels were deter-mined using the enzymatic colorimetric method; plasma creati-nine using the kinetic colorimetric method; plasma triglycerides using the enzymatic colorimetric method; plasma total cholesterol using the colorimetric method; and plasma HDL cholesterol using the enzymatic colorimetric method. Plasma LDL cholesterol was calculated using the Friedewald formula, as follows:
LDL cholesterol8 = total cholesterol – HDL cholesterol – triglycerides/5.
We also evaluated microalbuminuria (µg/min) using the chemiluminescence method, in samples of 24-hour urine (data not presented).
FPG was considered to be normal when it was ≤ 99 mg/ dl, and abnormal when it was between 100 and 125 mg/dl.1 GTT was considered to be normal when it was ≤ 139 mg/dl, and abnormal when it was ≥ 140 mg/dl.1,15 According to the World Health Organization criteria,15 GTT ≥ 200 mg/dl is regarded as diagnostic of diabetes mellitus in cases of post-prandial hyperglycemia alone, but because this study aimed to
Figure 1. Flowchart showing the initial study population, the excluded subjects and the division into groups according to fasting plasma glucose (FPG) and glucose tolerance test (GTT) values.
142 individuals were included in accordance
with inclusion criteria
Group 1 FPG < 100 mg/dl GTT < 140 mg/dl
n = 44
Group 2 FPG < 100 mg/dl
GTT
≥
140 mg/dln = 11
Group 4 FPG 100-125 mg/dl
GTT ≥ 140 mg/dl n = 50 4 subjects were
excluded due to FPG ≥ 126 mg/dl
Group 3 FPG 100-125 mg/dl
investigate occurrences of glucose metabolism abnormalities among patients with normal FPG, we considered all values of GTT ≥ 140 mg/dl to be abnormal GTT.
Statistical analysis
Statistical analyses were performed using the Medcalc sotware, version 11.1. he statistical signiicance level was set at P < 0.05.
Continuous variables were expressed as the mean ± standard deviation or median with interquartile range, for the variables with and without normal distribution, respectively. Categorical variables were expressed as percentages.
Diferences between groups relating to categorical variables were determined using the chi-square test. For continuous vari-ables showing normal distribution, analysis of variance with Tukey’s post-hoc test was used, and Pearson’s correlation coei-cient was calculated. For those that did not show normal distri-bution, Kruskal-Wallis with Dunn’s post-hoc test was performed, and Spearman’s correlation coeicient was used. he receiver operating characteristic (ROC) curve was obtained, and the area under the curve (AUC) was calculated, with the 95% con-idence interval.16 he sensitivity and speciicity of the diagno-sis of glucose intolerance, the anthropometric data and the FPG and HOMA-IR values were calculated for each cutof point in
the sample. he cutof point with highest sum between sensitivity and speciicity was chosen in order to optimize the relationship between those two parameters.17
RESULTS
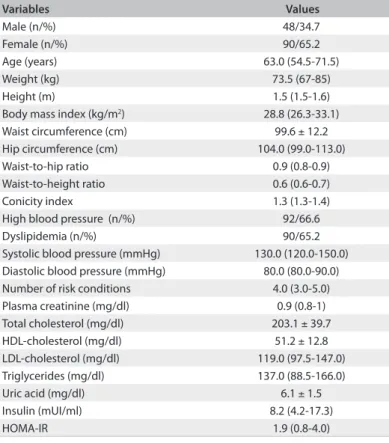
We analyzed the clinical, laboratory and anthropometric data of 138 individuals, whose general characteristics are presented in Table 1. It can be emphasized that metabolic risk conditions were highly prevalent in this population, and that the biggest three risk factors were obesity, high blood pressure and dyslipidemia.
he population studied was divided into groups as follows: 44 individuals in group 1 (31.9%), who demonstrated normal levels both for FPG and for GTT (91.3 ± 5.5 mg/dl and 98.9 ± 22.1 mg/ dl, respectively); 11 individuals in group 2 (8.0%), who demon-strated normal FPG and elevated GTT [92.4 ± 6.9 mg/dl and 149.0 (142.0-214.0) mg/dl, respectively]; 33 subjects in group 3 (23.9%), who presented abnormal FPG and normal GTT levels [107.0 (103.5 – 110.0) mg/dl and 110.5 ± 18.9 mg/dl, respec-tively]; and 50 subjects in group 4 (36.2%), who demonstrated high levels both for FPG and for GTT [108.0 ± 10.0 mg/dl and 158.5 (145.0-189.5) mg/dl, respectively].
he prevalence of a prediabetic state was 68.1% (Groups 2, 3 and 4) in the sample studied. Among the individuals who had a prediabetic state diagnosed during the study period, we found that 11.7% had glucose intolerance with normal FPG, 35.1% had abnormal FPG alone, and 53.2% had both glucose intolerance and abnormal FPG. Among the 61 individuals who had glucose intolerance diagnosed (groups 2 and 4), 11 (18.0%) demonstrated normal FPG. On the other hand, among the 55 individuals who had normal FPG, 11 (20.0%) demonstrated glucose intolerance or diabetes mellitus in relation to postpran-dial hyperglycemia alone.
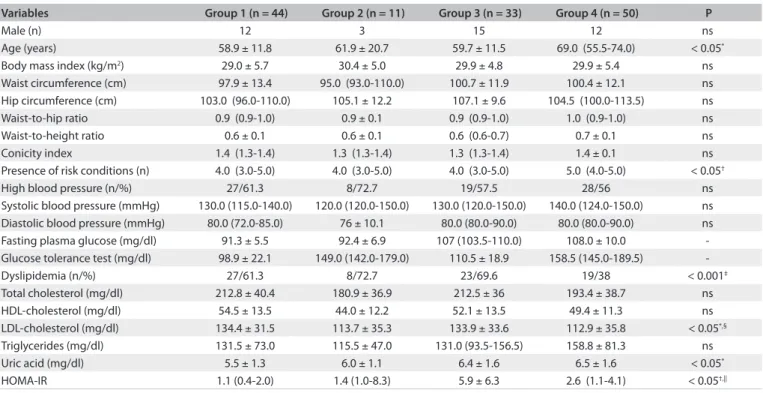
In the comparisons between these groups, there were no diferences regarding sex, BMI, waist circumference, WHR or prevalence of high blood pressure. However, in relation to individuals whose FPG and GTT were both normal (group 1), patients with abnormal FPG and elevated GTT (group 4) were older [69.0 (55.5-74.0) years versus 58.9 ± 11.8 years; P < 0.05], demonstrated higher number of risk conditions [5.0 (4.0-5.0) versus 4.0 (3.0-5.0); P < 0.05], higher plasma levels of uric acid (6.5 ± 1.6 mg/dl versus 5.5 ± 1.3 mg/dl; P < 0.05), lower prev-alence of dyslipidemia (38.0% versus 61.3%; P < 0.001), lower plasma levels of LDL cholesterol (112.9 ± 35.8 mg/dl versus 134.4 ± 13.5 mg/dl; P < 0.05) and higher HOMA-IR index [2.6 (1.1-4.1) versus 1.1 (0.4-2.0); P < 0.05]. In relation to group 3, the individuals in group 4 demonstrated lower plasma levels of LDL cholesterol (112.9 ± 35.8 mg/dl versus 133.9 ± 33.6 mg/ dl; P < 0.05). In relation to group 1, group 3 presented higher HOMA-IR index [5.9 ± 6.3 versus 1.1 (0.4 – 2.0); P < 0.05]. he comparisons between group data are shown in .
Variables Values
Male (n/%) 48/34.7
Female (n/%) 90/65.2
Age (years) 63.0 (54.5-71.5)
Weight (kg) 73.5 (67-85)
Height (m) 1.5 (1.5-1.6)
Body mass index (kg/m2) 28.8 (26.3-33.1)
Waist circumference (cm) 99.6 ± 12.2
Hip circumference (cm) 104.0 (99.0-113.0)
Waist-to-hip ratio 0.9 (0.8-0.9)
Waist-to-height ratio 0.6 (0.6-0.7)
Conicity index 1.3 (1.3-1.4)
High blood pressure (n/%) 92/66.6
Dyslipidemia (n/%) 90/65.2
Systolic blood pressure (mmHg) 130.0 (120.0-150.0) Diastolic blood pressure (mmHg) 80.0 (80.0-90.0)
Number of risk conditions 4.0 (3.0-5.0)
Plasma creatinine (mg/dl) 0.9 (0.8-1)
Total cholesterol (mg/dl) 203.1 ± 39.7
HDL-cholesterol (mg/dl) 51.2 ± 12.8
LDL-cholesterol (mg/dl) 119.0 (97.5-147.0)
Triglycerides (mg/dl) 137.0 (88.5-166.0)
Uric acid (mg/dl) 6.1 ± 1.5
Insulin (mUI/ml) 8.2 (4.2-17.3)
HOMA-IR 1.9 (0.8-4.0)
Table 1. General characteristics of the population studied (n = 138)
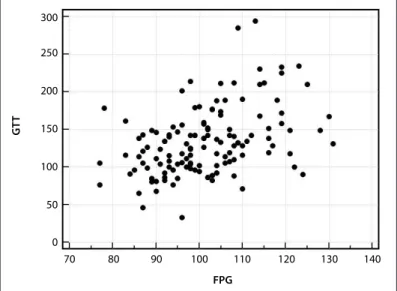
We performed correlation analysis between the variables and the GTT for the total sample (groups 1, 2, 3 and 4) and for indi-viduals who had normal FPG (groups 1 and 2). he second anal-ysis was performed in order to search for clinical, anthropomet-ric or laboratory characteristics relating to glucose intolerance among individuals with normal FPG. In assessing the total study sample, FPG showed statistical correlations with GTT (r = 0.5; P < 0.0001) (Figure 2), according to Spearman’s correlation test.
In assessing individuals who presented normal FPG, no variables showed any correlation with the GTT.
We performed ROC analysis for FPG and anthropometric parameters in relation to glucose intolerance, diagnosed accord-ing to the GTT, in the total sample of the study (groups 1, 2, 3 and 4), and among the individuals with normal FPG (groups 1 and 2). In analyzing the total sample studied, we found that an AUC
larger than the diagonal reference line (AUC > 0.5) was dem-onstrated by the FPG (P < 0.0001) and WHtR (P = 0.04) (Table 3 and Figure 3), unlike the other parameters analyzed. On the
other hand, among the individuals with normal FPG, neither FPG nor anthropometric parameters showed areas under the ROC curve larger than the diagonal reference line (P > 0.05) (Table 4). We also evaluated the cutof points for FPG and
anthropo-metric variables with greater accuracy in the glucose intolerance diagnosis, seeking the variables with the highest sum between sensitivity and speciicity, irstly among the total sample studied (groups 1, 2, 3 and 4) and then among individuals with normal FPG (groups 1 and 2). In the irst analysis, the FPG (at 98 mg/dl) and the WHtR (at 0.6) stood out (Table 3); and in the second analysis, the FPG (at 92 mg/dl) and BMI (at 28.2 kg/m2) stood out (Table 4).
Variables Group 1 (n = 44) Group 2 (n = 11) Group 3 (n = 33) Group 4 (n = 50) P
Male (n) 12 3 15 12 ns
Age (years) 58.9 ± 11.8 61.9 ± 20.7 59.7 ± 11.5 69.0 (55.5-74.0) < 0.05*
Body mass index (kg/m2) 29.0 ± 5.7 30.4 ± 5.0 29.9 ± 4.8 29.9 ± 5.4 ns
Waist circumference (cm) 97.9 ± 13.4 95.0 (93.0-110.0) 100.7 ± 11.9 100.4 ± 12.1 ns Hip circumference (cm) 103.0 (96.0-110.0) 105.1 ± 12.2 107.1 ± 9.6 104.5 (100.0-113.5) ns
Waist-to-hip ratio 0.9 (0.9-1.0) 0.9 ± 0.1 0.9 (0.9-1.0) 1.0 (0.9-1.0) ns
Waist-to-height ratio 0.6 ± 0.1 0.6 ± 0.1 0.6 (0.6-0.7) 0.7 ± 0.1 ns
Conicity index 1.4 (1.3-1.4) 1.3 (1.3-1.4) 1.3 (1.3-1.4) 1.4 ± 0.1 ns
Presence of risk conditions (n) 4.0 (3.0-5.0) 4.0 (3.0-5.0) 4.0 (3.0-5.0) 5.0 (4.0-5.0) < 0.05†
High blood pressure (n/%) 27/61.3 8/72.7 19/57.5 28/56 ns
Systolic blood pressure (mmHg) 130.0 (115.0-140.0) 120.0 (120.0-150.0) 130.0 (120.0-150.0) 140.0 (124.0-150.0) ns Diastolic blood pressure (mmHg) 80.0 (72.0-85.0) 76 ± 10.1 80.0 (80.0-90.0) 80.0 (80.0-90.0) ns Fasting plasma glucose (mg/dl) 91.3 ± 5.5 92.4 ± 6.9 107 (103.5-110.0) 108.0 ± 10.0 -Glucose tolerance test (mg/dl) 98.9 ± 22.1 149.0 (142.0-179.0) 110.5 ± 18.9 158.5 (145.0-189.5)
-Dyslipidemia (n/%) 27/61.3 8/72.7 23/69.6 19/38 < 0.001‡
Total cholesterol (mg/dl) 212.8 ± 40.4 180.9 ± 36.9 212.5 ± 36 193.4 ± 38.7 ns
HDL-cholesterol (mg/dl) 54.5 ± 13.5 44.0 ± 12.2 52.1 ± 13.5 49.4 ± 11.3 ns
LDL-cholesterol (mg/dl) 134.4 ± 31.5 113.7 ± 35.3 133.9 ± 33.6 112.9 ± 35.8 < 0.05*,§
Triglycerides (mg/dl) 131.5 ± 73.0 115.5 ± 47.0 131.0 (93.5-156.5) 158.8 ± 81.3 ns
Uric acid (mg/dl) 5.5 ± 1.3 6.0 ± 1.1 6.4 ± 1.6 6.5 ± 1.6 < 0.05*
HOMA-IR 1.1 (0.4-2.0) 1.4 (1.0-8.3) 5.9 ± 6.3 2.6 (1.1-4.1) < 0.05†,||
Table 2. Clinical, anthropometric and laboratory characteristics of each group and comparisons between groups 1, 2, 3 and 4
*Difference between group 1 and group 4 according to analysis of variance with Tukey’s post-hoc test; †Difference between group 1 and group 4 according to Kruskal-Wallis with Dunn’s post-hoc test; ‡Difference between group 1 and group 4 according to chi-square test; §Difference between group 3 and group 4 according to analysis of variance with Tukey’s post-hoc test ||Difference between group 1 and group 3 according to Kruskal-Wallis with Dunn’s post-hoc test. HDL = high-density lipoprotein; LDL = low-density lipoprotein; HOMA-IR = homeostasis model assessment of insulin resistance; ns = not significant.
Table 3. Effectiveness of variables analyzed for diagnosing glucose intolerance in the total sample studied (n = 138), according to receiver operating characteristic (ROC) analysis
Variables AUC SE (95% CI) Cutof point Sensitivity (95% CI) Speciicity (95% CI) Sn + Sp P (AUC = 0.5)
Fasting plasma glucose 0.7 0.1 (0.6 to 0.8) 98 76.0 (62.4 to 86.5) 56.4 (44.7 to 67.6) 132.3 < 0.0001 Waist-to-height ratio 0.6 0.1 (0.5 to 0.7) 0.6 82.4 (69.1 to 91.6) 42.1 (30.9 to 54.0) 124.5 0.04 Waist circumference 0.6 0.1 (0.5 to 0.7) 108 32.7 (20.3 to 47.1) 84.2 (74.0 to 91.6) 116.9 ns Conicity index 0.6 0.1 (0.5 to 0.7) 1.3 66.7 (52.1 to 79.2) 51.3 (39.6 to 63.0) 118.0 ns Body mass index 0.6 0.1 (0.5 a 0.7) 28.0 72.6 (58.3 to 84.1) 48.7 (37.0 to 60.4) 121.2 ns Waist-to-hip ratio 0.6 0.1 (0.5 to 0.6) 1.02 25.5 (14.3 to 39.6) 89.5 (80.3 to 95.3) 115.0 ns
DISCUSSION
he high prevalence of glucose intolerance observed in this sam-ple was mainly due to the high comsam-plexity proile of the hospi-tal where this study was developed, thus explaining the inding of higher prevalence than seen in other studies.9-11 It is notewor-thy that, among individuals with glucose intolerance (groups 2 and 4), 18% had normal FPG. Moreover, considering all the indi-viduals with normal FPG (groups 1 and 2), no clinical or anthro-pometric variables were able to screen for glucose intolerance in a statistically signiicant way. However, it needs to be borne in mind that because of the small number of subjects in this study, these assessments did not distinguish between the sexes. his may have reduced the accuracy of these variables, with regard to parameters for which the cutof difers between men and women, such as waist circumference and WHtR.18-21
In the total study sample, the only anthropometric variable that was shown to be efective regarding the diagnosis of glucose intolerance according to the GTT, from a statistical point of view, was the WHtR. Other research groups have reported the exis-tence of associations between WHtR and clinical conditions such as let ventricular hypertrophy,22 high blood pressure,23-25 diabe-tes mellitus,24 and insulin resistance in eutrophic men, as assessed using the HOMA-IR index.26 he WHtR analysis was based on studies such as by Hsieh and Yoshinaga, who showed that individ-uals with similar waist circumferences but small stature showed worse metabolic proile and cardiovascular disease, as demon-strated by higher prevalence of hyperglycemia, fatty liver disease and hypertension compared with individuals of greater stature, even ater adjusting for age, smoking and lipid proile. his sug-gests that the WHtR would be a more accurate tool in screening for metabolic consequences of visceral adipose tissue deposit.27 his is an anthropometric parameter that encompasses variables from simple measurement and is easy to interpret, which sug-gests that it might be useful within clinical practice settings.
In this study, among the individuals who had normal FPG, the prevalence of glucose intolerance was 20.0%, as demonstrated by an abnormal GTT. In a prospective study, Gabir et al. observed that the cumulative incidence of diabetes mellitus over ive years, among those who had normal FPG and glucose intolerance was
Figure 3. Receiver operating characteristic (ROC) curve for fasting plasma glucose (FPG) and waist-to-height ratio (WHtR) in relation to diagnosis of glucose intolerance according to glucose tolerance test (GTT) among total sample studied (n = 138).
100
80
60
40
20
0
0 20 40 60
100-Specificity
WHtR FPG
S
ensitivit
y
80 100 90
70
50
30
10
Figure 2. Spearman’s correlation between fasting plasma glucose (FPG) and glucose tolerance test (GTT) among total sample studied (r = 0.5; P < 0.0001).
300
250
200
150
100
50
0
70 80 90
FPG
GT
T
110
100 120 130 140
Table 4. Effectiveness of variables analyzed for diagnosing glucose intolerance among individuals with normal fasting plasma glucose (n = 55), according to receiver operating characteristic (ROC) curve analysis
Variables AUC ± SE (95% CI) Cutof point Sensitivity (95% CI) Speciicity (95% CI) Sn + Sp P (AUC = 0.5)
5.5 times higher than among those whose FPG and GTT were both normal.28 hese data suggest, according to these authors,
that among patients who present at least one condition relating to increased risk of developing diabetes mellitus, performing the GTT is highly recommendable, even among individuals who have already been found to present normal FPG. his is because the GTT is a low-cost test that is simple to implement, easy to under-stand and widely available at all levels of healthcare complexity.
In the ROC analysis that was made in order to evaluate the accuracy of FPG in diagnosing glucose intolerance, among the individuals with normal FPG, a cutof of 92 mg/dl, with sensitiv-ity of 68.8% and speciicity of 55.6%, was suggested. his value is lower than what is recommended as a cutof point for nor-mal FPG. In a prospective study, Tirosh et al. demonstrated that the risk of developing diabetes mellitus among young men who have normal FPG was much higher among those who initially had FPG between 91 and 99 mg/dl, i.e. classiied as high nor-mal FPG.29 Another research group showed the same result in a population-based study among those who had FPG ≥ 94 mg/dl.30 Studies have shown substantial indings suggesting that high nor-mal FPG levels are related to increased cardiovascular, cerebro-vascular and overall mortality among individuals aged 45 years and over.31,32 herefore, subcategories within the normal FPG range might denote important information regarding risk assess-ments for several pathological conditions,33,34 as suggested by this study in relation to glucose intolerance.
It is important to note that the main limitation of this study was inherent to its cross-sectional design. It was not possible to determine cause and efect relationships, but rather, only asso-ciations could be reported. Another important limitation of this study was the fact that plasma HbA1c assays were not performed on the research subjects, because when this study was planned and conducted, performing plasma HbA1c assays as a screening test for non-diabetic individuals was not part of the usual recom-mendations. However, in January 2010, this evaluation started to be recommended as routine screening for glucose metabolism abnormalities by the American Diabetes Association.35 Unfortu-nately, it was not possible to include HbA1c evaluations in this study consequent to that recommendation, because the blood samples were no longer stored.
In the present study, the GTT proved to be an important diagnostic tool for glucose metabolism alterations, even among individuals who had normal FPG, when they showed risk con-ditions for developing diabetes mellitus. Since FPG as a screen-ing test was unable to detect glucose metabolism abnormalities in 8.0% of the research subjects, it suggests, in our opinion, that the GTT is well indicated for patients who present these risk condi-tions, regardless of having normal FPG.
Such indings may also suggest that the individuals who had normal FPG but abnormal GTT could be at an earlier stage
of glucose intolerance, which is the point at which prophylac-tic interventions should be adopted. Although some anthropo-metric, clinical and laboratory indings have been described as related to diabetes mellitus and prediabetic state, none except for GTT was able to screen for occurrences of glucose intolerance among subjects with normal FPG, in the present study.
CONCLUSION
In the sample studied, the prevalence of abnormal glucose metab-olism was as high as 68.0%. hese glucose metabmetab-olism abnormal-ities could be described as 8.0% for normal FPG but abnormal GTT, 23.9% for abnormal FPG but normal GTT, and 36.2% for elevation in both FPG and GTT. he patients in group 4 were older and presented more risk conditions for developing diabetes mellitus than did the individuals in group 1.
REFERENCES
1. American Diabetes Association. Diagnosis and classification of diabetes mellitus. Diabetes Care. 2009;32 Suppl 1:S62-7.
2. Wild S, Roglic G, Green A, Sicree R, King H. Global prevalence of diabetes: estimates for the year 2000 and projections for 2030. Diabetes Care. 2004;27(5):1047-53.
3. Ruderman NB, Williamson JR, Brownlee M. Glucose and diabetic
vascular disease. FASEB J. 1992;6(11):2905-14.
4. Sherwin RS. Diabetes mellitus. In: Goldman L, Ausiello D, editors. Cecil text book of Medicine. 22nd ed. Philadelphia: Saunders; 2004. p. 1658-92. 5. Valdez R, Seidell JC, Ahn YI, Weiss KM. A new index of abdominal
adiposity as an indicator of risk for cardiovascular disease. A cross-population study. Int J Obes Relat Metab Disord. 1993;17(2):77-82. 6. Ho SY, Lam TH, Janus ED; Hong Kong Cardiovascular Risk Factor
Prevalence Study Steering Committee. Waist to stature ratio is more
strongly associated with cardiovascular risk factors than other simple anthropometric indices. Ann Epidemiol. 2003;13(10):683-91. 7. Pitanga FJG, Lessa I. Indicadores antropométricos de obesidade como
instrumento de triagem para risco coronariano elevado em adultos
na cidade de Salvador – Bahia [Anthropometric indexes of obesity as an instrument of screening for high coronary risk in adults in the city of Salvador—Bahia]. Arq Bras Cardiol. 2005;85(1):26-31.
8. Sposito AC, Caramelli B, Fonseca FAH, et al. IV Diretriz Brasileira
sobre Dislipidemias e Prevenção de Aterosclerose. Departamento de Aterosclerose da Sociedade Brasileira de Cardiologia. Arq Bras Cardiol. 2007;88(supl. 1):2-19.
9. Rosenbaum P, Gimero SG, Sanudo A, et al. Independent impact of
glycemia and blood pressure in albuminuria on high-risk subjects for metabolic syndrome. Clin Nephrol. 2004;61(6):369-76.
10. Torquato MT, Montenegro Júnior RM, Viana LA, et al. Prevalence of diabetes mellitus and impaired glucose tolerance in the urban
population aged 30-69 years in Ribeirão Preto (São Paulo), Brazil. Sao Paulo Med J. 2003;121(6):224-30.
tolerance categories according to World Health Organization and American Diabetes Association diagnostic criteria in a population-based study in Brazil. The Japanese-Brazilian Diabetes Study Group.
Diabetes Care. 1998;21(11):1889-92.
12. Jelliffe DB. Evaluación del estado nutrición de la comunidad (con especial referencias a las encuestas em las regiones en desarrollo). Ginebra: Organización Mundial de la Salud; 1968.
13. Vieira MLC, Sproesser AJ. V Diretrizes Brasileiras de Hipertensão Arterial. Arq Bras Cardiol. 2007;89(3):e24-e79.
14. Pouliot MC, Després JP, Lemieux S, et al. Waist circumference and abdominal sagittal diameter: best simple anthropometric indexes
of abdominal visceral adipose tissue accumulation and related cardiovascular risk in men and women. Am J Cardiol. 1994;73(7):460-8. 15. World Health Organization. Definition, diagnosis and classification of
diabetes mellitus and its complications. Report of a WHO Consultation.
Part 1: Diagnosis and classification of Diabetes Mellitus. Geneva: World Health Organization; 1999. Available from: http://www.staff.ncl.ac.uk/ philip.home/who_dmg.pdf. Accessed in 2011 (Apr 4).
16. Hanley JA, McNeil BJ. A method of comparing the areas under
receiver operating characteristic curves derived from the same cases. Radiology. 1983;148(3):839-43.
17. Barbosa PJB, Lessa O, Almeida Filho N, Magalhães LBNC, Araújo J. Critério de obesidade central em população brasileira: impacto sobre a síndrome
metabólica [Criteria for central obesity in a Brazilian population: impact on metabolic syndrome]. Arq Bras Cardiol. 2006;87(4):407-14.
18. Expert Panel on Detection, Evaluation, and Treatment of High Blood Cholesterol in Adults. Executive Summary of The Third Report of The
National Cholesterol Education Program (NCEP) Expert Panel on Detection, Evaluation, And Treatment of High Blood Cholesterol in Adults (Adult Treatment Panel III). JAMA. 2001;285(19):2486-97. 19. Obesity: preventing and managing the global epidemic. Report of a WHO
consultation. World Health Organ Tech Rep Ser. 2000;894:i-xii, 1-253. 20. Han TS, van Leer EM, Seidell JC, Lean ME. Waist circumference action
levels in the identification of cardiovascular risk factors: prevalence study in a random sample. BMJ. 1995;311(7017):1401-5.
21. Velásquez-Meléndez G, Gazzinelli A, Côrrea-Oliveira R, Pimenta AM, Kac G. Prevalence of metabolic syndrome in a rural area of Brazil. Sao Paulo Med J. 2007;125(3):155-62.
22. Rodrigues SL, Baldo MP, Sá Cunha R, et al. Anthropometric measures
of increased central and overall adiposity in association with echocardiographic left ventricular hypertrophy. Hypertens Res. 2010;33(1):83-7.
23. Zhou Z, Hu D, Chen J. Association between obesity indices and blood
pressure or hypertension: which index is the best? Public Health Nutr. 2009;12(8):1061-71.
24. Decoda Study Group, Nyamdorj R, Qiao Q, et al. BMI compared with central obesity indicators in relation to diabetes and hypertension
in Asians. Obesity (Silver Spring). 2008;16(7):1622-35.
25. Nyamdorj R, Qiao Q, Söderberg S, et al. Comparison of body mass
stature ratio as a predictor of hypertension incidence in Mauritius. J Hypertens. 2008;26(5):866-70.
26. Vasques ACJ, Rosado LEFPL, Rosado GP, et al. Habilidade de
indicadores antropométricos e de composição corporal em identificar a resistência à insulina [Predictive ability of anthropometric and body composition indicators in the identification of insulin resistance]. Arq Bras Endocrinol Metab. 2009;53(1):72-9.
27. Hsieh SD, Yoshinaga H. Do people with similar waist circumference share similar health risks irrespective of height? Tohoku J Exp Med. 1999;188(1):55-60.
28. Gabir MM, Hanson RL, Dabelea D, et al. The 1997 American Diabetes
Association and 1999 World Health Organization criteria for hyperglycemia in the diagnosis and prediction of diabetes. Diabetes Care. 2000;23(8):1108-12.
29. Tirosh A, Shai I, Tekes-Manova D, et al. Normal fasting plasma
glucose levels and type 2 diabetes in young men. N Engl J Med. 2005;353(14):1454-62.
30. Shaw JE, Zimmet PZ, Hodge AM, et al. Impaired fasting glucose: how low should it go? Diabetes Care. 2000;23(1):34-9.
31. Tanne D, Koren-Morag N, Goldbourt U. Fasting plasma glucose and risk of incident ischemic stroke or transient ischemic attacks: a prospective cohort study. Stroke. 2004;35(10):2351-5.
32. Simons LA, Friedlander Y, McCallum J, Simons J. Fasting plasma glucose
in non-diabetic elderly women predicts increased all-causes mortality and coronary heart disease risk. Aust N Z J Med. 2000;30(1):41-7. 33. Thomas GN, Chook P, Qiao M, et al. Deleterious impact of “high normal”
glucose levels and other metabolic syndrome components on arterial
endothelial function and intima-media thickness in apparently healthy Chinese subjects: the CATHAY study. Arterioscler Thromb Vasc Biol. 2004;24(4):739-43.
34. Kim DJ, Kim KW, Cho NH, et al. The cutoff value of fasting plasma
glucose to differentiate frequencies of cardiovascular risk factors in a Korean population. Diabetes Care. 2003;26(12):3354-6.
35. American Diabetes Association. Diagnosis and classification of diabetes mellitus. Diabetes Care. 2010;33 Suppl 1:S62-9.
Sources of funding: None
Conflict of interest: None
Date of first submission: July 16, 2010
Last received: April 13, 2011
Accepted: April 20, 2011
Address for correspondence:
Lívia Nascimento Matos Av. Divino Salvador, 286/143 Moema — São Paulo (SP) — Brasil