The performance of the cities in the Health Pact
in the scope of the federative relations of the
Brazilian National Health System (SUS)
1
O desempenho dos municípios no Pacto pela Saúde no âmbito
das relações federativas do Sistema Único de Saúde
Abstract
This study evaluates the results of the Health Pact, which seeks to regulate the SUS’s federative rela-tions, regarding the achievement of the goals and the compliance with the agreements made by the federated entities considering national priorities and the actual performance of the cities in compara-tive terms. Some indicators of the Health Pact were selected for the period of 2007-2011 and sought to answer the following questions: (1) Have the cities fulilled what was agreed? How did this evolve in the period? (2) The effective performance of the cities has positively improved during the period? (3) What is the degree of inequality between cities in terms of performance? (4) Are the results associated with structural factors exogenous or endogenous to the health sector? Data from Datasus and Sispacto were used. Measures were developed to assess the degree of compliance with the agreed targets, to evaluate the actual performance of the cities and the degree of inequality between them. Regression models sought to gauge the inluence of structural factors on this performance. Results show that the pact has not extended the cooperation between federated entities; there were positive developments in the achieving the goals, particularly in the indicators with punitive mechanisms; the performance varies between indicators and is mainly associated with the availability of inancial resources.
Keywords: Federalism; Health Policy; Evaluation of Processes and Results.
Correspondence
Telma Maria Gonçalves Menicucci
Av. Antônio Carlos, 6.627, room 4.065. Belo Horizonte, MG, Brazil. CEP 31270-901.
Telma Maria Gonçalves Menicucci
Universidade Federal de Minas Gerais. Departamento de Ciência Política. Belo Horizonte, MG, Brazil.
E-mail: [email protected]
Alisson Maciel Faria Marques
Secretaria de Estado de Saúde de Minas Gerais. Belo Horizonte, MG, Brazil.
E-mail: [email protected]
Guilherme Andrade Silveira
Universidade Federal de Minas Gerais. Programa de
Pós-Graduação em Ciência Política. Belo Horizonte, MG, Brazil.
E-mail: [email protected]
348
Resumo
Este artigo avalia os resultados do Pacto pela Saúde (que busca regular as relações federativas do SUS) em relação ao alcance das metas e ao cumprimento das pactuações feitas pelos entes federados a partir de prioridades nacionais, além doo desempenho efetivo dos municípios em termos comparativos. Foram selecionados alguns indicadores do pacto para o período de 2007 a 2011, buscando-se respon-der às perguntas: (1) os municípios cumpriram o
que foi pactuado? Como isso evoluiu no período?
(2) o desempenho efetivo dos municípios evoluiu
positivamente durante o período? (3) qual o grau
de desigualdade entre os municípios quanto ao
desempenho? (4) os resultados estão associados a
fatores estruturais exógenos ou endógenos ao
se-tor saúde? Foram utilizados dados do Datasus e do
Sispacto. Construíram-se medidas para aferição do grau de cumprimento das metas pactuadas e para a avaliação do desempenho efetivo dos municípios e do grau de desigualdade entre eles. Modelos de
regressão buscaram aferir a inluência de fatores
estruturais sobre esse desempenho. Os resultados apontam que o pacto não ampliou a cooperação entre os entes federados. Houve, além disso, evolução positiva do cumprimento das metas, particularmente nos indicadores com mecanismos punitivos, e variação de desempenho entre indica-dores, associado principalmente à disponibilidade
de recursos inanceiros.
Palavras-chave: Federalismo; Política de Saúde;
Avaliação de Processos e Resultados.
The regulatory framework of the
federal relations in the SUS
This article presents research results that sought to evaluate the Health Pact, a set of insti-tutional reforms deined in 2006 and in force until 2011 (Brasil, 2006). The Pact marks a moment in the process of regulating the federal relations of the Brazilian National Health System (SUS), which has, among the challenges for its operation, speciicities arising from the federative context in which it is inserted.
SUS was created as a federative pact based in a cooperation conception among government spheres. Since its implementation, there has been a constant evolution of the regulatory framework of federative relations. In order to face one of the central dilemmas of federalism (to concile autonomy and interdependence of federated enti-ties), it has been tried to deine mechanisms and instruments of regulation that promote coopera-tion and coordinacoopera-tion, in order to guarantee uni-formity of policy and universality and integrality of attention (Menicucci, 2014a, 2014b, Menicucci et al., 2008), besides creating incentives to trans -fer responsibilities and combat competitive and predatory relations between the Union, states and cities.
Tripartite Inter-managers Committee (arena of agreement between the three federated entities).
In the 1990s, the focus of the regulation of federative relations fell on the process of de-centralization. The assembled institutional ap -paratus succeeded in this objective, but failed to achieve integration among the federated entities through the regionalization of care, as provided for in the Constitution (Fortes, 2008; Levcovitz, Lima, Machado, 2001; Mendes, 1998; Menicucci et al. Al., 2008). On the contrary, the rules of de -centralization, particularly those related to the transfer of resources, have made it dificult by overrating the role of the city as a service provider and undervalue the role of states as instances of
organization of management, inancing, supervi
-sion and control.
Secondly, the evolution of the regulatory framework expressed the attempt to implement the regionalization guideline, which, coupled with the hierarchy of asssistance by levels of care, required the articulation of managers to promote the integration of the service network that tran-scends the political-administrative areas of a city or a state. From 2001 on, norms and actions aimed at the regionalized organization of the health sec -tor had as one of their objectives to correct the distortions of “autarchic municipalism” and to replace the attitude of intermunicipal competition for cooperation in order to overcome barriers and differences in access between citizens of different locations (Machado, 2009).
To order the process, planning instruments were established, such as the Regionalization Master Plan, Integrated Pactual Programming and the Investment Master Plan. Although they initiated a federative integration effort, they were ineffective in articulating regional networks, breaking with the fragmentation resulting from municipalization and building a genuine health system, which eventually led to the reformula-tion of the regulatory framework in 2006, with the Health Pact. This denomination expresses the nodal point of the federative question, particularly in the case of health care: the need for agreement among federated entities. As a mechanism of regional management, the Pact reiterates the
previously and still ineffective instruments and establishes new arenas of institutionalized pacts (regional management boards) in order to solve the problems of collective action.
A third moment in the evolution of the regulatory framework of federal relations in SUS is marked by Presidential Decree no. 7.508/2011, which con -solidates ongoing processes and seeks to ensure the commitment of federated entities to comprehensive health care, emphasizes the construction of federa -tive pacts for the formation of resolu-tive attention networks and clariies the responsibilities of feder -ated entities through the Organizational Contract of Public Action. In addition to the decree, Law no. 12.666/2011 recognizes and institutionalizes the deliberative competence of the inter-managers committee (CIB and CIT) as federative coordination spaces and establishes a regional committee (CIR). These committes are now recognized not just as forums, but as decision marking bodies, formally assuming the need for federative articulation when changing their legal status.
A Health Pact evaluation
A research with the main actors that participat -ed in the formulation of the Pact, having as main locus the Tripartite Inter-managers Committee (CIT), allowed identifying the different points of view present in the federative arena, the motiva-tions of the different actors, federal conlicts, divergences and collisions2. The initial focus of the proposal, originated in the Ministry of Health (MS), was in the deinition of shared management mechanisms between federative entities within territories. Throughout its formulation process, and in the inability to resolve conlicts, the Pact lost that emphasis and focused on accountability for commitments and targets to be “agreed upon”, while maintaining the objective of improving management, but not from a federative perspec-tive, in a clear emptying of the original concept.
At the same time, there was a formal extension of its scope with the inclusion of two new dimen-sions, being formulated with three components: the Pact for Life, a commitment among manag -ers around priorities with impact on the health situation; The Management Pact, to reinforce the strategy of “shared and solidary management”; and the Pact in Defense of SUS, to reinforce SUS as State policy and establish commitments for the consolidation of constitutional principles.
Even though in an often bureaucratic way, there was gradual adherence of the cities to the Pact, which reached the adhesion of 82.5% of them. But little progress has been made towards the organization of regionalized attention net -works. As a federative program, the Pact did not extend cooperation between the federated enti-ties and was extinguished only ive years after its formulation.
More general evaluations of the Pact were carried out within the scope of management of SUS, but, in relation to the achievement of tar-gets and compliance with agreements, there are no published analyses. This is the scope of this article, which aims to evaluate some measurable
2 MENICUCCI, T. M. G.; COSTA, L. A.; MACHADO, J. A. Pacto pela saúde: aproximações e colisões na arena federativa. Ciência & Saúde Coletiva, Rio de Janeiro, in press. Available from: <https://goo.gl/lGHwqp> Access on: April 26th, 2017.
results of the Pact for Life and for Management Pact, which deine health and management goals to be agreed and reached by the federated entities from national priorities, translated into indicators deined by the MS.
Based on the selection of some of these indi-cators for the 2007-2011 period, and considering the cities as the unit of analysis, we sought to answer the following four questions: (1) Have the cities complied with what was agreed, and how did the process evolve in the period of the Pact? (2) Did the effective performance of cities evolve positively in the period? (3) What is the degree of inequality among cities in relation to their performance? (4) Are the results associated with structural factors exogenous to the health sector (socioeconomic conditions and inancing capacity), or endogenous, but with low management interfer-ence such as installed capacity to provide services? To answer the first two questions, we selected indicators of the Pactfor Life and Management Pact, using secondary data, obtained from the Department of Information Technology of the Brazilian National Health System (Datasus) and the Information System of the Pact for Health (Sispacto). For the selection, two criteria were adopted: (1) permanence of the indicator through-out the period to allow diachronic analysis, since the indicators variedannually, either by program accommodations or changes in priorities (on average, the number of indicators was 48, with an annual variation of 40 to 54); indicators that changed names, but the formula remained the same, were selected; (2) missing data below 30%, to guarantee robustness to the analysis (Viegas et al., 2007).
to the activities developed to achieve the planned objectives; the result indicators are demonstra-tions of the consequent effects of the interven-tions performed (Bittar, 2001; Donabedian, 1994;
Martins; Blais; Leite, 2004). The selected indica -tors were used both to assess the achievement of agreed targets and to evaluate the performance of cities.
Chart 1 – Selected Indicators of the Health Pact, Brazil, 2007-2011
No. Abreviation Indicator Sources Polarity Nature
1 Prenatal Proportion of live born babies of mothers with
four or seven or more prenatal visits* Sinasc Higher
Process/ Result
2 Tetravalent Vaccination coverage with tetravalent DTP+Hib
vaccine in children under one year of age PNI/Sinasc Higher Process
3 CNES Regular CNES database feed rate CNES Higher Process
4 Cytopathological
Ratio between cervix cytopathological examinations in the age group of 25 to 59 years and the target population
Siscolo/IBGE Higher Process
5.a Infant mortality Infant mortality rate (cities with 80 thousand
inhabitants or more) SIM/Sinasc Lower Result
5.b Infant mortality
Absolute number of deaths of children under one year of age (cities with less than 80 thousand inhabitants)
YES Lower Result
6.a Neonatal mortality
Neonatal mortality rate (cities with 80
thousand inhabitants or more) SIM/Sinasc Lower Result
6.b Neonatal mortality
Absolute number of deaths of resident children under 28 days of age (cities with less than 80 thousand inhabitants)
YES Lower Result
7 Diabetes
Rate of hospitalization for SUS for diabetes mellitus and its complications in the population aged 30 to 59 years
SIH/SUS – IBGE Lower Result
8 EC29 Percentage of own revenue applied in health
– EC 29/2000 Siops Higher Process
9 ESF Proportion of the population enrolled in the
Family Health Strategy Siab/IBGE Higher Process
10 CVA SUS hospitalization rate for cerebrovascular
accident in the population aged 30 to 59 years SIH/SUS – IBGE Lower Result
11 Malaria Annual parasite malaria index (only for cities in the Legal Amazon)
Sivep-Malária/
SINAM/ IBGE Lower Result
Source: Datasus, 20133.
* In the 2007-2009period, the target was four consultations and, as of 2010, there were seven consultations. The indicator was calculated considering the target of each year, according to the current regulations.
The irst question is answered in the next sec -tion; the others, in the following section, in which the effective performance of cities in relation to health care and situation is evaluated, identify-ing the inequalities between them and relatidentify-ing this performance to structural factors that may affect the results. The description of the speciic methodology is done in each section. The last sec-tion presents some conclusions.
Evolution of compliance with agreements
To analyze the fulilment of the pact, the per -centage of compliance with the targets for each indicator was calculated according to the formula:
Compliance (%)= reached value
target x 100
When the indicator was of the “lower, the bet -ter” type, the results were reversed. For the agreed targets, data from the Sispacto were used, and the values reached by the cities were extracted from Datasus. The data declared by the cities themselves
and that presented a discrepancy in relation to Datasus were disregarded. Because they did not present a normal distribution, data were normal-ized from the normalnormal-ized interquartile range, which reconstructs maximum and minimum limits from the median plus or minus one-half times the difference between the irst and the third quartiles in each indicator. Thus, the data were homogenized with the exclusion of extreme values.
To group similar conditions and simplify the presentation of the data, values from 0.00 to 1.00 were assigned according to the percentage achievement intervals of the goals: up to 59.9% = 0.00; From 60% to 69.9% = 0.25; 70% to 79.9% = 0.50; From 80% to 89% = 0.75; 90% or more = 1.00. The values attributed to each indicator were added, generating for each city a inal note of max -imum value 10 (except for 711 cities belonging to the Legal Amazon, which may reach note 11). This note expresses, briely, the degree of compliance of the agreement in a given year. Graph 1 shows the percentage of cities in banknote ranges, with scores lower than ive were grouped in the range of 0 to 4.99 due to low frequency.
Graph 1 – Percentage of cities by note range and year, Brazil, 2007-2011
100 3.8
13.9
23.7
26.9
20.9
10.7
10.8
18.9
23.6
23.3
15.1
8.4
13.1
21.4
26.6
21.6
12.3 5.0
15.0
19.8
24.2
22.1
12.5
6.4
19.9
19.1
23.8
0.00 a 4.99 5.00 a 5.99 6.00 a 6.99 7.00 a 7.99 8.00 a 8.99 9.00 ou mais
25.1
15.7
6.4
80
60
40
20
0
2007 2008 2009 2010 2011
The compliance proile of the agreement chang -es over the years. The high-est scor-es (above eight) show a positive evolution (albeit with a signiicant decrease in the last year of the series) simultane-ously with the decrease of the lowest ones (less
than six). Intermediate groups (between six and eight), although showing luctuations, return, in 2011, to the same level of 2007.
goals and their subsequent evaluation may have affected the behavior of the cities, which gradu-ally presented higher grades. In 2007, only 18% of cities scored higher than 8; in 2010, this percent -age increased to about 35%; only in 2011 (29%), when there is a general deterioration in meeting the targets, there is a slight decline. This result does not necessarily mean that there has been an improvement in health care provided nor in the health of the inhabitants, but it may indicate improvement in the capacity to deine the goals themselves, based on a better knowledge of the capacities of each city.
It can be assumed that the MS had some suc-cess in the objective of gradually inscribing in the municipal agendas the knowledge of nationally deined priorities, since an ever smaller propor -tion of cities obtained lower scores (less than six) over the period: from 32% in 2007 to 19% in 2010, with a slight worsening in 2011 (22%). One hypothesis would be that the Pact systematized a periodic monitoring and evaluation process that, to a certain extent, constrained the subnational federated entities that had to learn minimally about the indicators themselves. However, the effects seem to be partial, since approximately half of the cities presented stable behavior in the period, remaining with intermediate scores.
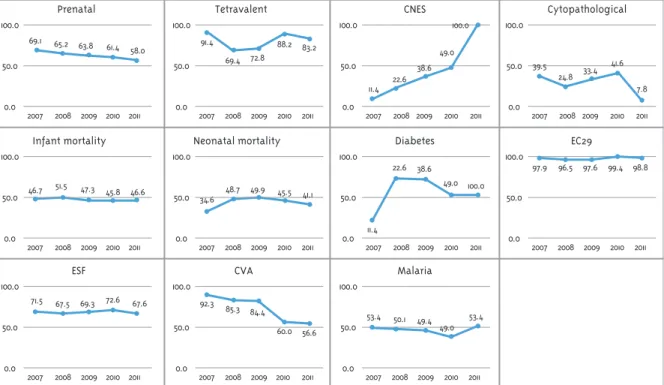
Global results hide important differences between indicators. Figure 1 summarizes the evo -lution of the percentages of cities that obtained value 1.00 (90% or more of meeting the target), that is, those that reached the agreed targets. Each indicator has its own evolution, with no pattern among them.
Two factors allow the elaboration of hypoth-eses to explain the greater fulfillment of the goals in some indicators. The irst is the existence of legal and normative incentives whose non-compliance can generate strong penalties for the federated entities. This explains the results in the indicators of resource utilization according to Constitutional Amendment Number 29 (above 95% of cities met the goal in all years) and data from the National Register of Health Establishments (CNES) – in a growing escalation, 100% of cities met the targets in 2011. In the irst case, because
the constitutional amendment that deined the minimum percentages to be applied in health had been in force since 2000, establishing the percentage of 15% of own resources for the cities. In the case of CNES feeding, the incentive comes from Administrative Rule MS/GM no. 373/2002 and its amendments, which established the im-mediate suspension of the MS’s monthly inancial transfers for the cities that fail to comply with the obligation to feed the national databases for two consecutive months or three alternate months, “fund for fund”. This means that subna-tional entities can suffer a inancial penalty for non-compliance.
This hypothesis, however, cannot explain the results that were achieved in the other indica-tors. In these cases, a second hypothesis would be the greater facilitator to meet targets when they depend only on the individual efforts of each city and are independent of the cooperation of other federated entities or the performance of other independent actors, such as service providers. If the dependency is greater, the proportion of cities that meet the agreed goals decreases. In this sense, indicators such as tetravalent vaccina-tion coverage and coverage of the Family Health Strategy (ESF), although presenting signiicant percentages of compliance with the goals, varying between 80% and 70% of the cities, respectively, have lower results than other indicators, such as EC29 and CNES. Possibly, the worst relative result is due, in the irst case, to the dependence of the population’s willingness to be vaccinated and, secondly, to the need to be able to ix health professionals, something more dificult in distant areas (Menicucci, 2014b).
external to the health sector. Examples include infant mortality rate and malaria control, indica-tors that are associated with living conditions in general and influenced by various elements, such as public policies in other areas (education, ba-sic sanitation) and deforestation of the Amazon Forest, respectively. Atypical case was the “ratio of cytopathological examinations,” which did not show a uniform behavior, with a large drop in the last year analyzed (a bad result, because it is an examination for the prevention of female cancer).
To some extent, the alternative hypothesis also helps to explain the compliance indicators of EC29 and CNES feeding. In the irst case, municipal man -agement needs only its own effort to meet the goal: political disposition, regular control of municipal inances, and minimal administrative capacity are suficient to ensure good performance without rely -ing on another federated entity or service provider. In the case of CNES, it is enough to organize the process of sending the iles to the MS, although this does not necessarily mean quality of information.
Figure 1 – Percentage of cities, per year, that obtained a value of 1.00* in each indicator separately, Brazil, 2007-2011
Prenatal
100.0
50.0
0.0
2007 2008 2009 2010 2011 69.1 65.2 63.8
61.4 58.0
Cytopathological CNES
Tetravalent
100.0
50.0
0.0
2007 2008 2009 2010 2011 91.4
69.4 72.8
88.2 83.2
100.0
50.0
0.0
2007 2008 2009 2010 2011 11.4 22.6
38.6 49.0
100.0 100.0
50.0
0.0
2007 2008 2009 2010 2011 39.5
24.8 33.4 41.6
7.8
Infant mortality
100.0
50.0
0.0
2007 2008 2009 2010 2011 46.7 51.5 47.3 45.8 46.6
EC29 Diabetes
Neonatal mortality
100.0
50.0
0.0
2007 2008 2009 2010 2011 34.6 48.7 49.9 45.5
100.0
50.0
0.0
2007 2008 2009 2010 2011 11.4
22.6 38.6
49.0 100.0
100.0
50.0
0.0
2007 2008 2009 2010 2011 97.9 96.5 97.6 99.4 98.8
ESF
100.0
50.0
0.0
2007 2008 2009 2010 2011 71.5 67.5 69.3 72.6 67.6
Malaria CVA
100.0
50.0
0.0
2007 2008 2009 2010 2011 92.3
85.3 84.4
60.0 56.6
100.0
50.0
0.0
2007 2008 2009 2010 2011 53.4 50.1 49.4
49.0 53.4 41.1
*The city receives the value of 1.00 when it reaches 90% or more of achievement of the agreed goal.
Cities performance in the 2007-2011
period
In this section, the focus of the analysis shifts from compliance with the agreements to the ac-tual results achieved in the Pact indicators. This performance is analyzed both in the diachronic
To do so, two measures were constructed. The irst compares the performance of the city over the period, taking as a parameter the national targets established for the last year of the series (2011). From this performance, cities were classiied into four positions: (1) performance below 75% of the national target; (2) performance between 75% and 100% (exclusive) of the national target; (3) performance between 100% (inclusive) and 125% of the national target; (4) performance equal to or greater than 125% of the national target.
For infant and neonatal mortality, whose goals are to reduce by a percentage the value reached in the previous year, the World Health Organization parameter was used: values less than 10 deaths per thousand live births for cities with 80 thousand inhabitants or more. For those with less than 80 thousand inhabitants, in which the indicator con-siders the number of deaths per year, there being no parameter of what is desirable, it was considered the variation of 1 death to deine the performance bands. As a second measure, to analyze the inequality between cities, the Gini coeficient was calculated from the values observed in the indicators. The Gini is a measure of inequality of any distribution, in-cluding health (Schneider, 2002), although it is more commonly used to measure income inequality4.
Finally, in order to identify possible explana-tory factors, the performance of cities was related
4 Arretche (2016), for example,compares inequalities between cities in relation to the results of social policies, and Soares (2006) measures inequalities in education.
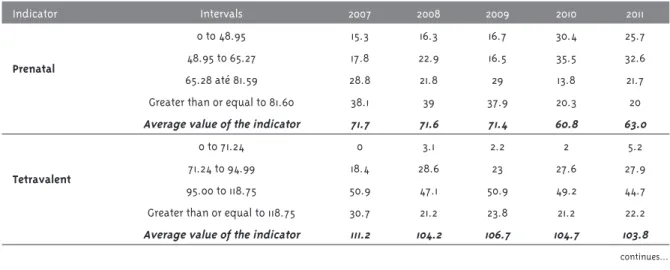
Table 1 – Cities performance based on national targets for 2011, per year, according to indicators, Brazil, 2007-2011
Indicator Intervals 2007 2008 2009 2010 2011
Prenatal
0 to 48.95 15.3 16.3 16.7 30.4 25.7
48.95 to 65.27 17.8 22.9 16.5 35.5 32.6
65.28 até 81.59 28.8 21.8 29 13.8 21.7
Greater than or equal to 81.60 38.1 39 37.9 20.3 20
Average value of the indicator 71.7 71.6 71.4 60.8 63.0
Tetravalent
0 to 71.24 0 3.1 2.2 2 5.2
71.24 to 94.99 18.4 28.6 23 27.6 27.9
95.00 to 118.75 50.9 47.1 50.9 49.2 44.7
Greater than or equal to 118.75 30.7 21.2 23.8 21.2 22.2
Average value of the indicator 111.2 104.2 106.7 104.7 103.8 to structural factors, exogenous or endogenous to the health sector, that affect the capacity to pro-vide services and, therefore, on the performance of cities, and do not depend on the direct action of managers. These factors were organized into two groups of indicators: (1) indicators of installed capacity(Datasus, CNES, IBGE): total beds per thousand inhabitants (monthly average), SUS beds per thousand inhabitants Monthly average), total physicians per thousand inhabitants (monthly average), SUS physicians per thousand inhabit-ants (monthly average); (2) inancial indicators
(Datasus, Siops): Municipal GDP per capita, tax revenues and constitutional transfers per capita, total health expenditure per capita, percentage of own health expenditure and own expenses in health per inhabitant.
Due to the multicollinearity (strong correlation between explanatory variables), three of these fac-tors were excluded from the analysis: total beds and physicians per thousand inhabitants and own health expenses per inhabitant. The multiple linear regression method was adopted, with mu-nicipal performance as the dependent variable and, as explanatory variables, the structural factors.
Results show that the performance was quite varied between indicators and between cities. Most of indicators presented a slightly positive evolution, as shown in Table 1.
Indicator Intervals 2007 2008 2009 2010 2011
CNES
0 to 74.99 79 63.1 48.3 39.5 0
75.00 to 99.99 9.5 24.1 26.7 23.8 0
100.00 to 124.99 11.5 12.8 25 36.7 100
Greater than or equal to 125.00 0 0 0 0 0
Average value of the indicator 29.6 46.2 57.9 69.0 100
Cytopathological
0 to 0.16 30.2 33 25.5 29.3 61
0.17 to 0.22 20.3 23.6 22.4 24.9 21.5
0.23 to 0.28 18.9 20.5 22.1 20.9 11.3
Greater than or equal to 0.29 30.6 22.9 30 24.8 6.2
Average value of the indicator 0.2 0.2 0.2 0.2 0.1
Infant mortality**
Greater than or equal to 12.50 68.4 64.8 62.3 55.5 52.1
10.00 to 12.49 21.1 23.3 21.8 26.1 29.5
7.50 to 9.99 7.7 9.6 14.4 14.6 14.2
0 to 7.49 2.8 2.3 1.4 3.9 4.2
Average value of the indicator 3.9 3.8 3.6 3.4 3.4
Infant death*
Greater than or equal to 3.00 46.8 46.1 43.5 40.9 41.5
2 13.8 13.3 13.2 14.8 13.5
1 17.8 18.8 19.6 19.3 19.7
0 21.6 21.9 23.7 25 25.3
Neonatal mortality**
Greater than or equal to 12.50 25.4 22.4 18.4 17.4 16.4
10.00 to 12.49 23.9 21.2 24.6 22.4 19.5
7.50 to 9.99 30.5 34.3 33.7 34.7 34.5
0 to 7.49 20.2 22.1 23.2 25.5 29.5
Average value of the indicator 2.8 2.5 2.5 2.3 2.3
Neonatal death*
Greater than or equal to 3.00 33 31.9 30.9 28.9 28.8
2 13.2 13.5 12.8 12.5 13
1 20.3 20.6 20.8 20.7 21
0 27.3 27.8 29.2 31.4 30.7
Diabetes
Greater than or equal to 7.14 46.5 42.4 45.8 45.9 44.9
5.71 to 7.13 7.6 7.9 7.8 7.5 8
4.28 to 5.70 8 8.3 8.2 7.8 7.7
0 to 4.27 37.9 41.4 38.2 38.8 39.3
Average value of the indicator 8.3 7.7 8.1 8.3 8.0
EC29
0 to 11.24 0.3 0 0 0 0
11.25 to 14.99 0.6 0.8 0.2 0.4 0.6
15.00 to 18.74 52.1 48.3 43.4 43.2 48.9
Greater than or equal to 18.75 46.5 50 56.1 56 49.7
Average value of the indicator 19.2 19.5 20.0 20.0 19.5 Table 1 – Continuation
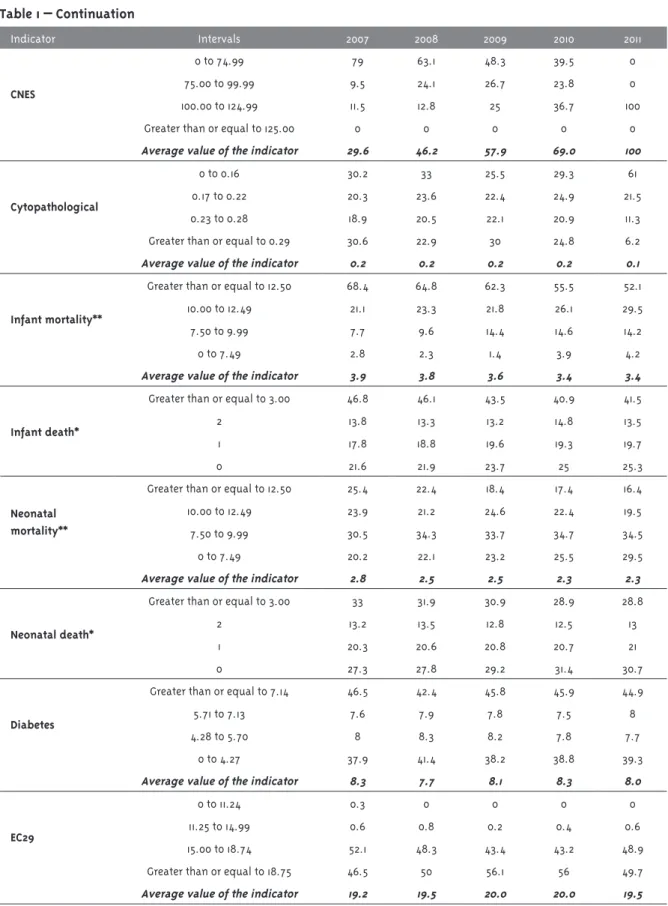
Table 1 – Continuation
The CNES case calls attention to the surprising improvement: in 2011, all cities reached the national target, although at the moment of implementation of the Pact this proportion was only 11.5%. This evo -lution is explained by the possibility of sanction and conirms the general rule that, through positive or negative incentives, the Union can affect the behav-ior of the federated entities; in this case, inducing cities to produce information that contributes to the management of the health system.
In the other indicators, the performance was worse or irregular in the period in most of the cities. It is curious that in the case of other process indi-cators, performance luctuates signiicantly in the period or signiicantly worsens in the last two years or in the last year of the series: the tetravalent cover-age falls from the percentcover-age of more than 80% of the cities meeting or exceeding the national target in 2007 to 66.9% in 2011. It should be noted, how -ever, that more than 20% of cities exceed the 100% target, which can be explained both by the universal nature of the SUS, which allows the dispersion of vaccination for various reasons (travel, availability of the service), and due to the fact that most of the cities are small, making the application of few doses
more strongly impact the indicator, given the low denominator. In prenatal care, there is a signiicant worsening from 2010, when 66% of the cities reach below the national goal, rising to 58% the following year. This fall can be explained by the change in the indicator that from 2010 onwards considers seven queries and not four more. Regarding the perfor-mance of cytopathological tests, the perforperfor-mance in the two bands below the national goal goes from 50% to more than 80% of the cities in 2011.
Indicators measuring infant mortality point to negative results, taking into account the parameters considered: even with a signiicant improvement in the proportion of cities with a rate equal to or above the national target, more than half still had low per-formance at the end of the period, and approximate-ly 80% were below WHO parameters considered appropriate. A little more favorable situation was veriied in relation to the infant death, with about 40% of the cities in the upper performance bands.
Neonatal mortality shows a gradual improvement, and in 2011, 64% of cities presented rates equal to or above the national target. In this case, the outcome is signiicantly affected by the performance of the health system, while infant mortality relects more general
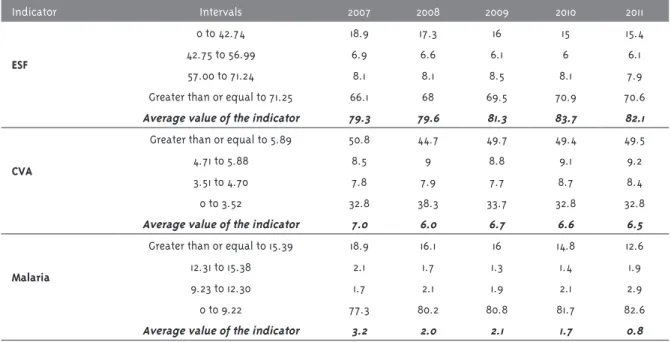
Indicator Intervals 2007 2008 2009 2010 2011
ESF
0 to 42.74 18.9 17.3 16 15 15.4
42.75 to 56.99 6.9 6.6 6.1 6 6.1
57.00 to 71.24 8.1 8.1 8.5 8.1 7.9
Greater than or equal to 71.25 66.1 68 69.5 70.9 70.6
Average value of the indicator 79.3 79.6 81.3 83.7 82.1
CVA
Greater than or equal to 5.89 50.8 44.7 49.7 49.4 49.5
4.71 to 5.88 8.5 9 8.8 9.1 9.2
3.51 to 4.70 7.8 7.9 7.7 8.7 8.4
0 to 3.52 32.8 38.3 33.7 32.8 32.8
Average value of the indicator 7.0 6.0 6.7 6.6 6.5
Malaria
Greater than or equal to 15.39 18.9 16.1 16 14.8 12.6
12.31 to 15.38 2.1 1.7 1.3 1.4 1.9
9.23 to 12.30 1.7 2.1 1.9 2.1 2.9
0 to 9.22 77.3 80.2 80.8 81.7 82.6
Average value of the indicator 3.2 2.0 2.1 1.7 0.8
Graph 2 – Gini index of the performance of cities in selected indicators of the Health Pact, Brazil, 2007-2011 0.6655 0.6611 0.5734 0.5393 0.5144 0.4755 0.2896 0.2309 0.1467 0.0953 0.0940 0.6705 0.5633 0.5424 0.5283 0.4954 0.4748 0.2709 0.1921 0.1506 0.0957 0.0967 0.6649 0.6572 0.6940 0.5724 0.5560 0.5057 0.4736 0.3843 0.2470 0.1794 0.1512 0.0991 0.0929 0.5875 0.5650 0.5146 0.4569 0.2766 0.2379 0.2097 0.1764 0.1019 0.0919 0.5813 0.5639 0.5130 0.4616 0.3294 0.1820 0.1689 0.1070 0.0962 0.0000 Malaria Neonatal mortality Infant mortality Diabetes CVA Cytopathological Prenatal
ESF (verificar comentário na Tabela 1) Tetravalent EC29 CNES 1.0000 0.9000 0.8000 0.7000 0.6000 0.5000 0.4000 0.3000 0.2000 0.1000 0.0000
2007 2008 2009 2010 2011
conditions of life outside the system. The results sug-gest effective improvement of performance in most cities, but still far from a desirable situation.
In the indicators that measure hospitalization rates for diabetes mellitus and its complications or for CVA, the results are similar and with little variation. Although there is a signiicant percent -age of cities with performance equal to or above the national target (more than 40%), the highest concentration is in the lowest performance range and these results remain constant throughout the period. Although it is beyond the scope of this study to evaluate the indicators of the Pact, it is worth emphasizing the controversies about them. The hospitalizations for these reasons are usually used as indicators of access and quality of primary
care, which, if ineffective, can lead to hospitalization due to aggravation of chronic diseases (Alfradique et al., 2009). However, the opposite may occur, and the greater coverage by the FHT can facilitate necessary hospitalizations in regions lacking health services, generating demand for hospital services (Mafra, 2011; Oliveira; Travassos; Carvalho, 2004).
The second step was to identify the degree of inequality among cities from the Gini coeficient. Regarding performance in selected indicators of the Pact for Health, there was, in general, some stability in the inequality index, except for the CNES, which reached zero in 2011. In the indicator for cytopathological exams, there was an increase in inequality in the period of approximately 13%, as shown in Graph 2.
The highest inequality is observed in the annual parasite malaria index for the cities of the Legal Amazon, with Gini above 0.60 during the whole period, followed by rates of infant and neonatal mortality, hospitalizations for diabetes (above 0.50), and hospitalizations for CVA (greater than 0.45).
In other indicators, inequality among cities was below 0.20.
5 The indicators used refer to the performance of the cities in prenatal, tetravalent, CNES, cytopathologic, infant mortality, infant death, neonatal mortality, neonatal death, diabetes, EC29, ESF, CVA and malaria, having as reference the national targets for 2011. 6 Indicators considered: SUS beds per thousand inhabitants (monthly average), SUS physicians per thousand inhabitants (monthly
average), municipal GDP per capita, tax revenues and constitutional transfers per inhabitant, total health expenditure per inhabitant, and percentage of own expenses in health.
7 In addition to the traditional model, a model with the standardized coeficients was elaborated, which allows comparing the impact of the variables on the performance of the cities.
dependent variable municipal performance indica-tors5 and, as explanatory variables, the structural fac-tors, related to the installed and inancial capacity6. A irst model used a synthetic performance indica -tor in the form of an index ranging from 0 to 100, being the result of the arithmetic mean of all indi-cators. Other models considered separately each performance indicator.
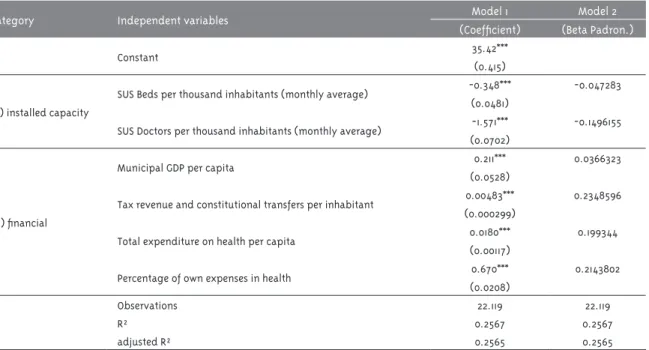
The results of the irst regression model, using the synthetic index (mean of the performance indicators), indicate that all the independent variables considered are highly significant to explain the performance of cities (Table 2). The revenue from constitutional taxes and transfers, the percentage of own health
expenditures and total health expenditure, are, in descending order, the factors with greater explanatory power, according to the standardized beta analysis. This indicates that the availability of inancial, gen -eral and speciic health resources is the dimension that impacts the performance with greater intensity.
Factors related to installed capacity (availability of hospital beds and doctors) had a negative and lower relation with performance, which may help explain the low explanatory power of the model (R2=0.2565). This suggests that other factors not considered, such as political guidelines, demand for care, and the regional dynamics of health care also affect the performance of cities.
Table 2 – Models of linear regression with synthetic indicator of municipal performance in the Life Pact and Management Pact as dependent variable, Brazil, 2007-20117
Category Independent variables Model 1 Model 2
(Coeficient) (Beta Padron.)
Constant 35.42***
(0.415)
(a) installed capacity
SUS Beds per thousand inhabitants (monthly average) -0.348*** -0.047283 (0.0481)
SUS Doctors per thousand inhabitants (monthly average) -1.571*** -0.1496155 (0.0702)
(b) inancial
Municipal GDP per capita 0.211*** 0.0366323
(0.0528)
Tax revenue and constitutional transfers per inhabitant 0.00483*** 0.2348596 (0.000299)
Total expenditure on health per capita 0.0180*** 0.199344
(0.00117)
Percentage of own expenses in health 0.670*** 0.2143802
(0.0208)
Observations 22.119 22.119
R² 0.2567 0.2567
adjusted R² 0.2565 0.2565
Obs: Robust standard errors in parentheses. * Signiicant at the 90% level – for two-tailed tests. ** Signiicant at the 95% level.
** Signiicant at the 99% level.
continues...
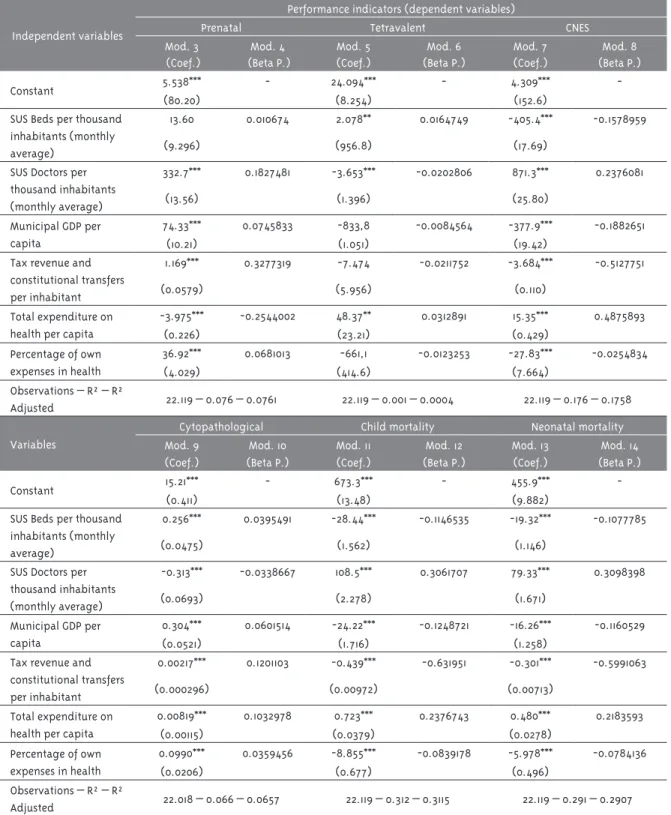
Table 3 – Models of linear regression with municipal performance indicators in the Life Pact and Management Pact as dependent variables, Brazil, 2007-20118
Independent variables
Performance indicators (dependent variables)
Prenatal Tetravalent CNES
Mod. 3
(Coef.)
Mod. 4
(Beta P.)
Mod. 5
(Coef.)
Mod. 6
(Beta P.)
Mod. 7
(Coef.)
Mod. 8
(Beta P.)
Constant 5.538*** - 24.094*** - 4.309***
-(80.20) (8.254) (152.6)
SUS Beds per thousand inhabitants (monthly average)
13.60 0.010674 2.078** 0.0164749 -405.4*** -0.1578959
(9.296) (956.8) (17.69)
SUS Doctors per
thousand inhabitants (monthly average)
332.7*** 0.1827481 -3.653*** -0.0202806 871.3*** 0.2376081
(13.56) (1.396) (25.80)
Municipal GDP per capita
74.33*** 0.0745833 -833,8 -0.0084564 -377.9*** -0.1882651
(10.21) (1.051) (19.42)
Tax revenue and
constitutional transfers
per inhabitant
1.169*** 0.3277319 -7.474 -0.0211752 -3.684*** -0.5127751
(0.0579) (5.956) (0.110)
Total expenditure on health per capita
-3.975*** -0.2544002 48.37** 0.0312891 15.35*** 0.4875893
(0.226) (23.21) (0.429)
Percentage of own expenses in health
36.92*** 0.0681013 -661,1 -0.0123253 -27.83*** -0.0254834
(4.029) (414.6) (7.664)
Observations – R² – R²
Adjusted 22.119 – 0.076 – 0.0761 22.119 – 0.001 – 0.0004 22.119 – 0.176 – 0.1758
Variables
Cytopathological Child mortality Neonatal mortality Mod. 9
(Coef.)
Mod. 10
(Beta P.)
Mod. 11
(Coef.)
Mod. 12
(Beta P.)
Mod. 13
(Coef.)
Mod. 14
(Beta P.)
Constant 15.21*** - 673.3*** - 455.9***
-(0.411) (13.48) (9.882)
SUS Beds per thousand inhabitants (monthly average)
0.256*** 0.0395491 -28.44*** -0.1146535 -19.32*** -0.1077785
(0.0475) (1.562) (1.146)
SUS Doctors per
thousand inhabitants (monthly average)
-0.313*** -0.0338667 108.5*** 0.3061707 79.33*** 0.3098398
(0.0693) (2.278) (1.671)
Municipal GDP per capita
0.304*** 0.0601514 -24.22*** -0.1248721 -16.26*** -0.1160529
(0.0521) (1.716) (1.258)
Tax revenue and
constitutional transfers
per inhabitant
0.00217*** 0.1201103 -0.439*** -0.631951 -0.301*** -0.5991063
(0.000296) (0.00972) (0.00713)
Total expenditure on health per capita
0.00819*** 0.1032978 0.723*** 0.2376743 0.480*** 0.2183593
(0.00115) (0.0379) (0.0278)
Percentage of own expenses in health
0.0990*** 0.0359456 -8.855*** -0.0839178 -5.978*** -0.0784136
(0.0206) (0.677) (0.496)
Observations – R² – R²
Adjusted 22.018 – 0.066 – 0.0657 22.119 – 0.312 – 0.3115 22.119 – 0.291 – 0.2907
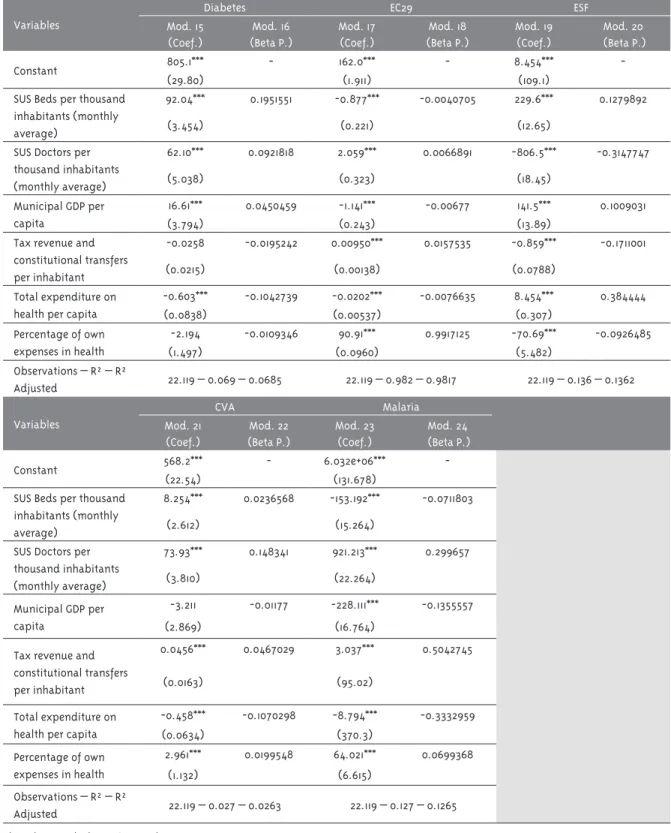
Table 3 – Continuation
Variables
Diabetes EC29 ESF
Mod. 15
(Coef.)
Mod. 16
(Beta P.)
Mod. 17
(Coef.)
Mod. 18
(Beta P.)
Mod. 19
(Coef.)
Mod. 20
(Beta P.)
Constant 805.1*** - 162.0*** - 8.454***
-(29.80) (1.911) (109.1)
SUS Beds per thousand inhabitants (monthly average)
92.04*** 0.1951551 -0.877*** -0.0040705 229.6*** 0.1279892
(3.454) (0.221) (12.65)
SUS Doctors per
thousand inhabitants (monthly average)
62.10*** 0.0921818 2.059*** 0.0066891 -806.5*** -0.3147747
(5.038) (0.323) (18.45)
Municipal GDP per capita
16.61*** 0.0450459 -1.141*** -0.00677 141.5*** 0.1009031
(3.794) (0.243) (13.89)
Tax revenue and
constitutional transfers
per inhabitant
-0.0258 -0.0195242 0.00950*** 0.0157535 -0.859*** -0.1711001
(0.0215) (0.00138) (0.0788)
Total expenditure on health per capita
-0.603*** -0.1042739 -0.0202*** -0.0076635 8.454*** 0.384444
(0.0838) (0.00537) (0.307)
Percentage of own expenses in health
-2.194 -0.0109346 90.91*** 0.9917125 -70.69*** -0.0926485
(1.497) (0.0960) (5.482)
Observations – R² – R²
Adjusted 22.119 – 0.069 – 0.0685 22.119 – 0.982 – 0.9817 22.119 – 0.136 – 0.1362
Variables
CVA Malaria
Mod. 21
(Coef.)
Mod. 22
(Beta P.)
Mod. 23
(Coef.)
Mod. 24
(Beta P.)
Constant 568.2*** - 6.032e+06***
-(22.54) (131.678)
SUS Beds per thousand inhabitants (monthly average)
8.254*** 0.0236568 -153.192*** -0.0711803
(2.612) (15.264)
SUS Doctors per
thousand inhabitants (monthly average)
73.93*** 0.148341 921.213*** 0.299657
(3.810) (22.264)
Municipal GDP per capita
-3.211 -0.01177 -228.111*** -0.1355557
(2.869) (16.764)
Tax revenue and
constitutional transfers
per inhabitant
0.0456*** 0.0467029 3.037*** 0.5042745
(0.0163) (95.02)
Total expenditure on health per capita
-0.458*** -0.1070298 -8.794*** -0.3332959
(0.0634) (370.3)
Percentage of own expenses in health
2.961*** 0.0199548 64.021*** 0.0699368
(1.132) (6.615)
Observations – R² – R²
Adjusted 22.119 – 0.027 – 0.0263 22.119 – 0.127 – 0.1265
Obs: Robust standard errors in parentheses. * Signiicant at the 90% level – for two-tailed tests. ** Signiicant at the 95% level.
** Signiicant at the 99% level.
In relation to the second set of regression mod-els, which consider each performance indicator separately (Table 3), the independent variables were signiicant to explain, in most cases, the results achieved by cities, although with variations between the indicators. The availability of physicians to SUS and total health expenditure were signiicant in explaining all performance indicators. However, the indicator of tetravalent vaccination coverage is not explained by the municipal GDP, by the revenues and by the percentage of own expenses – which is justiied by the fact that the vaccines are inanced by the Ministry of Health. The number of hospital beds for SUS is signiicant for all performance indica -tors, except, as expected, for the prenatal indicator, which does not require this resource.
However, the explanatory power of the models as a whole is limited, except for compliance with EC29, which presents obvious overlap with the explana-tory factor “percentage of own health expenditures” (R2=0.982). Even so, some results are signiicant. Income from taxes and constitutional transfers are signiicant in explaining the best performance in prenatal care and, especially, the malaria index (coeficients of 0.327,719 and 0.504,277, respec -tively). The latter, however, is negatively affected by health expenditure, conirming the notion that the incidence of malaria is affected by general living conditions and, in turn, by the inancial resources available to the city (exogenous to the health sector), but not by the speciic health expenditure (process indicator), which expresses the costs of care and does not necessarily affect the incidence of malaria.
Infant and neonatal mortalities are strongly and negatively affected by the city’s income (-0.631951 and -0.5991063), which highlights the importance of living conditions for these indicators (an exogenous factor to the the health sector). The availability of doctors is also relevant for the two indicators (0.3098398 and 0.3098398, respectively), suggest -ing an association between the reduction of infant and neonatal mortality and the existence of profes-sionals to perform the required medical follow-up and treatment, whether in the prenatal care and parturition of pregnant women, or for the care of infants in their irst year of life.
Final remarks
The institutional reform initially proposed in the process of formulating the Pact for Health
focused on the deinition of management mecha
-nisms to advance shared solidarity among federal entities. The inability to resolve conlicts led to the reduction of the Pact to a proposal for manage-ment by results from the deinition of individual and non-cooperative goals. Although allegedly federative, it can be said that the Pact did not ex-tend cooperation between the federated entities. From the perspective of the assumption by the cities of health obligations, there was a positive evolution of the fulillment of the targets agreed during the Pact, except for 2011, when the results suffered a considerable drop, not possible to be explained in the scope of this research. This posi-tive evolution, however, does not hide that most of the cities did not reach the goals agreed by them, although these results differ considerably between different indicators. The greater scope of the goals is related to the existence of legal and normative incentives and sanctions imposed by the Constitution or by the MS, or even by the degree of autonomy of the city to comply with the agreement, when there is no dependence on other federated entities or actors in the Attention to health.
observe improvement in most indicators in which the performance of the city is autonomous, that is, it does not depend on the cooperation of others, or is reinforced by the negative or positive incentives of national and federal government rules (EC29, CNES, malaria, ESF, vaccine coverage).
The attempt to identify structural factors capable of being associated with performance sig-naled the inluence of the availability of inancial resources on the performance of cities, which seems to be more associated with the general availability of inancial resources than with health expenditures. The resources that indicate the capacity to provide services (availability of hospital beds and doctors) seem to have a much lower impact on performance, suggesting that spending in other sectors, provided by higher municipal revenues, can have signiicant effects on health.
However, even though the performance is not satisfactory in most cities, and despite the differ-ences in relation to available resources, inequality between them, expressed by Gini, is insigniicant in most indicators, which demonstrates the im-pact of national and of the Union’s distributive power over municipal performance, particularly regarding inancial resources.
This study has the limitation of working with the indicators defined by the Pact for Health from the priorities of the national health policy and may be insuficient to evaluate performance, considering also that the selection reduced their number. The selected indicators, however, meet the objective of making a diachronic analysis, in the unprecedented effort to evaluate the Pact for Health throughout its lifetime, comparing goals agreed with the goals reached by all Brazilian cities. The study goes further by seeking to use the same indicators to evaluate the results that to some extent indicate the performance of cit-ies. But several variables affect performance and intergovernmental relations such as inequality of size, modes of transportation available, loco-re -gional logistics or management skills, among oth-ers. This may be an important research agenda for the analysis of health performance and federative
relations. The inferences and hypotheses made from quantitative indicators also suggest the need for exploring them in in-depth qualitative studies.
Despite these limitations, the study shows that the Pact for Health seems to have contributed to the formation of a national agenda of priorities, to increase the knowledge of the cities about their own capacities and the monitoring of their performance. On the other hand, the Pact seems to have had little repercussion on the performance of cities, particularly when it depends on federative or intermunicipal cooperation (rates of hospital-ization for CVA or diabetes and cytopathological examinations) or factors exogenous to the health sector (Infant mortality rate). In these indicators the performance was not favorable in most of the cities, possibly as a consequence of the per-manence of a model guided by an individual and non-collaborative agreement.
The Pact, in short, had little or no effect to in-duce cooperation. Its extinction in 2011 points to its gradual emptying as a public policy. Obtaining cooperation among federated entities continues to be the challenge in the process of implement-ing the constitutional right to health. To build a true pact between managers of the three levels of government and between society in general, which are responsible for inancing the health system, still remains as the horizon of necessity.
References
ALFRADIQUE, M. et al. Internações por condições sensíveis à atenção primária: a construção da lista brasileira como ferramenta para medir o desempenho do sistema de saúde (Projeto ICSAP – Brasil). Cadernos de Saúde Pública, Rio de Janeiro, v. 25, n. 6, p. 1337-1349, 2009.
ARRETCHE, M. Democracia, federalismo e
centralização no Brasil. Rio de Janeiro: FGV: Fiocruz, 2012.
development and democracy in Brazil. Oxford: Oxford University Press, 2016. p. 108-134.
BITTAR, O. J. N. V. Indicadores de qualidade e quantidade em saúde. Revista de Administração em Saúde, São Paulo, v. 3, n. 12, p. 21-28, 2001.
BRASIL. Ministério da Saúde. Portaria nº 399, de 22 de fevereiro de 2006. Divulga o Pacto pela Saúde 2006 – Consolidação do SUS e aprova as Diretrizes Operacionais do Referido Pacto. Diário Oicial da
União, Brasília, 23 fev. 2006. Seção 1, p. 43-51.
BRASIL. Ministério da Saúde. Portaria nº 2.669, de 3 de novembro de 2009. Estabelece as prioridades, objetivos, metas e indicadores de monitoramento e avaliação do Pacto pela Saúde, nos componentes pela Vida e de Gestão, e as orientações, prazos e diretrizes do seu processo de pactuação para o biênio 2010 - 2011. Diário Oicial
da União, Brasília, 6 nov 2009.
DONABEDIAN, A. A gestão da qualidade total na perspectiva dos serviços de saúde. Rio de Janeiro: Qualitymark, 1994.
FORTES, F. B. C. T. P. Inovação institucional no contexto do federalismo brasileiro pós-1988: a Emenda Constitucional 29 de 2000 e os governos estaduais. 2008. Tese (Doutorado em Ciência Política) – Faculdade de Filosoia e Ciências Humanas da Universidade Federal de Minas Gerais, Belo Horizonte, 2008.
LEVCOVITZ, E.; LIMA, L. D.; MACHADO, C. V. Política de saúde nos anos 90: relações intergovernamentais e o papel das Normas Operacionais Básicas. Ciência & Saúde Coletiva, Rio de Janeiro, v. 6, n. 2, p. 269-291, 2001.
MACHADO, J. A. Pacto de gestão na saúde: até onde esperar uma “regionalização solidária e cooperativa”? Revista Brasileira de Ciências Sociais, São Paulo, v. 24, n. 71, p. 105-119, 2009.
MAFRA, F. O impacto da atenção básica em saúde
em indicadores de internação hospitalar no Brasil. 2011. Dissertação (Mestrado em Regulação e Gestão de Negócios) – Faculdade de Economia,
Administração, Contabilidade e Ciência da Informação e Documentação da Universidade de Brasília, Brasília, DF, 2011.
MARTINS, M.; BLAIS, R.; LEITE, I. C. Mortalidade hospitalar e tempo de permanência: comparação entre hospitais públicos e privados na região de Ribeirão Preto, São Paulo, Brasil. Cadernos de Saúde Pública, Rio de Janeiro, v. 20, p. S268-S282, 2004. Suplemento 2.
MENDES, E. V. A descentralização do sistema de serviços de saúde no Brasil: novos rumos e um outro olhar sobre o nível local. In: MENDES, E. V. (Org.). A organização da saúde no nível local. São Paulo: Hucitec, 1998. p. 17-55.
MENICUCCI, T. M. G. A relação entre o público-privado e o contexto federativo do SUS: uma análise institucional. Santiago do Chile: Cepal, 2014a. (Série Políticas Sociais, n. 196)
MENICUCCI, T. M. G. Cooperação e coordenação na implementação de políticas públicas: as relações intergovernamentais na regionalização da assistência à saúde. In: ENCONTRO DA ASSOCIAÇÃO BRASILEIRA DE CIÊNCIA
POLÍTICA, 9., 2014, Belo Horizonte. Anais… Belo Horizonte: FAPEMIG, 2014b.
MENICUCCI, T. M. G. et al. Regionalização da atenção à saúde em contexto federativo e suas implicações para a equidade de acesso e a integralidade da atenção. Belo Horizonte: Fundação João Pinheiro, 2008.
OLIVEIRA, E. X. G.; TRAVASSOS, C.; CARVALHO, M. S. Acesso à internação hospitalar nos
municípios brasileiros em 2000: territórios do Sistema Único de Saúde. Cadernos de Saúde Pública, Rio de Janeiro, v. 20, p. S298-S309, 2004. Suplemento 2.
PIOLA, S. F. et al. Financiamento público da saúde: uma história à procura de rumo. Texto para discussão nº 1.846. Rio de Janeiro: IPEA, 2013.
Authors’ contribution
Menicucci conceived and coordinated the research project, being the main person responsible for writing the article. Marques par
-ticipated in the general deinition of the research, including the choice of indicators, and collaborated with the data production and article writing. Silveira was responsible for the statistical analysis of the data. All authors contributed to the interpretation of the data.
Acknowledgements
We thank the comments of Marta Arretche for the irst version, presented at a meeting of the Brazilian Association of Political Science, and the contribution of Bruno Guimarães de Melo to the
statistical analysis.
Received: 10/20/2016
Resubmitted: 03/10/2017
Approved: 04/06/2017
de Salud Pública, Washington, DC, v. 12, n. 6, p. 398-415, 2002.
SOARES, J. F. Measuring cognitive achievement gaps and inequalities: the case of Brazil.
International Journal of Educational Research,
Amsterdam, v. 45, n. 3, p. 176-187, 2006.
VIEGAS, M. et al. Análise da eiciência hospitalar no