Serb. Astron. J. } 183 (2011), 95 - 102 UDC 52–13–77 : 524.722.7
DOI: 10.2298/SAJ1183095C Professional paper
NEW 6 AND 3-cm RADIO-CONTINUUM MAPS OF THE
SMALL MAGELLANIC CLOUD. PART I – THE MAPS
E. J. Crawford, M. D. Filipovi´c, A. Y. De Horta, G. F. Wong, N. F. H. Tothill, D. Draˇskovi´c, J. D. Collier and T. J. Galvin
University of Western Sydney, Locked Bag 1797, Penrith South DC, NSW 2751, Australia E–mail: [email protected]
(Received: October 17, 2011; Accepted: October 24, 2011)
SUMMARY: We present new 6 and 3-cm radio-continuum maps of the Small Magellanic Cloud (SMC), created with the ”peeling” technique and a joint decon-volution. The maps have resolutions of 30′′ and 20′′ and r.m.s., noise of 0.7 and
0.8 mJy/beam at 6 and 3 cm, respectively. These maps will be used for future studies of the SMC’s radio source population and overall extended structure.
Key words. Magellanic Clouds – radio continuum: galaxies – galaxies: structure
1. INTRODUCTION
In the past two decades, several Parkes, Mo-longlo Observatory Synthesis Telescope (MOST) and Australia Telescope Compact Array (ATCA) moder-ate resolution (∼arcmin) surveys of the Magellanic
Clouds (MCs) have been completed (Filipovi´c et al. 1998).
Deep ATCA and Parkes radio-continuum and snap-shot surveys of the Small Magellanic Cloud (SMC) were conducted at 20, 13, 6 and 3 cm by Fil-ipovi´c et al (2002), achieving sensitivities of 1.8, 0.4, 0.8 and 0.4 mJy/beam respectively. These surveys were conducted in mosaic mode with between 35 and 320 separate pointings using 5 antennae in the 375-m array configuration, with short-spacing information from single-dish Parkes observations. The maps have angular resolutions of 98′′, 40′′, 30′′ and 20′′ at the respective wavelengths listed above. Recently, we published a set of new high resolution (few-arcsec) radio-continuum mosaic images of the SMC at 20 cm created by combining observations from ATCA and
Parkes (Wong et al. 2011). The latest images of the SMC at 6 and 3 cm were presented by Dickel et al. (2005, 2010). These maps display significant arte-facts due to the way they were constructed as linear mosaics of individually cleaned images. By jointly deconvolving these data with other archival data we were able to obtain significantly improved maps of the SMC.
2. IMAGING TECHNIQUES
When the area to be imaged exceeds the field of view of the telescope, a mosaic must be made. There are two methods for assembling a mosaic: Im-age each field and combine the imIm-ages at the end; or combine the data at the beginning and image them jointly. The field-by-field approach has the ad-vantage that it has modest processing requirements. However, not all available information in the data is utilised. The downside to the joint approach is a huge increase in the processing time and complexity.
E. J. CRAWFORDet al.
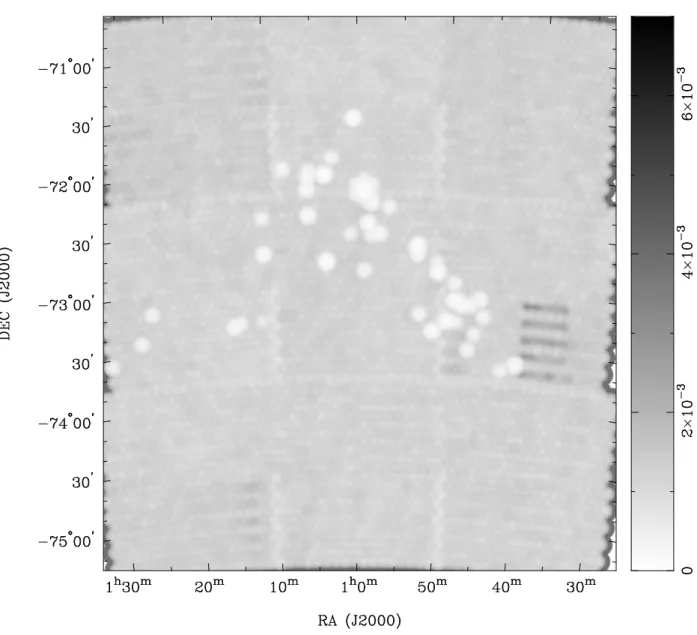
Fig. 1. The SMC at 6 cm without zero-spacing data. The map has a resolution of 30′′. The sidebar gives
the intensity scale in units of Jy/beam.
A further problem with wide field imaging is the effect of ”off-axis” sources. A source that is out-side the primary beam of the telescope can still in-fluence the response of the receiver. The solution to this problem is to use the ”peeling” technique de-tailed in Hughes et al. (2007). Essentially, the tech-niques of self-calibration and source subtraction are used to correct for off-axis sources and thus reduce the artefact levels.
The interferometer images only sample the Fourier plane down to the shortest baseline — the largest scale structures are missed. To correct for this deficiency, archival ”zero-spacing” data from Parkes (a large single dish) observations (Filipovi´c et al. 1997) have been incorporated into all of the new
survey images. However, these observations do not cover the whole field of the ATCA observations. The Parkes data also have much higher r.m.s. noise than the ATCA data.
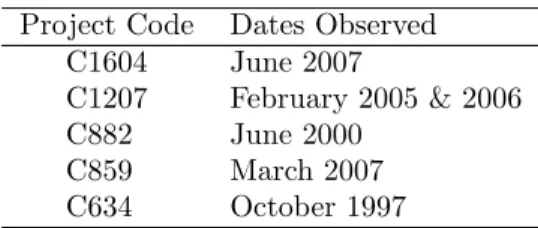
Table 1. ATCA Projects used.
Project Code Dates Observed
C1604 June 2007
C1207 February 2005 & 2006
C882 June 2000
C859 March 2007
NEW 6 AND 3-cm RADIO-CONTINUUM MAPS OF THE SMC. PART I – THE MAPS
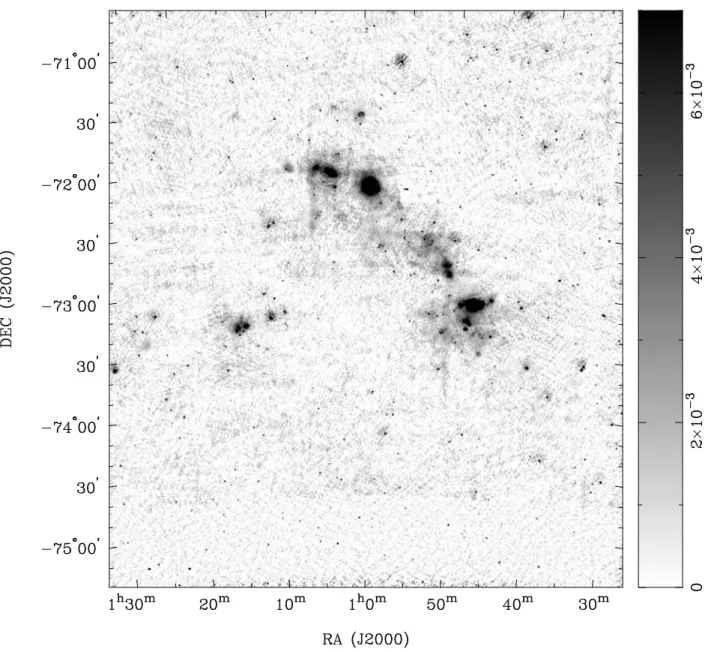
Fig. 2. The SMC at 6 cm with zero-spacing data. The map has a resolution of 30′′. The sidebar gives
the intensity scale in units of Jy/beam. The zero-spacing data does not cover the same spatial area as the interferometer data.
3. DATA REDUCTION
TECHNIQUE AND RESULTS
The majority of archival data used come from ATCA project C1207 (Dickel et al. 2010), available in calibrated form1. A search of the Australia Tele-scope Online Archive2 yielded four more projects that cover the SMC at 6 and 3 cm (Table 1). All data were inspected, peeled if necessary, and then
combined into a single ”dirty map”. The SDI clean algorithm (Sault and Killeen 2010) was used to de-convolve the images, which were then restored. The new maps are presented with and without zero- spac-ing data in Figs. 1 – 4. The resolutions are 30′′ and
20′′ and the sensitivities of the ATCA data are 0.7
and 0.8 mJy/beam at 6 cm (Fig. 1) and 3 cm (Fig. 3), respectively. The r.m.s. noise levels in Figs. 2 and 4 are dominated by the additional noise of the single dish data (Filipovi´c et al. 1997).
1http://www.atnf.csiro.au/research/smc ctm/
E. J. CRAWFORDet al.
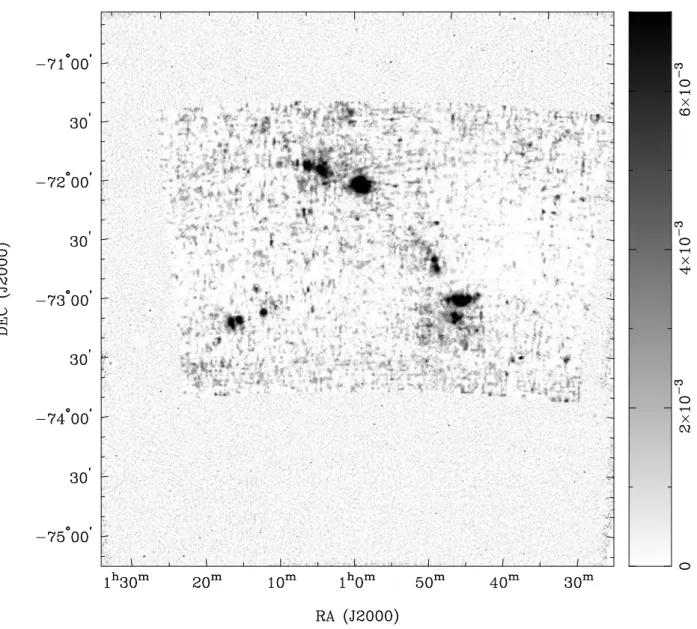
Fig. 3. The SMC at 3 cm without zero-spacing data. The map has a resolution of 20′′. The sidebar gives the intensity scale in units of Jy/beam.
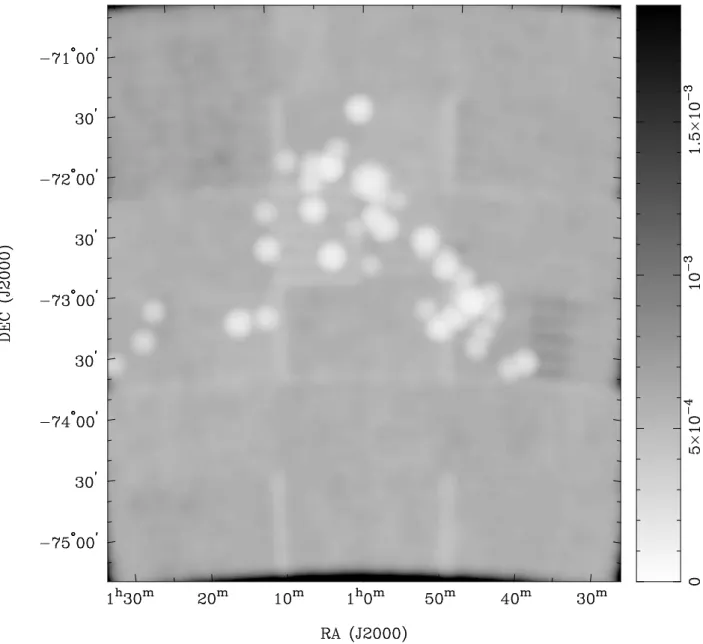
As only project C1207 was designed as a sur-vey of the entire region, the maps suffer from nonuni-form sensitivity, a consequence of differing integra-tion times at each pointing. Figs. 5 and 6
demon-strate how the sensitivity changes across the field. All these images can be downloaded from http://spacescience.uws.edu.au/mc/smc/
NEW 6 AND 3-cm RADIO-CONTINUUM MAPS OF THE SMC. PART I – THE MAPS
Fig. 4. The SMC at 3 cm with zero-spacing data. The map has a resolution of 20′′. The sidebar gives the intensity scale in units of Jy/beam. The zero-spacing data does not cover the same spatial area as the interferometer data.
E. J. CRAWFORDet al.
NEW 6 AND 3-cm RADIO-CONTINUUM MAPS OF THE SMC. PART I – THE MAPS
Fig. 6. Theoretical r.m.s. sensitivity map of the 3 cm data used in this study in Jy/beam. Lighter areas indicate higher sensitivity.
Acknowledgements – The Australia Telescope Com-pact Array and Parkes radio telescope are parts of the Australia Telescope National Facility which is funded by the Commonwealth of Australia for operation as a National Facility managed by CSIRO. This paper includes archived data obtained through the Australia Telescope Online Archive (http://atoa.atnf.csiro.au). We used thekarmaand miriadsoftware package developed by the ATNF.
REFERENCES
Dickel, J. R., McIntyre, V. J., Gruendl, R. A., Milne, D. K.: 2005,Astron. J.129, 790.
Dickel, J. R., Gruendl, R. A., McIntyre, V. J., Amy, S. W.: 2010,Astron. J.,140, 1511
Filipovi´c, M. D., Jones, P. A., White, G. L., Haynes,
R. F., Klein, U., Wielebinski, R: 1997,Astron. Astrophys. Suppl. Series 121, 321.
Filipovi´c, M. D., Haynes, R. F., White, G. L., Jones, P. A.: 1998,Astron. Astrophys. Suppl. Series 130, 421.
Filipovi´c, M. D., Bohlsen, T., Reid, W., Staveley-Smith, L., Jones, P. A., Nohejl, K., Goldstein, G.: 2002, Mon. Not. R. Astron. Soc. 335, 1085.
Hughes, A., Staveley-Smith, L., Kim, S., Wolleben, M., Filipovi´c, M. D.: 2008, Mon. Not. R. Astron. Soc. 382, 543.
Sault, R., Killeen, N.: 2010, Miriad Users Guide, ATNF.
E. J. CRAWFORDet al.
NOVO PROUQAVANjE MALOG MAGELANOVOG OBLAKA
U RADIO-KONTINUUMU NA 6 cm I 3 cm: DEO I - MAPE
E. J. Crawford, M. D. Filipovi´c, A. Y. De Horta, G. F. Wong, N. F. H. Tothill, D. Draˇskovi´c, J. D. Collier and T. J. Galvin
University of Western Sydney, Locked Bag 1797, Penrith South DC, NSW 2751, Australia E–mail: [email protected]
UDK 52–13–77 : 524.722.7
Struqni qlanak
U ovoj studiji predstavljamo noveATCA rezultate posmatranja visoke rezolucije i osetljivosti u radio-kontinuumu Malog Mage-lanovog oblaka (MMO) na λ=6 cm (ν=4.8 GHz)
i λ=3 cm (ν=8.64 GHz). Nove radio-mape
nastale su spajanjem arhivskih mozaik
posma-tranja tzv. ”peeling” tehnikom i to na 6 cm i 3 cm. Naxe nove mape imaju rezoluciju od ∼30′′ (6 cm) i ∼20′′ (3 cm) i osetljivost od
r.m.s. = 0.7 mJy/beam. Ove mape e biti ko-rixene u buduim istraжivanjima kako ob-jekata tako i ukupne strukture MMO-a.