Cop
yright
© ABE&M t
odos os dir
eit
os r
eser
vados
.
1 Division of Clinical and Surgical
Treatment of Obesity, Faculdade de Medicina do ABC (FMABC), Santo André, SP, Brazil
2 Sociedade Brasileira de
Cirurgia Bariátrica e Metabólica (SBCBM), São Paulo, SP, Brazil
Correspondence to:
Ary Serpa Neto
Rua Ossian Terceiro Teles, 220 04649-000 – São Paulo, SP, Brazil [email protected]
Received on Dec/6/2009 Accepted on Nov/16/2010
Relation of uric acid with
components of metabolic syndrome
before and after Roux-en-Y gastric
bypass in morbidly obese subjects
Relação do ácido úrico com os componentes da síndrome metabólica antes e após o bypass gástrico com reconstrução em Y-de-Roux em pacientes obesos mórbidos
Ary Serpa Neto1, Felipe Martin Bianco Rossi1, Leonardo Guedes Moreira Valle1,
Gabriel Kushiyama Teixeira1, Marçal Rossi2
ABSTRACT
Objective: The purpose of the study was to investigate the prevalence of hyperuricemia in morbidly obese subjects before and after Roux-en-Y gastric bypass (RYGBP) and its relationship with metabo-lic syndrome abnormalities. Subjects and method: We evaluated 420 morbidly obese patients. Pre and postoperative (8 months after RYGBP) blood samples were drawn. Obese patients underwent laparoscopic RYGBP and after eight months all the tests were repeated. Results: The overall pre-valence of hyperuricemia was 34.28%. Hyperuricemia was more common in men than in women (51.72 vs. 29.72%; p = 0.0002). Men with hyperuricemia were more likely to have diabetes (p = 0.034) and more elevated fasting plasma glucose levels (p = 0.027). Women with hyperuricemia were more likely to have hypertension (p = 0.003), metabolic syndrome (p = 0.001), elevated triglycerides (p = 0.001) and GGT (p = 0.009), and decreased HDL (p = 0.011). After surgery, uric acid levels decreased from 5.60 ± 1.28 to 4.23 ± 1.20 (p < 0.0001). The prevalence of hyperuricemia decreased from 33.6% to 6.4% (p < 0.0001), in men from 48.3% to 17.2% (p < 0.0001) and in women from 29.7% to 3.6% (p < 0.0001). Conclusion: Concentrations of uric acid were associated with the prevalence of metabolic abnormalities in this sample of morbidly obese patients. Also, weight loss after RYGBP can reduce uric acid levels and the prevalence of hyperuricemia. Arq Bras Endocrinol Metab. 2011;55(1):38-45
Keywords
Uric acid; metabolic syndrome; bariatric surgery
RESUMO
Objetivo: O objetivo do estudo foi investigar a prevalência de hiperuricemia em pacientes obesos mórbidos antes e após o bypass gástrico com reconstrução em Y-de-Roux (RYGBP) e sua relação com anormalidades da síndrome metabólica. Sujeitos e métodos: Foram avaliados 420 pacientes com obesidade mórbida. Amostras de sangue pré e pós-operatório (8 meses após RYGBP) foram obtidas. Os pacientes obesos foram submetidos a RYGBP laparoscópica e após oito meses todos os testes foram repetidos. Resultados: A prevalência de hiperuricemia foi 34,28%. A hiperuricemia foi mais comum em homens do que em mulheres (51,72 vs. 29,72%, p = 0,0002). Homens com hiperuri-cemia foram mais propensos a ter diabetes (p = 0,034) e tinham níveis mais elevados de glihiperuri-cemia de jejum (p = 0,027). Mulheres com hiperuricemia foram mais propensas a ter hipertensão arterial (p = 0,003), síndrome metabólica (p = 0,001), triglicérides elevado (p = 0,001) e GGT (p = 0,009) e diminui-ção de HDL (p = 0,011). Após a cirurgia, os níveis de ácido úrico diminuíram de 5,60 ± 1,28 para 4,23 ± 1,20 (p < 0,0001). A prevalência de hiperuricemia diminuiu 33,6% para 6,4% (p < 0,0001), em homens de 48,3% para 17,2% (p < 0,0001) e nas mulheres de 29,7% para 3,6% (p < 0,0001). Conclusão: As concentrações de ácido úrico foram associadas com a prevalência de anormalidades metabólicas nesta amostra de pacientes com obesidade mórbida. Além disso, a perda de peso após RYGBP pode reduzir os níveis de ácido úrico e a prevalência de hiperuricemia. Arq Bras Endocrinol Metab. 2011;55(1):38-45
Descritores
Cop
yright
© ABE&M t
odos os dir
eit
os r
eser
vados
.
INTRODUCTION
M
etabolic syndrome comprises severalabnormali-ties that occur together more often than would be expected by chance. Typically, general or central adi-posity, elevated blood pressure, dyslipidemia, and hy-perglycemia are thought to be part of this syndrome. In addition, several other abnormalities including those of ibrinolysis, thrombosis, inlammation, and endothelial function are strongly related to the syndrome.
There continues to be a need to better understand the pattern of risk factor clustering that constitutes me-tabolic syndrome and the relationship of the syndrome to emerging risk factors for cardiovascular disease. The positive association between serum uric acid and cardio-vascular diseases such as stroke or ischemic heart dise-ase has been recognized since the 1950s and has been conirmed by numerous epidemiological studies (1-3). However, whether uric acid is an independent risk fac-tor for cardiovascular mortality is still disputed as seve-ral studies have suggested that hyperuricemia is merely associated with cardiovascular diseases because of con-founding factors such as obesity, dyslipidemia, hyper-tension, use of diuretics and insulin resistance (4,5).
Elevated serum uric acid levels (UA) are commonly seen in association with glucose intolerance, hyperten-sion, and dyslipidemia, a cluster of metabolic and he-modynamic disorders which characterize the so-called metabolic syndrome (6,7). Studies performed in heal-thy volunteers as well as in subjects with asymptomatic hyperuricemia have suggested that the link between metabolic syndrome and serum uric acid is related to the ability of insulin to decrease uric acid clearance in the renal proximal tubule resulting in an increase in se-rum uric acid levels (8).
The purpose of the present study was to investiga-te the prevalence of hyperuricemia in morbidly obe-se subjects before and after Roux-en-Y gastric bypass (RYGBP) and its relationship with metabolic syndrome abnormalities.
SUBJECTS AND METHOD
Study population
Four hundred and twenty morbidly obese patients were considered eligible to participate in this study according to the following inclusion criteria: body mass index (BMI) ≥ 40 kg/m², age between 18 and 60 years, and no history of liver disease. Most patients (68.5%) were women and the mean body mass index was 47.1 ± 5.4 kg/m².
Study protocol and follow-up
Pre and postoperative (at 8 months after bariatric sur-gery) blood samples were drawn after a minimum fas-ting period of 8h. Laboratorial analyses were perfor-med using standard methodologies. BMI is deined as the individual’s body weight divided by the square of his/her height. To deine metabolic syndrome (MS) we used the International Diabetes Federation (IDF) criteria: waist circumference ≥ 94 cm in men, ≥ 80 cm in women or BMI ≥ 30 kg/m²; triglyceride levels ≥ 150 mg/dL (1.7 mmol/L) and/or speciic treatment; HDL-C levels < 40 mg/dL (1 mmol/L) in men, < 50 mg/dL (1.3 mmol/L) in women and/or speciic tre-atment; fasting glucose ≥ 100 mg/dL (5.6 mmol/L) and/or DM2 patient; systolic blood pressure ≥ 130 mmHg, diastolic blood pressure ≥ 85 mmHg and/or speciic treatment. An individual must present at least three of the ive risk factors to be diagnosed with MS. Hyperuricemia was deined as uric acid > 6 mg/dL (women) and 6.8 mg/dL (men).
The obese patients underwent laparoscopic RYGBP and after eight months all the tests were repeated. RYGBP is a mixed technique that uses more of a res-trictive and less of a disabsortive participation. Its main characteristics are the formation of a gastric “pouch” (15 ± 5 mL), an alimentary loop of 100 cm, a biliopan-creatic loop of 60 cm, and a common loop.
This retrospective study was approved by the Ethics Committee of Faculdade de Medicina do ABC.
Statistical methods
Data were irst tested for normal distribution with the Kolmogorov-Smirnov test. For cross-sectional compa-risons, concentration of uric acid between those with and without metabolic syndrome and its components at baseline were compared using ANCOVA adjusted for age and ethnicity. The patients were divided into four equal quarters on the basis of uric acid distribu-tions and linear regression analysis was used to test for trends across the four groups itting quantitative varia-bles for the four groups.
For prospective analyses baseline means (with SDs) were calculated for subjects in follow-up with t tests,
Wilcoxon tests or χ2 tests. The association of uric acid
Cop
yright
© ABE&M t
odos os dir
eit
os r
eser
vados
.
risk of prevalent metabolic syndrome and with the im-provement of it after weight loss, taking in account po-tential confounders. We evaluated the degree to which uric acid predicted improvement of metabolic syndrome after Roux-en-Y gastric bypass using logistic regression.
All statistical analyses were made with the statistical software package SPSS (v16.0; SPSS, Chicago, IL) and MedCalc software. Statistical signiicance was conside-red at p < 0.05.
RESULTS
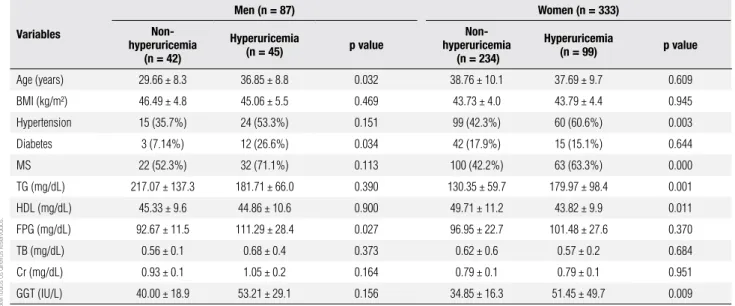
The overall prevalence of hyperuricemia was 34.28%. Hyperuricemia was more common in men than in wo-men (51.72 vs. 29.72%; p = 0.0002). Some characteris-tics of the study population according to hyperuricemia status are shown in table 1. Men with hyperuricemia, as compared with those without the condition, were more likely to have diabetes (p = 0.034) and more elevated fasting plasma glucose levels (p = 0.027). Women with hyperuricemia as compared with their counterparts wi-thout the condition were more likely to have hyperten-sion (p = 0.003), metabolic syndrome (p = 0.001), ele-vated triglycerides (p = 0.001) and GGT (p = 0.009), and decreased HDL (p = 0.011).
In men, GGT and fasting plasma glucose showed a graded increase according to uric acid quartiles. In wo-men we observed an increase in triglyceride levels and hypertension prevalence (Table 2). In men, mean GGT
in the fourth quartile was higher than that in the irst quartile (p = 0.006), and in women mean triglycerides in the fourth quartile was higher than that in the irst quartile (p = 0.033). The prevalence of metabolic syn-drome in men was higher in the second quartile than that in the irst quartile (p = 0.023), and the prevalen-ce of hypertension and fasting plasma glucose ≥ 100 mg/dL in the second and fourth quartile was higher than that in the irst quartile (p = 0.002 for the second quartile and p = 0.009 for the fourth quartile of hyper-tension and p = 0.038 for the second quartile and p = 0.009 for the fourth quartile of fasting plasma glucose ≥ 100 mg/dL). In women the prevalence of hypertension was higher in the third and fourth quartile than that in the irst quartile (p = 0.030 for the third quartile and p = 0.000 for the fourth quartile), and the prevalence of triglycerides ≥ 150 mg/dL was higher in the fourth quartile than that in the irst quartile (p = 0.000).
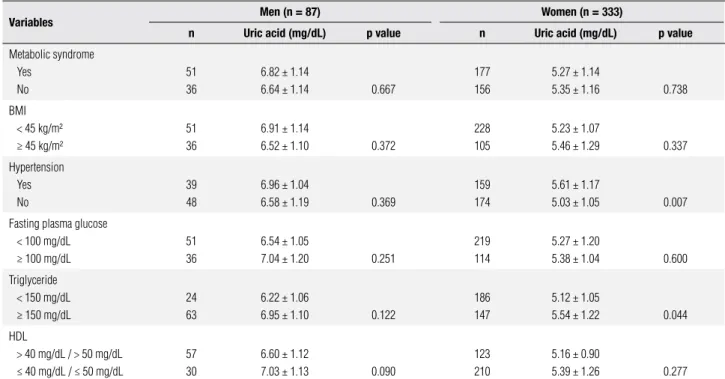
Pearson’s correlation coeficients for the relationship between uric acid and each variable in women were signiicant for triglycerides (r = 0.20; p = 0.029) and GGT (r = 0.23; p = 0.018). In men the correlation was signiicant also for GGT (r = 0.45; p = 0.013) and for fasting plasma glucose (r = 0.38; p = 0.039). As shown in table 3, elevated triglycerides and hypertension were statistically signiicantly associated with higher uric acid concentration in women. There was no statistical signi-icance between metabolic abnormalities and uric acid concentrations in men.
Table 1.Characteristic of the study population according to hyperuricemia status*
Variables
Men (n = 87) Women (n = 333)
Non-hyperuricemia (n = 42)
Hyperuricemia
(n = 45) p value
Non-hyperuricemia
(n = 234)
Hyperuricemia
(n = 99) p value
Age (years) 29.66 ± 8.3 36.85 ± 8.8 0.032 38.76 ± 10.1 37.69 ± 9.7 0.609
BMI (kg/m²) 46.49 ± 4.8 45.06 ± 5.5 0.469 43.73 ± 4.0 43.79 ± 4.4 0.945
Hypertension 15 (35.7%) 24 (53.3%) 0.151 99 (42.3%) 60 (60.6%) 0.003
Diabetes 3 (7.14%) 12 (26.6%) 0.034 42 (17.9%) 15 (15.1%) 0.644
MS 22 (52.3%) 32 (71.1%) 0.113 100 (42.2%) 63 (63.3%) 0.000
TG (mg/dL) 217.07 ± 137.3 181.71 ± 66.0 0.390 130.35 ± 59.7 179.97 ± 98.4 0.001
HDL (mg/dL) 45.33 ± 9.6 44.86 ± 10.6 0.900 49.71 ± 11.2 43.82 ± 9.9 0.011
FPG (mg/dL) 92.67 ± 11.5 111.29 ± 28.4 0.027 96.95 ± 22.7 101.48 ± 27.6 0.370
TB (mg/dL) 0.56 ± 0.1 0.68 ± 0.4 0.373 0.62 ± 0.6 0.57 ± 0.2 0.684
Cr (mg/dL) 0.93 ± 0.1 1.05 ± 0.2 0.164 0.79 ± 0.1 0.79 ± 0.1 0.951
GGT (IU/L) 40.00 ± 18.9 53.21 ± 29.1 0.156 34.85 ± 16.3 51.45 ± 49.7 0.009
Data expressed as mean ± SD or n(percentage).
* Hyperuricemia defined as uric acid > 6 mg/dL (women) and 6.8 mg/dL (men).
Cop
yright
© ABE&M t
odos os dir
eit
os r
eser
vados
.
Table 2. Baseline characteristics by uric acid quartiles
Variables Quartiles of serum uric acid p value
1 2 3 4
Men (87)
Uric acid range (mg/dL) ≤ 6.14 6.15 – 6.69 6.70 – 7.74 ≥ 7.75
No. Subjects 21 18 27 21
Age (years) 27.57 ± 5.6 32.50 ± 11.7 35.66 ± 9.0 36.00 ± 8.8 0.072
BMI (kg/m²) 46.26 ± 4.46 47.89 ± 6.1 45.80 ± 6.1 43.53 ± 3.8 0.260
Uric acid (mg/dL) 5.22 ± 0.6 6.45 ± 0.1 7.07 ± 0.3 8.11 ± 0.4 0.000
Total bilirubin (mg/dL) 0.47 ± 0.1 0.66 ± 0.1 0.55 ± 0.2 0.81 ± 0.6 0.154
Creatinine (mg/dL) 0.88 ± 0.2 0.91 ± 0.0 1.08 ± 0.1 1.04 ± 0.3 0.108
GGT (IU/L) 34.14 ± 19.5 44.66 ± 19.0 35.77 ± 19.0 73.71 ± 22.4 0.003
Triglycerides (mg/dL) 171.29 ± 79.1 243.00 ± 182.6 199.11 ± 104.6 193.00 ± 58.2 0.887
HDL (mg/dL) 47.14 ± 10.1 45.00 ± 10.5 44.11 ± 7.8 44.43 ± 13.3 0.603
Fasting glucose (mg/dL) 87.00 ± 5.5 96.83 ± 14.3 108.11 ± 28.0 112.14 ± 27.7 0.027
Metabolic syndrome Hypertension FPG ≥ 100 mg/dL HDL ≤ 40 mg/dL TG ≥ 150 mg/dL
9 (42.8%) 3 (14.2%) 3 (14.2%) 6 (28.5%) 12 (57.1%)
15 (83.3%) 12 (66.6%) 9 (50%) 6 (33.3%)
9 (50%)
12 (44.4%) 12 (44.4%) 12 (44.4%) 9 (33.3%) 24 (88.8%)
15 (71.4%) 12 (57.1%) 12 (57.1%) 9 (42.8%) 18 (85.7%)
0.588 0.204 0.159 0.622 0.107
Women (333)
Uric acid range (mg/dL) ≤ 4.69 4.70 – 5.29 5.30 – 6.09 ≥ 6.10
No. subjects 78 81 81 93
Age (years) 39.11 ± 9.1 35.81 ± 8.8 41.74 ± 11.7 37.32 ± 9.6 0.948
BMI (kg/m²) 44.82 ± 5.0 43.32 ± 3.5 43.11 ± 3.26 43.78 ± 4.5 0.346
Uric acid (mg/dL) 3.77 ± 0.5 5.02 ± 0.1 5.62 ± 0.2 6.56 ± 0.7 0.000
Total bilirubin (mg/dL) 0.58 ± 0.2 0.53 ± 0.2 0.75 ± 1.0 0.56 ± 0.2 0.740
Creatinine (mg/dL) 0.81 ± 0.1 0.78 ± 0.1 0.77 ± 0.1 0.80 ± 0.1 0.837
GGT (IU/L) 36.57 ± 21.7 34.62 ± 14.0 45.88 ± 53.0 41.67 ± 21.5 0.315
Triglycerides (mg/dL) 127.23 ± 62.9 133.19 ± 63.8 132.30 ± 52.4 181.61 ± 101.2 0.008
HDL (mg/dL) 46.85 ± 10.8 50.67 ± 10.6 50.15 ± 12.9 44.61 ± 9.7 0.366
Fasting glucose (mg/dL) 94.50 ± 15.0 103.33 ± 29.6 96.63 ± 28.5 98.55 ± 21.3 0.791
Metabolic syndrome Hypertension FPG ≥ 100 mg/dL HDL ≤ 50 mg/dL TG ≥ 150 mg/dL
42 (53.8%) 27 (34.6%) 21 (26.9%) 51 (65.3%) 24 (30.7%)
48 (52.9%) 27 (33.3%) 30 (37.0%) 42 (51.8%) 33 (40.7%)
45 (55.5%) 48 (52.9%) 33 (40.7%) 48 (52.9%) 36 (44.4%)
42 (45.1%) 57 (61.2%) 30 (32.2%) 69 (74.1%) 54 (58.0%)
0.607 0.003 0.757 0.281 0.051
FPG: fasting plasma glucose; TG: triglycerides.
In men, hyperuricemia showed sensitivity and speci-icity of 41.1 and 50.0% for the diagnosis of metabolic syndrome and in women sensitivity was 76.2% and spe-ciicity 32.6% (Figure 1).
After surgery, uric acid levels decreased from 5.60 ± 1.28 to 4.23 ± 1.20 (p < 0.0001). In men this decrease was from 6.75 ± 1.12 to 5.36 ± 1.42 (p < 0.0001) and in women from 5.31 ± 1.14 to 3.93 ± 0.93 (p < 0.0001) (Figure 2). Prevalence of hyperuricemia decreased from
Cop
yright
© ABE&M t
odos os dir
eit
os r
eser
vados
.
Table 3. Means of uric acid (mg/dL) according to selected features of metabolic abnormalities
Variables Men (n = 87) Women (n = 333)
n Uric acid (mg/dL) p value n Uric acid (mg/dL) p value
Metabolic syndrome Yes
No
51 36
6.82 ± 1.14
6.64 ± 1.14 0.667
177 156
5.27 ± 1.14
5.35 ± 1.16 0.738
BMI < 45 kg/m² ≥ 45 kg/m²
51 36
6.91 ± 1.14
6.52 ± 1.10 0.372
228 105
5.23 ± 1.07
5.46 ± 1.29 0.337
Hypertension Yes No
39 48
6.96 ± 1.04
6.58 ± 1.19 0.369
159 174
5.61 ± 1.17
5.03 ± 1.05 0.007
Fasting plasma glucose < 100 mg/dL ≥ 100 mg/dL
51 36
6.54 ± 1.05
7.04 ± 1.20 0.251
219 114
5.27 ± 1.20
5.38 ± 1.04 0.600
Triglyceride < 150 mg/dL ≥ 150 mg/dL
24 63
6.22 ± 1.06
6.95 ± 1.10 0.122
186 147
5.12 ± 1.05
5.54 ± 1.22 0.044
HDL
> 40 mg/dL / > 50 mg/dL ≤ 40 mg/dL / ≤ 50 mg/dL
57 30
6.60 ± 1.12
7.03 ± 1.13 0.090
123 210
5.16 ± 0.90
5.39 ± 1.26 0.277
BMI: body mass index.
Figure 1. Levels of uric acid for the diagnosis of metabolic syndrome (men and women). Sensitivity (black line) and specificity (gray line).
Figure 2. Uric acid levels before (dark bars) and after (gray bars) Roux-en-Y gastric bypass in general, men and women. All p values are less than 0.0001.
Patients with improvement of metabolic syndrome after RYGBP showed a greater decrease of uric acid le-vels than those without improvement of MS (- 1.52 ±
1.10 vs. 1.23 ± 1.23, respectively; p = 0.031). In the
group of patients with hyperuricemia before RYGBP, those who became normouricemic after surgery showed 2.70 more chance of improvement of metabolic syndro-me than those without normalization of uric acid levels.
DISCUSSION
We showed in the present study that hyperuricemic men have a higher prevalence of diabetes and higher fasting glucose. Women showed a higher prevalence of hypertension, metabolic syndrome, hypertriglyce-ridemia, and low HDL. In general, elevated levels of uric acid seem to be related to many metabolic abnor-malities. Weight loss after RYGBP is accompanied by 100
90
80
70
60 50
40
30
20
10
0
0 2 4 6 8 10
Metabolic syndrome
Acid uric levels (mg/dL)
Uric acid levels (mg/dL)
8
7
6
5
4
3
2
1
0
Cop
yright
© ABE&M t
odos os dir
eit
os r
eser
vados
.
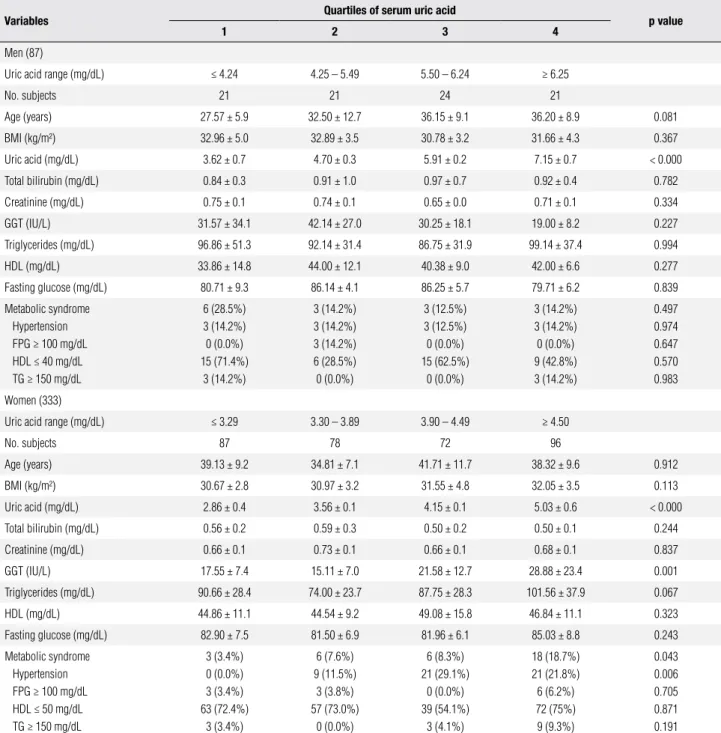
Table 4. Characteristics by uric acid quartiles eight months after Roux-en-Y gastric bypass
Variables Quartiles of serum uric acid p value
1 2 3 4
Men (87)
Uric acid range (mg/dL) ≤ 4.24 4.25 – 5.49 5.50 – 6.24 ≥ 6.25
No. subjects 21 21 24 21
Age (years) 27.57 ± 5.9 32.50 ± 12.7 36.15 ± 9.1 36.20 ± 8.9 0.081
BMI (kg/m²) 32.96 ± 5.0 32.89 ± 3.5 30.78 ± 3.2 31.66 ± 4.3 0.367
Uric acid (mg/dL) 3.62 ± 0.7 4.70 ± 0.3 5.91 ± 0.2 7.15 ± 0.7 < 0.000
Total bilirubin (mg/dL) 0.84 ± 0.3 0.91 ± 1.0 0.97 ± 0.7 0.92 ± 0.4 0.782
Creatinine (mg/dL) 0.75 ± 0.1 0.74 ± 0.1 0.65 ± 0.0 0.71 ± 0.1 0.334
GGT (IU/L) 31.57 ± 34.1 42.14 ± 27.0 30.25 ± 18.1 19.00 ± 8.2 0.227
Triglycerides (mg/dL) 96.86 ± 51.3 92.14 ± 31.4 86.75 ± 31.9 99.14 ± 37.4 0.994
HDL (mg/dL) 33.86 ± 14.8 44.00 ± 12.1 40.38 ± 9.0 42.00 ± 6.6 0.277
Fasting glucose (mg/dL) 80.71 ± 9.3 86.14 ± 4.1 86.25 ± 5.7 79.71 ± 6.2 0.839
Metabolic syndrome Hypertension FPG ≥ 100 mg/dL HDL ≤ 40 mg/dL TG ≥ 150 mg/dL
6 (28.5%) 3 (14.2%) 0 (0.0%) 15 (71.4%)
3 (14.2%)
3 (14.2%) 3 (14.2%) 3 (14.2%) 6 (28.5%) 0 (0.0%)
3 (12.5%) 3 (12.5%) 0 (0.0%) 15 (62.5%)
0 (0.0%)
3 (14.2%) 3 (14.2%) 0 (0.0%) 9 (42.8%) 3 (14.2%)
0.497 0.974 0.647 0.570 0.983
Women (333)
Uric acid range (mg/dL) ≤ 3.29 3.30 – 3.89 3.90 – 4.49 ≥ 4.50
No. subjects 87 78 72 96
Age (years) 39.13 ± 9.2 34.81 ± 7.1 41.71 ± 11.7 38.32 ± 9.6 0.912
BMI (kg/m²) 30.67 ± 2.8 30.97 ± 3.2 31.55 ± 4.8 32.05 ± 3.5 0.113
Uric acid (mg/dL) 2.86 ± 0.4 3.56 ± 0.1 4.15 ± 0.1 5.03 ± 0.6 < 0.000
Total bilirubin (mg/dL) 0.56 ± 0.2 0.59 ± 0.3 0.50 ± 0.2 0.50 ± 0.1 0.244
Creatinine (mg/dL) 0.66 ± 0.1 0.73 ± 0.1 0.66 ± 0.1 0.68 ± 0.1 0.837
GGT (IU/L) 17.55 ± 7.4 15.11 ± 7.0 21.58 ± 12.7 28.88 ± 23.4 0.001
Triglycerides (mg/dL) 90.66 ± 28.4 74.00 ± 23.7 87.75 ± 28.3 101.56 ± 37.9 0.067
HDL (mg/dL) 44.86 ± 11.1 44.54 ± 9.2 49.08 ± 15.8 46.84 ± 11.1 0.323
Fasting glucose (mg/dL) 82.90 ± 7.5 81.50 ± 6.9 81.96 ± 6.1 85.03 ± 8.8 0.243
Metabolic syndrome Hypertension FPG ≥ 100 mg/dL HDL ≤ 50 mg/dL TG ≥ 150 mg/dL
3 (3.4%) 0 (0.0%) 3 (3.4%) 63 (72.4%)
3 (3.4%)
6 (7.6%) 9 (11.5%)
3 (3.8%) 57 (73.0%)
0 (0.0%)
6 (8.3%) 21 (29.1%)
0 (0.0%) 39 (54.1%)
3 (4.1%)
18 (18.7%) 21 (21.8%) 6 (6.2%) 72 (75%) 9 (9.3%)
0.043 0.006 0.705 0.871 0.191
FPG: fasting plasma glucose; TG: triglycerides.
reduction in uric acid levels and by reduction in the prevalence of hyperuricemia.
Previous studies have showed a close relation betwe-en hyperuricemia and metabolic syndrome in adults and children (9,10). Several potential mechanisms could account for the elevated concentrations of uric acid among those with metabolic abnormalities. Renal clea-rance of urate is inversely related to the degree of insu-lin resistance (7). Furthermore, higher concentrations
of insulin are known to reduce the renal excretion of urate (11). For example, exogenous insulin can reduce renal excretion of urate in both healthy and hypertensi-ve subjects. Thus, the reduced renal excretion of urate among patients with metabolic syndrome may explain the increased frequency of hyperuricemia (12). Insulin may enhance renal urate reabsorption via stimulation of
the urate-anion exchanger URAT1 and/or the Na+
membra-Cop
yright
© ABE&M t
odos os dir
eit
os r
eser
vados
.
nes of the renal proximal tubule (13,14). In addition, because serum concentrations of leptin and urate tend to rise together, some investigators have suggested that leptin may affect renal reabsorption (14,15). Increased consumption of fructose, which is associated with obe-sity, has been shown to elevate concentrations of uric acid (16,17). Finally, in the metabolic syndrome, im-paired oxidative phosphorylation may increase systemic adenosine concentrations by increasing the intracellular concentrations of coenzyme A esters of long-chain fatty acids. Increased adenosine, in turn, can result in renal retention of sodium, urate, and water (18,19). Some have speculated that chronically increased extracellular adenosine concentrations may also contribute to hype-ruricemia by increasing urate production.
Although hyperuricemia is well recognized as a risk factor for atherosclerotic diseases such as myocardial in-farction and stroke, the independence of this association from other confounding factors has remained contro-versial. This is mostly because serum uric acid is associa-ted with other cardiovascular risk factors, such as hyper-tension and dyslipidemia (20). Several previous studies have analyzed possible associations between hyperurice-mia and coronary heart disease and their independence. Although some studies have reported a positive associa-tion between hyperuricemia and coronary heart disease (21,22), others have not (23,24). Most studies showing negative results advocated, as expected, that the asso-ciation between uric acid and coronary heart disease is not truly independent, but it is dependent on other risk factors for coronary heart disease. On the other hand, it is possible that uric acid is an independent risk factor for coronary heart disease in some selected populations, such as alcohol abstainers (25).
In accordance with previous studies, we found that serum uric acid levels are higher in men than in women, although uric acid levels in women tend to increase above the age of 50 (26). Considering both genders, these differences in serum uric acid levels and the in-crease after menopause in females have been reported previously and attributed to the inluence of sexual hor-mones (27). We also found that male subjects have a higher prevalence of hyperuricemia than women. The most striking association found in our study is certainly the close relationship between serum triglycerides and serum uric acid levels and hyperuricemia. This observa-tion was made principally in women. The correlaobserva-tion of triglycerides with uric acid has been previously found in several groups of patients (8,28). The mechanism for
the strong association of triglyceride values and serum uric acid levels has still not been elucidated. Although, genetic factors have been associated with the concur-rence of gout and hypertriglyceridemia, most investi-gators tend to conclude that hyperuricemia and hyper-triglyceridemia relect more the lifestyle of the patient, as part of the metabolic syndrome, than genetic factors (29).
Sustained weight reduction was accompanied by sig-niicant decrease in uricemia as showed by other studies (30,31). Such effect may be explained by a correction of uric acid renal clearance resulting from the near-nor-malization of hyperinsulinemia and insulin resistance. Besides the already known beneits of bariatric surgery on blood pressure, plasmatic lipids and metabolic syn-drome (32-37), improvement of hyperuricemia may contribute to the improvement of cardiometabolic risk in morbidly obese patients.
In conclusion, concentrations of uric acid were as-sociated with the prevalence of metabolic abnormalities in this sample of morbidly obese. Furthermore, weight loss after RYGBP can reduce uric acid levels and the prevalence of hyperuricemia as shown in other articles (30,38).
Disclosure: no potential conlict of interest relevant to this article was reported.
REFERENCES
1. Gertler MM, Garn SM, Levine SA. Serum uric acid in relation to age and physique in health and coronary heart disease. Ann In-tern Med. 1951;54:1421-34.
2. Fang J, Alderman MH. Serum uric acid and cardiovascular mor-tality. The NHANES I epidemiologic follow-up study, 1971–1992. JAMA. 2000;283:2404-10.
3. Wang JG, Staessen JA, Fagard RH, Birkenhäger WH, Gong L, Liu L; for the Systollic Hypertension in China (Syst-China) Trial Collabo-rative Group. Hypertension. 2001;37:1069-74.
4. Culleton BF, Larson MG, Kannel WB, Levy D. Serum uric acid and risk for cardiovascular disease and death: The Framingham Heart Study. Ann Intern Med. 1999;131:7-13.
5. De Leeuw PW, Thijs L, Birkenhäger WH, et al. Prognostic signifi-cance of renal function in elderly patients with isolated systolic hypertension: results from the Syst-Eur Trial. J Am Soc Nephrol. 2002;13:2213-22.
6. Borges RL, Ribeiro AB, Zanella MT, Batista MC. Uric acid as a fac-tor in the metabolic syndrome. Curr Hypertens Rep. 2010;12:113-9. 7. Facchini F, Ida Chen Y-D, Hollenbeck CB, Reaven GM. Relationship
between resistance to insulin-mediated glucose uptake, urinary uric acid clearance and plasma uric acid concentration. JAMA. 1991;266:3008-11.
Cop
yright
© ABE&M t
odos os dir
eit
os r
eser
vados
.
study. Coronary Artery Risk Development in Young Adults. Annals Epidemiol. 1998;8:250-61.
9. Ford ES, Li C, Cook S, Choi HK. Serum concentrations of uric acid and the metabolic syndrome among US children and adoles-cents. Circulation. 2007;115:2526-32.
10. Ishizaka N, Ishizaka Y, Toda E, Nagai R, Yamakado M. Association between serum uric acid, metabolic syndrome, and carotid athe-rosclerosis in Japanese individuals. Arterioscler Thromb Vasc Biol. 2005;25:1038-44.
11. Ter Maaten JC, Voorburg A, Heine RJ, Ter Wee PM, Donker AJ, Gans RO. Renal handling of urate and sodium during acute phy-siological hyperinsulinaemia in healthy subjects. Clin Sci (Lond). 1997;92:51-8.
12. Muscelli E, Natali A, Bianchi S, Bigazzi R, Galvan AQ, Sironi AM, et al. Effect of insulin on renal sodium and uric acid handling in essential hypertension. Am J Hypertens. 1996;9:746-52.
13. Enomoto A, Kimura H, Chairoungdua A, et al. Molecular identifi-cation of a renal urate anion exchanger that regulates blood urate levels. Nature. 2002;417:447-52.
14. Choi HK, Mount DB, Reginato AM. Pathogenesis of gout. Ann In-tern Med. 2005;143:499-516.
15. Lin JD, Chiou WK, Chang HY, Liu FH, Weng HF. Serum uric acid and leptin levels in metabolic syndrome: a quandary over the role of uric acid. Metabolism. 2007;56:751-6.
16. Ludwig DS, Peterson KE, Gortmaker SL. Relation between con-sumption of sugar-sweetened drinks and childhood obesity: a prospective, observational analysis. Lancet. 2001;357:505-8. 17. Heinig M, Johnson RJ. Role of uric acid in hypertension, renal
dise-ase, and metabolic syndrome. Cleve Clin J Med. 2006;73:1059-64. 18. Dhalla AK, Wong MY, Voshol PJ, Belardinelli L, Reaven GM. A1
adenosine receptor partial agonist lowers plasma FFA and im-proves insulin resistance induced by high-fat diet in rodents. Am J Physiol Endocrinol Metab. 2007;292:E1358-63.
19. Castrop H. Mediators of tubuloglomerular feedback regulation of glomerular filtration: ATP and adenosine. Acta Physiol (Oxf). 2007;189:3-14.
20. Nagahama K, Iseki K, Inoue T, Touma T, Ikemiya Y, Takishita S. Hyperuricemia and cardiovascular risk factor clustering in a scre-ened cohort in Okinawa, Japan. Hypertens Res. 2004;27:227-33. 21. Tangri N, Weiner DE. Uric Acid, CKD, and cardiovascular disease:
confounders, culprits, and circles. Am J Kidney Dis. 2010;56:247-50. 22. Palmer IM, Schutte AE, Huisman HW. Uric acid and the cardio-vascular profile of African and Caucasian men. J Hum Hypertens. 2010;24(10):639-45. Epub 2010 Feb 11.
23. Zoppini G, Targher G, Negri C, Stoico V, Perrone F, Muggeo M, et al. Elevated serum uric acid concentrations independently pre-dict cardiovascular mortality in type 2 diabetic patients. Diabetes Care. 2009;32:1716-20.
24. Santos RD. Uric acid and cardiovascular disease: how to solve another chicken or egg puzzle. Cardiology. 2009;114:298-9. 25. Iribarren C, Sharp DS, Curb JD, Yano K. High uric acid: a
metabo-lic marker of coronary heart disease among alcohol abstainers. J Clin Epidemiol. 1996;49:673-8.
26. Freedman DS, Williamson DF, Gunter EW, Byers T. Relation of serum uric acid to mortality and ischemic heart disease. The NHANES I epidemiologic follow-up study. Am J Epidemiol. 1995;141:637-44.
27. Gordon T, Kannel WB. Drinking and its relation to smoking, blood pressure, blood lipids, and uric acid. The Framingham Study. Arch Int Med. 1983;143:1366-74.
28. Conen D, Wietlisbach V, Bovet P, Shamlaye C, Riesen W, Paccaud F, et al. Prevalence of hyperuricemia and relation of serum uric acid with cardiovascular risk factors in a developing country. BMC Public Health. 2004;4:9.
29. Moriwaki Y, Tetsuya Y, Takahashi S, Tsutsumi Z, Higashino K. Apo-lipoprotein E phenotypes in patients with gout: relation with hypertriglyceridemia. Ann Rheum Dis. 1995;54:351-4.
30. Sjöström L, Lindroos AK, Peltonen M, Torgerson J, Bouchard C, Carlsson B, et al. Lifestyle, diabetes, and cardiovascular risk factors 10 years after bariatric surgery. N Engl J Med. 2004;351:2683-93. 31. Luyckx FH, Scheen AJ, Desaive C, Dewe W, Gielen JE, Lefebvre
PJ. Effects of gastroplasty on body weight and related biological abnormalities in morbid obesity. Diabetes Metab. 1998;24:355-61. 32. Serpa Neto A, Rossi FM, Amarante RD, Buriti NA, Rossi M. Impact of plasmatic lipids in glycemic control and its influence in the cardiometabolic risk in morbidly obese subjects. Arq Bras Endo-crinol Metabol. 2009;53:747-54.
33. Serpa Neto A, Bianco Rossi FM, Dal Moro Amarante R, Alves Buri-ti N, Cunha Barbosa Saheb G, Rossi M. Effect of weight loss after Roux-en-Y gastric bypass, on renal function and blood pressure in morbidly obese patients. J Nephrol. 2009;22:637-46.
34. Rossi M, Barretto Fereira da Silva R, Chaves Alcântara G Jr, Re-gina PF, Martin Bianco Rossi F, et al. Remission of metabolic syn-drome: a study of 140 patients six months after Roux-en-Y gastric bypass. Obes Surg. 2008;18:601-6.
35. Novais PF, Rasera Junior I, Leite CV, Oliveira MR. Body weight evolution and classification of body weight in relation to the re-sults of bariatric surgery: roux-en-Y gastric bypass. Arq Bras En-docrinol Metabol. 2010;54:303-10.
36. Carvalho PS, Moreira CL, Barelli Mda C, Oliveira FH, Guzzo MF, Miguel GP, et al. Can bariatric surgery cure metabolic syndrome? Arq Bras Endocrinol Metabol. 2007;51:79-85.
37. Geloneze B, Pareja JC. Does bariatric surgery cure the metabolic syndrome? Arq Bras Endocrinol Metabol. 2006;50:400-7. 38. Nakanishi N, Nakamura K, Suzuki K, Matsuo Y, Tatara K. Relation