ISSN 0104-6632 Printed in Brazil
www.abeq.org.br/bjche
Vol. 30, No. 01, pp. 95 - 104, January - March, 2013
Brazilian Journal
of Chemical
Engineering
ON THE RELATIONSHIP BETWEEN THE
SOLUBILITY OF PROTEINS AND THE OSMOTIC
SECOND VIRIAL COEFFICIENT
L. F. M. Franco and P. de A. Pessôa Filho
*Bioprocess Engineering Group, Chemical Engineering Department, School of Engineering, Universidade de São Paulo, Phone: + (55) (11) 3091-1106, Fax: + (55) (11) 3091-2284, Caixa Postal 61548, 05424-970 São Paulo - SP, Brazil.
E-mail: [email protected]
(Submitted: March 5, 2012 ; Revised: July 13, 2012 ; Accepted: October 11, 2012)
Abstract - A relationship between the osmotic second virial coefficient of proteins in aqueous salt solutions, the solubility of proteins in these solutions and the salt concentration is presented. The model developed considers that the solid-liquid equilibrium is established with neutral protein molecules and that the relationship between the protein solubility and the salt concentration follows Cohn's equation. The validity of the model is restricted to the salting-out region of the phase diagrams, which is the situation of greater practical importance. The resulting equations were successfully applied to systems containing lysozyme and ovalbumin.
Keywords: Thermodynamic modeling; Protein; Osmotic second virial coefficient; Solubility; Salt.
INTRODUCTION
The precipitation and the crystallization of proteins out of an aqueous solution are unit operations widely employed in biotechnological processes. The most important phenomenon involved in these unit operations is the protein solid-liquid equilibrium, the main parameter of which is the protein solubility, viz., the concentration of a protein in a given aqueous solution (at constant temperature and pressure) that is in equilibrium with the solid phase. The design and the correct operation of such processes require the knowledge of protein solubility, as well as of physical-chemical properties such as the protein isoelectric point and hydrophobicity.
Another parameter of crucial importance in this kind of process is the osmotic second virial coefficient. This fact was first observed by George et al. (1997), who determined that the crystallization of proteins occurs within a range of values of the osmotic second virial coefficient. Negative and large
values (in absolute value) are related to strongly attractive intermolecular forces, which result in amorphous precipitation (Prausnitz, 2003). Theoretical models for the potential of the mean force (Lima et al., 2009) and of equations of state (Mollerup and Breil, 2009ab) have recently being proposed for calculating the value of this coefficient.
interest and the multitude of conditions occurring in industrial processes.
Theoretical relations between the osmotic second virial coefficient and protein solubility were developed by Guo et al. (1999), Haas et al. (1999) and Ruppert et al. (2001). Guo et al. (1999) developed an expression wherein this relationship depends on the difference between the chemical potential in the standard state in the liquid phase and the chemical potential in the crystal lattice; the relationship was applied to calculate the chemical potential difference for several pairs of solubility and osmotic second virial coefficients. Haas et al. (1999) developed a different relation from the definition of the second virial coefficient as given by statistical thermodynamics. These authors considered the anisotropy of the interaction of non-spherical molecules and applied either a square well or the Yukawa potential to hypo-thetical systems. The work by Ruppert et al. (2001) assumed the validity of Henry's law and presented a theoretical proposal to convert the experimental osmotic second virial coefficient into the corresponding osmotic second virial coefficient in the limit of McMillan-Mayer. These authors applied this relation to systems containing lysozyme and ovalbumin.
In this context, it is worth mentioning the work by Allahyarov et al. (2002), who calculated values of the osmotic second virial coefficient as a function of salt concentration for hypothetical protein solutions through molecular dynamics and concluded that the dependence between those parameters is not monotonic like predicted by DLVO theory. In addition to these theoretical models, some empirical equations have been recently proposed in literature (Mehta
et al., 2012).
A relationship between protein solubility and the osmotic second virial coefficient is presented herein. This relationship is entirely based on classical thermodynamics and entails the validity of Cohn’s equation (Cohn, 1925), which restricts the development to the region of phase diagrams wherein an increase of the salt concentration results in a decrease in protein solubility (i.e., the salting-out region). This situation is the most important one from the point of view of industrial applications. The methodology developed is applied to the modeling of aqueous solutions of lysozyme and ovalbumin.
THEORETICAL FRAMEWORK
A relationship between the protein solubility and the solution pH was presented in a previous work (Franco and Pessôa Filho, 2011). It was shown that,
for the modeling of the solid-liquid equilibrium of proteins, it is important to consider all protein ionization states in the thermodynamic description. The same hypothesis is made here: the solid-liquid equilibrium is established only between electrically neutral protein molecules in solution, since the solid phase contains only electrically neutral protein molecules. As observed by Moretti et al. (2000) and Watanabe et al. (2009), the solid phase may contain salt and water in addition to protein molecules; however, the salt ions are bound in such a manner to certain residues of the protein chain that the salt-water-protein complex behaves as a single electrically neutral compound.
Using the molality scale, the chemical potential of a given compound j in solution can be expressed as:
(
)
(
)
jL * *
j j * ji i
j i
m
μ T, m =μ T, m + RTln + 2RT B m
m
∑
(1)where m is the molality in the standard state, and * Bji is the osmotic second virial coefficient related to
species i and j. The summation in this equation is carried out over all solutes. Considering that protein molecules in different ionization states constitute different species, but that the second virial coefficient is independent of the ionization state, one gets for the neutral molecules in solution:
(
)
(
)
( )
L * * 0
0 0 0 *
0
* *
i 0
i 0 * 0
m
μ T, m =μ T, m + RTln
m
+ 2RTB m =μ m
m
+ RTln + 2RTBS
m
∑
(2)where S is the protein solubility (i.e., the summation of the concentration of all protein molecules irrespective of their net charge) expressed on the molality scale.
Taking the partial derivative of the above expression in relation to the salt molality in the liquid phase, and considering that the temperature is constant:
( )
*( )
* L0
0 0 0
salt salt salt
salt salt
μ m
μ m ln(m )
= + RT
m m m
S B
+ 2RTB + 2RTS
m m
∂
∂ ∂
∂ ∂ ∂
∂ ∂
∂ ∂
in which m0 is the molality of neutral protein
molecules in the liquid phase, which is calculated through the product of the fraction of electrically neutral protein molecules in the liquid phase and the solubility (S) of the protein (Franco and Pessôa Filho, 2011):
0 0
m =φ ⋅S (4)
where φ0 is the fraction of neutral molecules. Substituting Equation (4) into Equation (3) and performing some algebraic manipulation, it can be shown that:
( )
( )
* *
0 0
salt salt salt
L 0
salt salt salt
μ m
1 RT ln lnS
+ +
SB m SB m m
μ m
lnB lnS 1
+2RT + =
m m SB m
∂ ⎛∂ φ ∂ ⎞
⎜ ⎟
∂ ⎝∂ ∂ ⎠
∂
⎛ ∂ ∂ ⎞
⎜∂ ∂ ⎟ ∂
⎝ ⎠
(5)
Along the solubility curve, the chemical potential of the protein in the solid phase is constant, as it does not depend on the liquid phase composition. Nonetheless, there is evidence that there may be solid phase transitions along the solubility curves (Watanabe et al., 2009); such transitions are discrete, so that, within a given region of the phase diagram, the protein chemical potential in the solid phase must be constant. Hence, the criterion for solid-liquid phase equilibrium is:
(
)
( )
L S
0 0 0
μ T, m =μ T (6)
which means that, at constant temperature:
(
)
L
0 0
salt
μ T, m = 0 m
∂
∂ (7)
Equation (5) can thus be written as:
( )
* *
0 0
salt salt salt
salt salt
μ m
1 RT ln lnS
+ +
SB m SB m m
lnB lnS
+2RT + = 0
m m
∂ ⎛∂ φ ∂ ⎞
⎜ ⎟
∂ ⎝∂ ∂ ⎠
⎛ ∂ ∂ ⎞
⎜∂ ∂ ⎟
⎝ ⎠
(8)
This equation is a theoretical relationship connecting the osmotic second virial coefficient, the protein solubility in the liquid phase and the salt
molality in the liquid phase. It can be used if one previously establishes how the reference chemical potential varies with salt molality and how to calculate the fraction of electrically neutral protein molecules.
Cohn’s Equation
The so-called Cohn's equation (Cohn, 1925) is an empirical equation that correlates the protein solubility and the salt molality in the salting-out region. Due to its remarkable ability to describe several systems with few parameters, this equation has gained much notoriety and is extensively used to model protein solubility data in the study of unit operations based on protein precipitation. It can be written as (Cohn, 1925):
s salt
lnS = −K m (9)
It should be noted that, theoretically, the value of Ks does not depend on the solution pH. If Cohn's
equation is valid, the partial derivative of the natural logarithm of the protein solubility in relation to the salt molality, which appears in Equation (8), can be written simply as:
s salt lnS
= K m
∂ −
∂ (10)
Although Cohn's equation is intrinsically empirical, Melander and Horváth (1977) offered a theoretical explanation for the form of Cohn's equation that provided an interpretative formulation of the parameters of this equation. This explanation can also be used to elucidate the variation of the reference chemical potential in Equation (8), as will be seen in the next section.
Reference Chemical Potential
According to Sinanoğlu and Abdulnur (1965) and Melander e Horváth (1977), the difference between the chemical potential of a protein molecule in a hypothetical gas phase and the chemical potential of the same protein molecule in solution can be written as:
*
cav elet vdW
RT
Δμ =Δμ +Δμ +Δμ + RTln
pV
⎛ ⎞
⎜ ⎟
⎝ ⎠ (11)
the protein molecule from the hypothetical gas phase into the solution, Δμcav is the variation of chemical potential involved in the formation of a cavity in the solvent in which to insert the solute molecule, Δμelet is the electrostatic contribution to the chemical potential, ΔμvdW is the variation of the chemical potential due to the attractive (van der Waals type) interactions between the solvent and the solute. The last term of Equation (11) is due to the change in the free volume.
When only the salt concentration in the liquid phase changes (and there is no significant change in the interactions between the protein molecule and the salt ions), one can assume that the energy of the transfer process is affected only by changes in Δμcav and Δμelet. Since the other terms are kept unchanged with the variation of the salt concentration, it is sufficient to evaluate these two terms. Following the approach proposed by Melander and Horváth (1977), one can write for
cav
Δμ :
(
)
1/3 e 2/3
cav A A
Δμ =⎡⎣N A + 4.8 N κ −1 V ⎤⎦ γ
(12)
in which NA is the Avogadro's number, A is the
molecular surface area of the solute, κe corrects the macroscopic surface tension of the solvent to molecular dimensions, V is the molar volume and is the solvent surface tension. Considering that the surface tension is a linear function of the salt molality (Melander and Horváth, 1977):
0
salt m
γ = γ + σ (13)
where 0 is the surface tension of pure water and σ is the molal surface tension increment.
For the electrostatic term, one can combine the Debye-Hückel theory, which is limited to small values of the ionic strength, with the Kirkwood model for the protein dipole, which is valid at higher ionic strengths. Thus, one can write:
DH salt
elet DH K d salt
DH salt
B m
Δμ = A D μ m
1+ C m
− − (14)
On the other hand, assuming a reference state at a certain salt molality m1, and another reference state
with an equilibrium salt molality m2, the difference
between the chemical potential of these states is equal to the difference between the chemical
potentials for transfer:
(
)
(
)
2* 1* 2* 1*
cav elet 2
cav elet 1
μ μ =Δμ Δμ = Δμ +Δμ
Δμ +Δμ
− −
− (15)
Hence, one can write:
*
cav elet
salt salt salt
μ Δμ Δμ
= +
m m m
∂ ∂ ∂
∂ ∂ ∂ (16)
In the salting-out region, the salt molalities are sufficiently high to consider the following approximation, valid for the partial derivative of
elet
Δμ in relation to the salt molality through
Equation (14):
elet
DH salt K d
salt
Δμ
C m 1 D μ = RTΛ
m
∂
>> ⇒ ≈ − −
∂ (17)
Following Melander and Horváth (1977), one defines Λ as a salting-in coefficient related to the electrostatic interactions. From Equation (12), one can write:
(
)
1/3 e 2/3
cav
A A
salt
Δμ
A + 4.8N σ= RTΩ
m = N κ 1 V
∂ σ
∂ ⎡⎣ − ⎤⎦ (18)
in which Ωσ is the salting-out coefficient related to the hydrophobic interactions, also defined by Melander and Horváth (1977).
Therefore, the variation of the reference chemical potential of the protein molecule in the liquid phase in relation to the salt molality is given by:
*
s salt
μ
= RTK m
∂
∂ (19)
where Ks is the salting-out constant, defined by:
s
K =Ωσ Λ− (20)
which is precisely the same parameter that appears in Cohn's equation, i.e., Equation (9).
Proposed Model
0
salt salt salt
1 ln lnB lnS
+ 2 + = 0
SB m m m
⎛ ⎞
∂ φ ∂ ∂
⎜ ⎟
∂ ⎝∂ ∂ ⎠ (21)
This equation is a general one that relates the osmotic second virial coefficient (B), the protein solubility (S) and the salt molality (msalt) in the
salting-out region. The fraction of the electrically neutral protein molecules (φ0)is a function of the salt molality, the pH, the temperature, the pKA values
(Franco and Pessôa Filho, 2011) and the constants of the chemical equilibrium between the salt ions and the polar residues of the protein chain. Although the description of this fraction is not trivial, given that it depends upon salt ions, it can be assumed that, in the salting-out region, it is approximately constant. Thus:
0 salt ln
0 m
∂ φ ≈
∂ (22)
and Equation (21) reduces to:
salt salt
lnB lnS
+ = 0
m m
∂ ∂
∂ ∂ (23)
Alternatively, substituting for the value of the partial derivative of the solubility (S) using Equation (10) results in:
s salt lnB
= K m
∂
∂ (24)
Integrating both equations between an appropriate reference state (identified by the asterisk) and the actual condition results in:
* * B S S =
B (25)
(
*)
s salt salt *
B
ln = K m m
B
⎛ ⎞ −
⎜ ⎟
⎝ ⎠ (26)
Equation (25) is an expression that relates the protein solubility to the osmotic second virial coefficient at different salt concentrations. Equation (26) states that the relation between the natural logarithm of the osmotic second virial coefficient and the equilibrium salt molality is linear and its angular coefficient is the salting-out constant defined by Cohn's equation, Equation (9).
RESULTS AND DISCUSSION
Even though protein solubility data at different salt concentrations can be found for many proteins and salts, data for the second virial coefficient are rather scarce, and data for the solubility and the second virial coefficient in the same or comparable conditions are almost inexistent – mostly due to the fact that, at high salt concentrations, the protein solubility is usually low, which hinders the measure-ment of the osmotic second virial coefficient. Therefore, the application of Equation (25) and (26) will be restricted to data for lysozyme and ovalbumin, the only two proteins for which both kinds of data can be found in the literature.
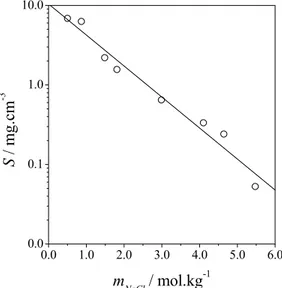
Figure 1 shows the results of the application of Equation (9), or Cohn's equation, to lysozyme solubility data obtained by Watanabe et al. (2009). For this system, the value of Ks is 0.897 kg·mol-1; the
agreement of Cohn's equation with the experimental data, in this case, is very good (R2 = 0.97).
0.0 1.0 2.0 3.0 4.0 5.0 6.0
0.0 0.1 1.0 10.0
S
/ mg
.c
m
-3
mNaCl / mol.kg-1
Figure 1: Solubility of hen egg white lysozyme as a function of sodium chloride molality. Experimental data (symbol): Watanabe et al. (2009). Modeling (continuous line): Cohn’s equation.
results of the application of Equation (26) to those systems. A value of -10.0·10-4 cm3·mol·g-2 was arbitrarily assigned to B*. One should note that, due to the form of Equation (26), changing the value of the reference B* would result in different values of
* salt
m without affecting the model performance. The
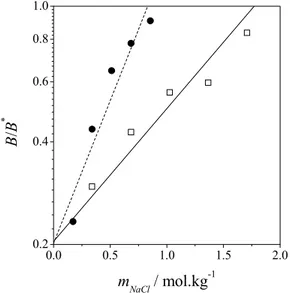
values of m*salt were 1.77 mol·kg-1 for native lysozyme and 0.83 mol·kg-1 for D101F lysozyme. The value of the salting-out constant, 0.897 kg·mol-1, obtained from solubility data, was employed for native lysozyme. The agreement in this case is remarkable (R2 = 0.89) given that only a single parameter, m*salt, was adjusted. For the sake of com-parison, the value calculated for D101F lysozyme is 1.93 kg·mol-1, which shows how sensitive this kind of data can be: the fact that the change of a single residue of the protein chain is responsible for such an increase in the value of Ks shows the relevance of the
primary structure in the thermodynamic modeling of such systems. In this case, the value of R2 was 0.91.
0.0 0.5 1.0 1.5 2.0
0.2 0.4 0.6 0.8 1.0
B
/
B
*
mNaCl / mol.kg-1
Figure 2: Values of the osmotic second virial coefficient at different sodium chloride molalities and pH = 4.5. Experimental data obtained by Curtis
et al. (2002). Native lysozyme, model (continuous line), experimental data (open squares); lysozyme D101F, model (dotted line), experimental data (filled circles).
Equation (25) was also applied to systems containing lysozyme. Figure 3 shows the results and a comparison between the model proposed here and those proposed by Guo et al. (1999), Haas et al. (1999) and Ruppert et al. (2001). To compare the models, the relative root mean square deviation was used:
2
N exp calc
i i
exp i i 1
S S
1
RMSD 100
N = S
⎛ − ⎞
= ⎜⎜ ⎟⎟
⎝ ⎠
∑
(27)in which N is the number of experimental data. Table 1 shows the comparison between those models con-cerning the value of RMSD.
-10.0 -8.0 -6.0 -4.0 -2.0 0.0 2.0 4.0 0.0
10.0 20.0 30.0 40.0 50.0 60.0
S
/ m
g
.cm
-3
B x 104 / cm3.mol.g-2
Figure 3: Values of lysozyme solubility as a function of the osmotic second virial coefficient.
Experimental data from Gripon et al. (1997):
lysozyme at 25 ºC and pH = 4.2 with changes in the sodium chloride concentration (open circles); experimental data from Cacioppo and Pusey (1991): lysozyme at 18 ºC and pH = 4.5 with changes in the ammonium chloride concentration (open squares); experimental data from Ries-Kautt and Ducruix (1989): lysozyme at 23 ºC and pH = 7.8 with changes in the magnesium bromide concentration (filled diamonds). Modeling: the model of Haas et al. (1999) with z = 4 and A = 0.01 (dotted line); the empirical equation proposed by Mehta et al. (2012) with Acm1
= 2.94·10-4 cm3 mol g-2 and Bcm1 = -0.4·10-4 cm3 mg-1
(dotted-dashed line); the model of Ruppert et al. (2001) with Ac = 0.42 and K =0.95 (dashed line), and
Equation (25) with B* = -4.4·10-4 cm3·mol·g-2 and S* = 6.0 mg cm-3 (continuous line).
Table 1: Comparison between the values of the relative RSMD of systems containing lysozyme.
Model RSMD
Proposed model – Equation (26) 39.0%
Model of Haas et al. (1999) 41.2%
Model of Ruppert et al. (2001) 28.2%
While Figure 3 shows that all tested models can qualitatively represent the second virial coefficient, Table 1 shows that this agreement cannot be considered to be quantitative. A possible reason for this behavior is the scatter of the experimental data: a single curve with a single set of parameters would not be able to correlate all of the data quantitatively. Concerning the proposed model, it can be seen that the agreement with the experimental data is comparable to that of the other models. It must be observed, however, that the proposed model is simpler and requires fewer parameters than the other models.
It is necessary to stress that the validity of Equations (25) and (26) is restricted to the region of salting-out in the phase diagram of the protein of interest, i.e., the region wherein the values of the osmotic second virial coefficient are negative, since positive values of the osmotic second virial coefficient are not compatible with the precipitation phenomenon (Prausnitz, 2003). Figure 3 shows that, indeed, the more negative the osmotic second virial coefficient, the lower the value of the protein solubility. This behavior can be related to the physical meaning of the osmotic second virial coefficient: the more negative this parameter, the more attractive are the forces between the protein molecules that promote aggregation and lower the protein concentration in equilibrium in liquid phase.
Figure 4 shows the experimental data for ovalbumin solubility in ammonium sulfate solutions, along with the adjusted Cohn's equation for this set of experimental data (Judge et al., 1996). The value of Ks obtained is 2.45 kg·mol
-1
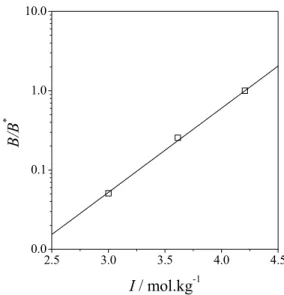
and, as can be seen, the agreement with Cohn's equation is excellent (R2 = 1.0). In this case, the ionic strength was used instead of the molality: this choice does not change the results, as they are proportional. Using this value of Ks, it is possible to apply Equation (26) in a
predictive way. Figure 5 shows the results for the prediction of osmotic second virial coefficient data by Mehta et al. (2012); in this case, the reference value of B* was set to -12.7·10-4 cm3·mol·g-2 (the largest absolute value of B in the experimental set) and the value of the reference ionic strength (I*) was 4.2 mol·kg-1, which corresponds to a reference salt concentration (m*salt) of 1.4 mol·kg-1. Although the value of Ks was adjusted from experimental data at a
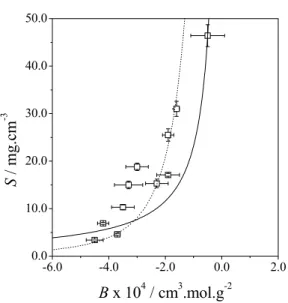
slightly different pH value, the concordance between the model and the experimental data is excellent (R2 = 1.0). Figure 6 shows the correlation between the osmotic second virial coefficient and ovalbumin solubility data reported by Demoruelle et al. (2002),
as well as the curves predicted by the model developed here (with the following reference parameters: B* = -0.5·10-4 cm3·mol·g-2 and S* = 46.4 mg·cm-3) and by the model of Haas et al. (1999). Both models describe this correlation qualitatively. The values of the RMSD, defined by Equation (27), were 37.3% for Equation (25) and 112.3% for the model of Haas et al. (1999) using the parameters adjusted by Demoruelle et al. (2002).
4.5 5.0 5.5 6.0 6.5
0.1 1.0 10.0 100.0
S
/
m
g
.c
m
-3
I / mol.kg-1
Figure 4: Ovalbumin solubility in ammonium sulfate solution at pH = 4.5. Experimental data (open
squares) from Judge et al. (1996) and Cohn’s
equation (continuous line).
2.5 3.0 3.5 4.0 4.5
0.0 0.1 1.0 10.0
B/
B
*
I / mol.kg-1
Figure 5: Osmotic second virial coefficient of ovalbumin in ammonium sulfate solutions at pH= 4.0. Experimental data (open squares) from Mehta et al. (2012) and Equation (24) with Ks = 2.45 kg mol-1
-6.0 -4.0 -2.0 0.0 2.0 0.0
10.0 20.0 30.0 40.0 50.0
S
/
mg.c
m
-3
B x 104 / cm3.mol.g-2
Figure 6: Values of ovalbumin solubility as a function of the osmotic second virial coefficient. Experimental data (open squares) from Demoruelle
et al. (2002).Modeling: the model of Haas et al. (1999) with z = 6 and A = 0.084 (dotted line) and Equation (25) with B* = -0.5·10-4 cm3·mol·g-2 and S* = 46.6 mg cm-3 (continuous line).
These results clearly show that the relationship established in Equations (25) and (26) can describe most of the available experimental data within the experimental uncertainty and is at least as accurate as other reported models. The relationship established between the osmotic second virial coefficient and the salting-out constant in Equation (26), unequivocally relates the capacity of a salt to induce the precipitation of a certain protein and its effect upon the solubility of this protein. This is important because, although second virial coefficients are difficult to determine at high salt concentrations due to the lower solubility of proteins, this is precisely the region of the phase diagram of greatest practical significance.
CONCLUSIONS
A relationship between the osmotic second virial coefficient and parameters of interest such as the protein solubility and the concentration of precipitating agents was developed from classical thermodynamic relations. The resulting model is valid in the salting-out region of phase diagrams. The model was successfully applied for the description of systems containing lysozyme and ovalbumin, employing data from different sources. The resulting equations of the model developed here
are simple, which makes them easy to implement in engineering calculations without loss of accuracy.
ACKNOWLEDGMENTS
The authors gratefully acknowledge financial support from the Brazilian agencies FAPESP (grants 2008/11232-1 and 2009/06575-0), CNPq and CAPES.
NOMENCLATURE
Latin Letters
A molecular surface area of
the solute
m2
ADH parameter of the
Debye-Hückel equation
kg·m2·mol-1·s-2
B osmotic second virial
coefficient
kg·mol-1or m3·mol·kg-2
BDH parameter of the
Debye-Hückel equation
kg3/2·m2·mol-3/2·s-2
CDH parameter of the
Debye-Hückel equation
kg1/2·mol-1/2
DK Parameter of the
Kirkwood equation
kg2·m·C-1·mol-2·s-2
I ionic strength mol·kg-1
Ks salting-out constant kg·mol-1
mi molality of compound i mol·kg-1
* i
m molality of compound j in
the reference state
mol·kg-1 m0 molality of the electrically
neutral protein molecules
mol·kg-1
msalt salt molality mol·kg-1
N number of experimental
data
NA Avogadro’s number mol-1
R gas constant kg·m2·mol-1·K-1·s-2
S solubility mol·kg-1
T temperature K
Greek Letters
parameter in Cohn’s
equation
solvent surface tension kg·s-2
0
pure water surface tension kg·s-2
κe
term that corrects the macroscopic surface tension of the solvent to molecular dimensions
Λ salting-in coefficient kg·mol-1
μd electric dipole moment C·m
μj chemical potential of
compound j
J·mol-1
μjL chemical potential of
compound j in the liquid phase
J·mol-1
μjS chemical potential of
compound j in the solid phase
J·mol-1
μj* chemical potential of
compound j in the reference state
J·mol-1
Δμ* transfer chemical potential of a protein molecule from the hypothetical gas phase to solution
J·mol-1
Δμcav variation of the chemical
potential due to the formation of a cavity in which to insert the molecule into the solution
J·mol-1
Δμelet electrostatic contribution to
the change of the chemical potential
J·mol-1
ΔμvdW variation of the chemical
potential due to the van der Waals attractive
interactions for the solvent-solute pair
J·mol-1
σ molal surface tension
increment
kg2·mol-1·s-2
φ0 fraction of electrically
neutral protein molecules
Ω ratio between the
salting-out coefficient and the molal surface tension increment
s2·kg-1
REFERENCES
Allahyarov, E., Löwen, H., Louis, A. A., Hansen, J. P., Discrete charges patterns, Coulomb correlations and interactions in protein solutions. Europhys. Lett., 57, 731-737 (2002).
Behlke, J., Ristau, O., Analysis of the thermodynamic non-ideality of proteins by sedimentation equilib-rium experiments. Biophys. Chem., 76, 13-23 (1999).
Cacioppo, E., Pusey, M. L., The solubility of the tetragonal form of hen egg white lysozyme from pH 4.0 to 5.4. J. Cryst. Growth, 114, 286-292 (1991).
Cohn, E. J., The physical chemistry of the proteins. Physiol. Rev., 5, 349-437 (1925).
Curtis, R. A., Steinbrecher, C., Heinemann, M., Blanch, H. W., Prausnitz, J. M., Hydrofobic forces between protein molecules in aqueous solutions of concentrated electrolyte. Biophys. Chem., 98, 249-265 (2002).
Demoruelle, K., Guo, B., Kao, S., McDonald, M., Nikic, D. B., Holman, S. C., Wilson, W. W., Correlation between the osmotic second virial coefficient and solubility for equine serum albumin and ovalbumin. Acta Cryst. D, 58, 1544-1548 (2002).
Franco, L. F. M., Pessôa Filho, P. de A., On the solubility of proteins as a function of pH: Mathematical development and application. Fluid Phase Equilibr., 306, 242-250 (2011).
George, A., Chiang, Y., Guo, B., Arabshahi, A., Cai, Z., Wilson, W. W., Second virial coefficient as predictor in protein crystal growth. Methods Enzymol., 276, 100-110 (1997).
Gripon, C., Legrand, L., Rosenman, I., Vidal, O., Robert, M. C., Boué, F., Lysozyme-lysozyme interactions in under- and super-saturated solutions: A simple relation between the second virial coefficients in H2O and D2O. J. Cryst. Growth,
178, 575-584 (1997).
Guo, B., Kao, S., McDonald, H., Asanov, A., Combs, L. L., Wilson, W. W., Correlation of second virial coefficients and solubilities useful in protein crystal growth. J. Cryst. Growth, 196, 424-433 (1999).
Haas, C., Drenth, J., Wilson, W. W., Relation between the solubility of proteins in aqueous solutions and the second virial coefficient of the solution. J. Phys. Chem. B, 103, 2808-2811 (1999).
Judge, R. A., Johns, M. R., White, E. T., Solubility of ovalbumin in ammonium sulfate solutions. J. Chem. Eng. Data, 41, 422-424 (1996).
Lima, E. R. A., Biscaia Jr., E. C., Boström, M., Tavares, F. W., Prausnitz, J. M., Osmotic second virial coefficients and phase diagrams for aqueous proteins from a much-improved Poisson-Boltzmann equation. J. Phys. Chem. C, 111, 16055-16059 (2009).
Mehta, C. H., White, E. T., Litster, J. D., Correlation of second virial coefficient with solubility for proteins in salt solutions. Biotechnol. Prog., 28, 163-170 (2012).
Mollerup, J. M., Breil, M. P., On the thermodynamics of the McMillan-Mayer state function. Fluid Phase Equilibr., 276, 18-23 (2009a).
Mollerup, J. M., Breil, M. P., The osmotic second virial coefficient and the Gibbs-McMillan-Mayer framework. Fluid Phase Equilibr., 286, 88-94 (2009b).
Moretti, J. J., Sandler, S. I., Lenhoff, A. M., Phase equilibria in the lysozyme-ammonium sulfate-water system, Biotechnol. Bioeng., 70, 498-506 (2000). Prausnitz, J. M., Molecular thermodynamics for
some applications in biotechnology. J. Chem. Themodynamics, 35, 21-39 (2003).
Ries-Kautt, M. M., Ducruix, A. F., Relative effec-tiveness of various ions on the solubility and crystal growth of lysozyme. J. Biol. Chem., 264, 745-748 (1989).
Ruppert, S., Sandler, S. I., Lenhoff, A. M., Correlation between the osmotic second virial coefficent and
the solubility of proteins. Biotechnol. Prog., 17, 182-187 (2001).
Sinanoğlu, O., Abdulnur, S., Effect of water and other solvents on the structure of biopolymers. Fed. Proc., 24, 12-23 (1965).
Tessier, P. M., Lenhoff, A. M., Sandler, S. I., Rapid measurement of protein osmotic second virial coefficients by self-interaction chromatography. Biophys. J., 82, 1620-1631 (2002).
Watanabe, E. O., Popova, E., Miranda, E. A., Maurer, G., Pessôa Filho, P. de A., Phase equilibria for salt-induced lysozyme precipitation: Effect of salt type and temperature. Fluid Phase Equilibr., 281, 32-39 (2009).