Nadyr Antonia Damasceno
1, Eduardo de França Damasceno
21Marcilio Dias Naval Hospital, Rio de Janeiro/RJ, Brazil.
2Assistant Professor of Ophthalmology, Fluminense Federal University (UFF), Rio de Janeiro/RJ, Brazil. The authors declare no conflicts of interest
Received for publication: 15/5/2013 - Accepted for publication: 2/7/2013.
Analysis of accommodation capacity in
presbyopic patients with low body mass index
Análise da capacidade de acomodação em pacientes présbitas
com baixo índice de massa corporal
A
BSTRACTPurpuse: To determine the correlation between presbyopia and body mass index. Methods: Cross-sectional study involving 1030 patients with visual acuity of 20/20 emmetropy, aged between 36-40 years, 51-55 years and 60-65 years, excluding patients with positive test cover, anisometropy with convergence insufficiency or high correlation convergence / accommodation. Assessment of body mass index of all patients, Results: Cross-sectional study involving 1030 patients with visual acuity of 20/20 emmetropy, aged between 36-40 years, 51-55 years and 60-65 years, excluding patients with positive cover test, anisometropy with convergence insufficiency or high correlation convergence / accommodation. Assessment of body mass index of all patients Conclusion: As demonstrated by statistical analysis there is a significant correlation between low body weight defined as a body mass index below 18.5 and a lower incidence of presbyopia or delay its onset and progression with age.
Keywords: Presbyopia; Low body weight; Body mass index
R
ESUMODobras de coroide é considerado o achado fundoscópico mais prevalente nos casos de tumor orbitário. São ondulações no epitélio pigmentado da retina, membrana de Bruch, porção interna da coriocapilar e que, em alguns casos, podem acometer a retina neurossensorial, sendo então chamadas de dobras coriorretinianas. Diversas condições, oculares e sistêmicas, cursam com dobras de coroide e devem ser corretamente investigadas e, caso necessário, prontamente tratadas. Nesta revisão iremos abordar os aspectos gerais das dobras de coroide, enfatizando suas características nos seguintes exames de imagem: Retinografia, autofluorescência, angiofluoresceínografia e tomografia de coerência óptica.
Diagram 1
Data collection process used in this study
Electronic chart review (in a universe of more than 20,000 patients)
Initial participation confirmed (eligible for inclusion)
Phone
contact
NEGATIVE
“
Does not want to takepart in the study
”.
Assessment of inclusion and exclusion criteria
Visit to confirm data and perform new tests: “refraction, cover test, accommodation/convergence”,
confirm weight and height
POSITIVE
“Wants to take part in the study” Inform weight and
height
NEGATIVE
“Not included in the study”.
POSITIVE
“Included in the study”.
New visit to confirm data through the following tests: “refraction, cover test, accommodation/
convergence”, confirm weight and height
I
NTRODUÇÃOV
isual accommodation refers to changes in lens refraction allowing images to reach the retina accurately regardless of the distance of the visual object.Presbyopia is defined as age-related loss of lens accommodation resulting in an inability to focus on and observe objects at a close distance. It is the most common physiological change in vision during adult life. People affected by presbyopia often complain of headaches and progressive ocular discomfort due to increasing difficulties in focusing for near vision(1).
Its pathophysiology is based on the hypotheses of decreased elasticity of structures in the lens capsule and fibres in the zonule of Zinn and an inability of ciliary muscle fibres to perform accommodation(2,3).
The loss of visual accommodation is progressive during adult life, being eventually noticed in the 4th decade of life when
patients typically require visual correction. Dynamic and statistical visual stimuli tend to exacerbate its presence(4).
Reading glasses have been the most common treatment for the condition for years. However, some factors seem to influence the choice of therapy, such as age, sex, and social characteristics(5,6).
Currently, the possibility of surgical correction and contact lenses have spawned renewed interest in researching the condition, which in the past was thought to be entirely understood without the need for further study(7).
One factor related with presbyopia which has not yet been researched is body mass index (BMI). This study aimed to study BMI as a factor possibly related with presbyopia.
BMI is a measure used internationally to calculate whether a person’s weight is ideal. It is a fast and easy method to assess
the degree of body fat in a person, i.e., it is a predictor of obesity adopted by the World Health Organization (WHO).
BMI is determined by dividing an individual’s body mass by their squared height, with mass in kilograms and height in metres. BMI is then classified into six ranges: under 18.5, underweight; 18.6-24.9, normal weight; 25-29.9, overweight; 30.0-34.9, moderate obesity; 35-39.9, severe obesity; and over 40.0, morbid obesity.
According to Kuang et al. (2005) there are different classifications depending on the population characteristics in each country, and classifications may be modified depending on changes over time and issues related to public health(8).
The aim of this study was to assess whether low BMI is a factor that may influence presbyopia. This was done through observations and statistical tests.
não pesquisado, é o índice de massa corporal (IMC). Esta condição é objeto de estudo nesse trabalho, como um possível fator correlacionado com a presbiopia.
O IMC é definido como uma medida internacional usada para calcular se uma pessoa está no peso ideal. Trata-se de um método fácil e rápido para a avaliação do nível de gordura de cada pessoa, ou seja, é um preditor internacional de obesidade adotado pela Organização Mundial da Saúde (OMS).
O IMC é determinado pela divisão da massa do indivíduo pelo quadrado de sua altura, onde a massa está em quilogramas e a altura está em metros. Sua classificação é baseada em seis escalas: menor que 18,5 - baixo do peso, de 18,6 ate 24,5 - peso normal, de 25 ate 29,9 - sobrepeso, de 30,0 ate 34,9 - obesidade moderada, de 35 ate 39,9 obesidade severa e maior de 40,0 -obesidade mórbida.
S a m p l e Percent Age group Statistical S e x Statistical Date (n) ( % ) Mean ± sd test m a l e / test
f e m a l e
2 8 9 7 1 0 0 53,87 ± 1,576 1 5 6 7 \ 1 3 3 0
1 6 8 7 5 8 , 2 3 51,23 ± 2,344 9 8 5 \ 7 0 2
Exclude due to
1 0 6 3 , 6 5 49,77 ± 1766 5 7 \ 4 9 ophthalmic conditions
Exclude due to age 5 5 1 1 9 , 0 1 48,66 ± 1,987 2 8 9 \ 2 6 2
Sample used to form groups 1 0 3 0 3 5 , 5 5 59,04 ± 2,127 5 1 3 \ 5 1 7
Group I: IMC > 18,5 2 4 3 8 , 3 8 39,28 ±1,675 P = 1 , 0 3 1 1 6 \ 1 2 7 P = 0 , 3 8 1
36 - 40 years IMC < 18,5 5 5 1 , 8 9 40,12 ±1,034 Not significant 25\30 Not significant
Group II: IMC > 18,5 3 0 5 1 0 , 5 2 52,68 ±1,547 P = 1 , 0 6 144\161 P = 0 , 2 3 6
51 - 55 years IMC < 18,5 3 9 0 , 3 1 53,07 ±1,359 Not significant 1 6 \ 2 3 Not significant
Group III: IMC > 18,5 3 6 1 1 2 , 4 5 62,69 ±1,243 P = 1 , 0 6 1 7 9 \ 1 8 2 P = 0 , 2 7 9
60 - 65 years IMC < 18,5 2 7 0 , 2 4 61,95 ±1,378 Not significant 1 5 \ 1 2 Not significant
Table 1
General study data subdivided into study groups
Total sample
Inclusion criteria
Exclusion criteria
Chi-square
test
P < 0 , 0 5 Student’s
T test
P < 0 , 0 5 O objetivo desta pesquisa é correlacionar o IMC, através
de sua condição de baixo peso, como possível fator de influência sobre a presbiopia. Estas observações são avaliadas através de testes estatísticos no decorrer deste trabalho.
M
ÉTODOSCross-sectional study on 2897 subjects using data from electronic medical records. Subjects were seen between January 2008 and January 2010 in a large private ophthalmic centre in Rio de Janeiro, Brazil (Eye Clinic Octavio Moura Brasil).
We assessed the results of best corrected visual acuity testing using Snellen’s chart, as well as objective and subjective refraction. The sampling process followed the steps shown in Figure 1.
After subjects were contacted by telephone and accepted to take part in the study, we assessed whether they met the inclusion and exclusion criteria.
Inclusion criteria were: patients without refractive errors, with a 20/20 visual acuity in both eyes and age between 36 and 65 years. Exclusion criteria were: patients with strabismus, positive cover test, anisometropia, convergence insufficiency, or high accommodation/convergence relationship. Patients aged 41-50 and 56-59 years were also excluded. This was done to highlight the hypothesis tested in this study.
After assessing the inclusion and exclusion criteria, 1030 patients were effectively included in the study. The study was approved by the Research Ethics Committee and was designed in accordance with the Guidelines and Standards Regulating Research Involving Humans Beings (Resolution 196/1996 of the Brazilian National Health Council).
All participants provided their Free and Informed Consent. Patients were divided into three groups according to age: Group I (pre-presbyopia), 36-40 years; Group II (established presbyopia), 51-55 years; and Group III (advanced presbyopia), 60-65 years.
The degree of presbyopia in each patient was measured in dioptres (D) using positive spherical lenses until a visual acuity close to Jaeger 1 (J1) was obtained. The following values were used: no correction, +1.00D, +1.25 D, +1.50 D, +1.75 D, +2.00 D, +2.25 D, +2.50 D, +2.75 D, +3.00 D, and above +3.00 D.
After assessing the inclusion and exclusion criteria, we measured the weight and height of the 1030 patients who were effectively included in the study to determine their BMI.
BMI was divided into <18.5 and >18.5 and classified as underweight or not, respectively.
The mean and standard deviation for each age group were calculated and correlated with BMI.
Each age group was subdivided according to sex (male and female) and correlated with BMI.
For each age group the frequency of each level of optical correction was assessed and correlated with BMI.
BMI> 18,5 Percent (%) BMI < 18.5 Percent (%) Statistical test
Mann WhitneyP<0,05
No correction 0 - 2 5,12
+ 1.00 d. esf. 0 - 2 5,12
+ 1.25 d. esf. 1 0,32 4 10,24
+ 1.50 d. esf. 9 2,95 7 17,92
+ 1.75 d. esf. 78 25,57 9 23,07
+ 2.00 d. esf. 81 26,55 8 20,51
+ 2.25 d. esf. 73 23,93 6 15,36
+ 2.50 d. esf. 26 8,85 1 2,56
+ 2.75 d. esf. 26 8,52 0
-+ 3.00 d. esf. 11 3,60 0
-> + 3.00 d. esf. 0 - 0
-Total 305 100 39 100
BMI > 18,5 Percent (%) BMI < 18,5 Percent (%) Statistical test
Mann WhitneyP<0,10
No correction 28 11,52 21 38,18
+ 1,00 d. esf. 116 47,73 22 40,0
+ 1,25 d. esf. 71 29,21 11 20
+ 1.50 d. esf. 25 10,28 1 1,81
+ 1.75 d. esf. 3 1,23 0
-+ 2.00 d. esf. 1 0,04 0
-+ 2.25 d. esf. 0 - 0
-+ 2.50 d. esf. 0 - 0
-+ 2.75 d. esf. 0 - 0
-+ 3.00 d. esf. 0 - 0
-> + 3.00 d. esf. 0 - 0
-Total 243 100 55 100
P = 0,074
Significant
ATTENTION: Not significant for a level of
significance of 5 %
Table 2
Group I: Group I: Pre-presbyopia; distribution of refraction data for near vision (J1) among patients aged 36-40 years.
Table 4
Group III: Advanced presbyopia; distribution of refraction data for near vision (J1) among patients aged 60-65 years.
BMI > 18,5 Percent (%) BMI < 18,5 Percent (%) Statistical test
Mann WhitneyP<0,05
No correction 0 - 0
-+ 1.00 d. esf. 0 - 0
-+ 1.25 d. esf. 0 - 1 3,70
+ 1.50 d. esf. 0 - 1 3,70
+ 1.75 d. esf. 0 - 3 11,21
+ 2.00 d. esf. 0 - 5
+ 2.25 d. esf. 6 4 14,91
+ 2.50 d. esf. 56 5
+ 2.75 d. esf. 122 4 14,91
+ 3.00 d. esf. 136 4 14,91
> + 3.00 d. esf. 42 0
-Total 362 27
P=0,027
Significant P=0,049
Significant
Table 3
Figure 1. Distribution of sampling data for patients in Group I: pre-presbyopia.
Homogeneity of partially-preserved data with lose and extreme data points for both groups. Note the difference in size of the graphic image between the two samples.
Data representation:
X-axis: BMI of the two study groups.
Y-axis: Scale of values based on spherical dioptre and number of cases.
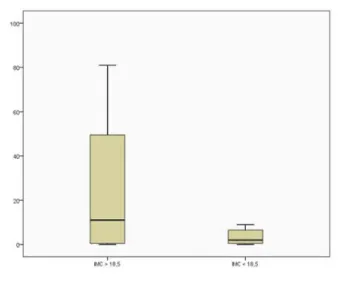
Figure 2. Distribution of sampling data for patients in Group II: established presbyopia.
Homogeneity of partially-preserved data without lose and extreme data points for both groups. Statistical boxes with well-formed quartiles and medians. Note the difference in size of the graphic image between the two samples.
Data representation:
X-axis: BMI of the two study groups.
Y-axis: Scale of values based on spherical dioptre and number of cases.
Figure 3. Distribution of sampling data for patients in Group III: advanced presbyopia.
Homogeneity of preserved data. Statistical boxes with well-formed quartiles and medians. Note the difference in size of the graphic image between the two samples.
Data representation:
X-axis: BMI of the two study groups.
Y-axis: Scale of values based on spherical dioptre and number of cases.
R
ESULTADOS General study data are shown in Table 1.Commentary (Table 1): Although the samples with BMI <18.5 were on average 4-5 times smaller than those with BMI >18.5, statistical tests showed no statistically significant differences between the two groups with regard to sex and age. This is important because it allowed us to compare the criteria for the onset and presence of presbyopia in populations with identical epidemiological characteristics, therefore they could be compared only with regard to BMI.
There is a correlation between presbyopia and high body weight (BMI>18.5) among subjects aged 36-40 years, achieving statistical significance for a level of significance of 10% but not for 5%, (Table 2). A graphic demonstration is shown in Figure 1. The statistical test showed a significant correlation (p=0.049) between low body weight (BMI<18.5) and a lower prevalence of presbyopia in subjects aged 51-55 years (Table 3). A graphic demonstration is shown in Figure 2.
The statistical test showed a significant correlation (p=0.027) between low body weight (BMI<18.5) and presbyopia in subjects aged 60-65 years (Table 3).
A graphic demonstration is shown in Figure 3.
D
ISCUSSÃOApproximately 2 billion people worldwide suffer from some kind of impairment due to presbyopia(9). The condition is
the literature, the condition is related to epidemiological data such as age, sex, and social condition. This is because complaints of difficulties reading due to presbyopia depend on a person’s educational or working needs as well as access to ophthalmic care(5,10,11).
The social condition of subjects included in this study was comparable, as the study was conducted in a private eye clinic with patients typically covered by private health insurance.
The inclusion and exclusion criteria adopted for this study also helped standardise the sample.(12)
In addition to age and sex, the literature reports other factors related to presbyopia(13). For example, the condition has
been related to cardiovascular factors, but without statistical evidence.
Therefore, two factors remain important in this study as regards presbyopia: age and sex. According to the literature, the prevalence of presbyopia tends to be higher among females. In our study there was no statistical correlation between the degree of presbyopia and age or sex(12).
We used a long selection procedure to adjust study samples. This is recommended in the literature, even for studies on surgical treatments for accommodation impairments(14,15).
This was confirmed through the statistical analysis shown in Table I, where there were no significant differences between groups as regards epidemiological data. Few studies in the literature divided subjects into the groups used here (pre-presbyopia, established (pre-presbyopia, and advanced presbyopia) to assess morbidity(16-19). This was done to stress the hypothesis
of late onset of presbyopia when comparing patients according to BMI.
The body mass index was chosen as the variable to be studied based on observations in daily ophthalmic practice. In the medical literature, BMI had only been related to eye conditions linked to nutritional factors such as age-related macular degeneration or those related to the aqueous humour and intraocular pressure (IOP), but no statistical correlation was found(8,20). Therefore, assessing the relationship between
BMI and presbyopia is unprecedented in the literature. The results presented in Tables 3 and 4 show that subjects with a low BMI are less prone to presbyopia. There are no reports in the literature on this hypothesis.
Likewise, no factors are known that might explain this finding. Theories about the influence of lens elasticity and space have been suggested by authors such as Schachar and called the “scleral approach”(21,22). This is because they are the only ones in
which a natural condition (of the anterior segment/lens/ciliary muscle) can be modified by external factors while partially preserving the anatomy. Thus, low body weight could influence such structures. However, Glasser challenges such association, championing structural anatomic changes to restore accommodation, thus curing presbyopia by removing the lens and using intraocular implants(23-25).
Even the hypothesis of slower aging or preservation of tissue elasticity is not entirely accepted, therefore it is difficult to associate it with low body weight and presbyopia(26).
This study demonstrates that there is a statistical correlation between low body weight and a later onset of presbyopia; however, further studies are needed to better define its pathophysiology.
This is an important study because of its original study topic in the medical literature, and further studies are needed that examine the pathophysiology of presbyopia. One of the limitations of this study is related to the choice of age groups to
be compared — pre-presbyopia (36-40 years), established presbyopia (51-55 years), and advanced presbyopia (61-65 years) — leaving gaps between groups. These epidemiological groups were chosen in order to facilitate statistical demonstration.
Another limitation is linked to the concept of BMI and low body weight. Among urban adult populations in developed, industrialised countries, approximately 15% of healthy subjects have low body weight, and this number tends to decrease with increasing age(27,28). Thus, this study’s hypothesis would be difficult
to prove without the methodological and statistical resources employed here.
It should be noted that diseases leading to weight loss should not be considered as they are beyond the scope of this study. In our sample, the few patients with morbid obesity who underwent bariatric surgery did not recover their accommodation capacity despite significant weight loss. These few cases were excluded from the study.
In conclusion, as shown by our statistical analysis, there is a significant correlation between low body weight, defined as a body mass index below 18.5, and a lower incidence of presbyopia or its delayed onset and progression with age.
According to the literature, the pathophysiology of presbyopia is not yet fully understood and optimal treatment options are unclear, even considering surgical alternatives(25,29-31).
Thus, the results shown here provide new insights into an eye disorder as common as presbyopia (32,33).
R
EFERENCES1. Weale RA. Epidemiology of refractive errors and presbyopia. Surv Ophthalmol. 2003;48(5): 515-43.
2. Rosenfield M, Ciuffreda KJ, Hung GK, Gilmartin B. Tonic accom-modation: a review. I. Basic aspects. Ophthalmic Physiol Opt. 1993;13(3):266-84.
3. Ziebarth NM, Borja D, Arrieta E, Aly M, Manns F, Dortonne I, et al. Role of the lens capsule on the mechanical accommodative response in a lens stretcher. Invest Ophthalmol Vis Sci. 2008;49(10):4490-6.
4. Lockhart TE, Shi W. Effects of age on dynamic accommodation. Ergonomics. 2010;53(7):892-903.
5. Duarte WR, Barros AJ, Dias-da-Costa JS, Cattan JM. Prevalência de deficiência visual de perto e fatores associados: um estudo de base populacional. Cad Saúde Pública. 2003;19(2):551-9. 6. Pointer JS. The presbyopic add. II. Age-related trend and a
gen-der difference. Ophthalmic Physiol Opt. 1995;15(4):241-8. 7. Torriceli AA, Junior JB, Santhiago MR, Bechara SJ. Surgical
man-agement of presbyopia. Clin Ophthalmol. 2012:6:1459-66. 8. Kuang TM, Tsai SY, Hsu WM, Cheng CY, Liu JH, Chou P. Body
mass index and age-related cataract: the Shihpai Eye Study. Arch Ophthalmol. 2005;123(8):1109-14.
9. Holden BA, Fricke TR, Ho SM, Wong R, Schlenther G, Cronjé S, et al. Global vision impairment due to uncorrected presbyopia. Arch Ophthalmol. 2008;126(12):1731-9.
10. Hashemi H, Khabazkhoob M, Jafarzadehpur E, Mehravaran S, Emamian MH, Yekta A, et al. Population-based study of presbyo-pia in Shahroud, Iran. Clin Exp Ophthalmol. 2012;40(9):863-8. 11. Patel I, West SK. Presbyopia: prevalence, impact, and
interven-tions. Community Eye Health. 2007;20(63):40-1.
12. Hickenbotham A, Roorda A, Steinmaus C, Glasser A. Meta-analysis of sex differences in presbyopia. Invest Ophthalmol Vis Sci. 2012;53(6):3215-20.
14. Findl O, Leydolt C. Meta-analysis of accommodating intraocular lenses. J Cataract Refract Surg. 2007;33(3):522-7.
15. Schor CM, Kotulak JC, Tsuetaki T. Adaptation of tonic accommo-dation reduces accommodative lag and is masked in darkness. Invest Ophthalmol Vis Sci. 1986;27(5):820-7.
16. Ramsdale C, Charman WN. A longitudinal study of the changes in the static accommodation response. Ophthalmic Physiol Opt. 1989;9(3):255-63.
17. Temme LA, Morris A. Speed of accommodation and age. Optom Vis Sci. 1989;66(2):106-12.
18. Tucker J, Charman WN. The depth-of-focus of the human eye for Snellen letters. Am J Optom Physiol Opt. 1975;52(1):3-21. 19. Karadag R, Arslanyilmaz Z, Aydin B, Hepsen IF. Effects of body
mass index on intraocular pressure and ocular pulse amplitude. Int J Ophthalmol. 2012;5(5):605-8.
20. Cheung N, Wong TY. Obesity and eye diseases. Surv Ophthalmol. 2007;52(2):180-95. Review.
21. Schachar RA. Cause and treatment of presbyopia with a method for increasing the amplitude of accommodation. Ann Ophthalmol. 1992;24(12):445-7, 452. Comment in Ophthalmology. 2002;109(9):1589-90.
22. Schachar RA. Pathophysiology of accommodation and presbyo-pia. Understanding the clinical implications. J Fla Med Assoc. 1994;81(4):268-71. Review.
23. Glasser A, Campbell MC. Biometric, optical and physical changes in the isolated human crystalline lens with age in relation to presbyopia. Vision Res. 1999;39(11):1991-2015.
24. Glasser A, Kaufman PL. The mechanism of accommodation in primates. Ophthalmology. 1999;106(5):863-72. Comment in Oph-thalmology. 2000;107(4):627-8. OphOph-thalmology. 2000;107(4):625-6. Ophthalmology. 2000;107(2):221-2. Ophthalmology. 2001;108(8):1369-71.
25. Glasser A. Restoration of accommodation: surgical options for correction of presbyopia. Clin Exp Optom. 2008;91(3):279-95.
26. Pau H, Kranz J. The increasing sclerosis of the human lens with age and its relevance to accommodation and presbyopia. Graefes Arch Clin Exp Ophthalmol. 1991;229(3):294-6.
27. Cole TJ, Flegal KM, Nicholls D, Jackson AA. Body mass index cut offs to define thinness in children and adolescents: international survey. BMJ. 2007;335(7612):194. Comment in BMJ. 2007;335(7612):166-7.
28. Seddon JM, Cote J, Davis N, Rosner B. Progression of age-related macular degeneration: association with body mass index, waist circumference, and waist-hip ratio. Arch Ophthalmol. 2003;121(6):785-92.
29. Shukla HC, Gupta PC, Mehta HC, Hebert JR. Descriptive epide-miology of body mass index of an urban adult population in west-ern India. J. Epidemiol Community Health. 2002;56(11):876-80. Comment in J Epidemiol Community Health. 2002;56(11):804-5.
30. Bruce AS, Atchinson DA, Bhoola H. Accommodation-convergence re-lationships and age. Invest Ophthalmol Vis Sci. 1995;36(2):406-13. 31. Mordi JA, Ciuffreda KJ. Dynamics aspects of accommodation: age
and presbyopia. Vision Res. 2004;44(6):591-601. Comment in Vision Res. 2004;44(19):2313; author reply 2315-6.
32. Charman WN, Heron G. Fluctuations in accommodation: a re-view. Ophthalmic Physiol Opt. 1988;8(2):153-64.
33. Hofstetter HW. A longitudinal study of amplitude changes in presbyopia. Am J Optom Arch Am Acad Optom. 1965;42:3-8.
Corresponding author:
Nadyr Antonia Damasceno email: [email protected] Winner of the 41st Varilux Prize.