Alpha-tocopherol concentration in serum and colostrum of mothers
with gestational diabetes mellitus
Concentração de α-tocoferol no soro e colostro de mães com diabetes melito gestacional
Concentración de α-tocoferol en el suero y calostro de madres con diabetes mellitus gestacional
Fernanda Barros S. Resende1, Heleni Aires Clemente1, Dalila Fernandes Bezerra1, Evellyn Câmara Grilo1, Larisse Rayanne M. de Melo1, Paula Emília N. R. Bellot1, Raquel Costa S. Dantas1, Roberto Dimenstein1
Instituição: Universidade Federal do Rio Grande do Norte (UFRN), Natal, RN, Brasil
1UFRN, Natal, RN, Brasil ABSTRACT
Objective: To evaluate and compare the levels of
α-tocopherol in colostrum and in the serum of healthy and diabetic mothers.
Methods: This cross-sectional study enrolled 51
volun-teer mothers, 20 with the diagnosis of gestational diabetes mellitus and 31 without associated diseases. Serum and co-lostrum samples were collected in fasting in the immediate postpartum period and α-tocopherol was analyzed by high performance liquid chromatography (HPLC). In order to define the nutritional status of vitamin E, the cutoff point for the serum (697.7µg/dL) was adopted. Student’s t-test for independent variables compared the average concentra-tions of α-tocopherol in the serum and in the colostrum between control and gestational diabetes mellitus groups. Pearson’s correlation was used to assess the relationship between the concentration of α-tocopherol in serum and colostrum for both groups. Differences were considered significant when p<0.05.
Results: The α-tocopherol concentration in
colos-trum was 1,483.1±533.8µg/dL for Control Group and 1,368.8±681.8µg/dL for diabetic women, without differ-ences between groups (p=0.50). However, α-tocopherol concentration in the serum was 1,059.5±372.7µg/dL in the Control Group and 1,391.4±531.5µg/dL in the diabetic one (p<0.01). No correlation was found between the
concentra-tion of α-tocopherol in the serum and in the colostrum for control and diabetic groups.
Conclusions: The groups had adequate nutritional status
of vitamin E. Gestational diabetes was not associated with changes in α-tocopherol concentration in colostrum.
Key-words: diabetes, gestational; colostrum; serum;
alpha-tocopherol.
RESUMO
Objetivo: Avaliar e comparar a concentração de α-tocoferol no leite colostro e no soro de mães diabéticas e saudáveis.
Métodos: Estudo transversal, realizado com 51
partu-rientes voluntárias, sendo 20 diagnosticadas com diabetes melito gestacional e 31 sem nenhuma doença associada. Coletaram-se as amostras de soro e de colostro em jejum no pós-parto imediato e o α-tocoferol foi analisado por cromato-grafia líquida de alta eficiência (CLAE). Para definir o estado nutricional de vitamina E, adotou-se ponto de corte sérico (697,7µg/dL). O teste t de Student para variáveis indepen-dentes comparou as concentrações médias de α-tocoferol no soro e no colostro entre os grupos controle e com diabetes melito gestacional. A correlação de Pearson testou a relação entre a concentração de α-tocoferol no soro e no colostro para ambos os grupos. As diferenças foram consideradas significantes quando p<0,05.
Endereço para correspondência: Roberto Dimenstein
Avenida Senador Salgado Filho, 3.000 – Lagoa Nova CEP 59072-970 – Natal/RN
E-mail: [email protected]
Conflito de interesse: nada a declarar
Resultados: As concentrações de α-tocoferol no colostro foram 1.483,1±533,8µg/dL para as mulheres do Grupo Controle e 1.368,8±681,8µg/dL para as di-abéticas, não havendo diferenças (p=0,50). Entretanto, no soro das puérperas controle, a concentração de
α-tocoferol foi 1.059,5±372,7µg/dL e, nas diabéticas, 1.391,4±531,5µg/dL, com p<0,01. Não houve correlação entre a concentração de α-tocoferol no soro e no colostro para o Grupo Controle. Resultado semelhante foi encon-trado para o grupo com diabetes melito gestacional.
Conclusões: Os grupos apresentaram estado nutricional
adequado quanto à vitamina E. Não houve associação entre diabetes melito gestacional e mudanças na concentração de
α-tocoferol no colostro.
Palavras-chave: diabetes gestacional; colostro; soro; alfa-tocoferol.
RESUMEN
Objetivo: Evaluar y comparar la concentración de α-tocoferol en la leche calostro y en el suero de madres diabéticas y sanas.
Métodos: Estudio transversal, realizado con 51
partu-rientes voluntarias, siendo 20 diagnosticadas con diabetes mellitus gestacional y 31 sin cualquier enfermedad asociada. Se recogieron las muestras de suero y de calostro en ayuno en el postparto inmediato y se analizó el α-tocoferol por cromatografía líquida de alta eficiencia (CLAE). Para definir el estado nutricional de vitamina E, se adoptó el punto de corte sérico (697,7µg/dL). El análisis estadístico se realizó con la prueba t de Student para variables independientes a fin de comparar las concentraciones medianas de α-tocoferol en el suero entre los grupos control y con diabetes mellitus gestacional. Ese análisis también fue realizado para comparar los promedios de α-tocoferol en el calostro en los grupos estudiados. Se utilizó la correlación de Pearson para evaluar la relación entre la concentración de α-tocoferol en el suero y en el calostro para ambos grupos. Las diferencias fueron consideradas significativas cuando p<0,05.
Resultados: Las concentraciones de α-tocoferol en el
calostro fueron 1.483,1±533,8µg/dL para las mujeres del Grupo Control y 1.368,8±681,8µg/dL para las diabéticas, no habiendo diferencias (p=0,50). Sin embargo, en el suero de las puérperas control, la concentración de α-tocoferol fue 1.059,5±72,7µg/dL y, en las diabéticas, 1.391,4±531,5µg/ dL, con p<0,01). No hubo correlación entre la concentración de α-tocoferol en el suero y en el calostro para el Grupo
Control. Resultado semejante fue encontrado para el grupo con diabetes mellitus gestacional.
Conclusiones: Los grupos presentaron estado nutricional
adecuado respecto a la vitamina E. No hubo asociación entre diabetes mellitus gestacional y concentración de α-tocoferol en el calostro.
Palabras clave: diabetes gestacional; calostro; suero;
α-tocoferol.
Introduction
During pregnancy, there is usually an accumulation of en-ergy reserves, characterized by common maternal physiological responses to pregnancy, such as increased visceral fat, insulin resistance, and increased circulating lipids(1). Insulin resistance
promotes the increase in glucose concentration, characterizing a scenario of gestational diabetes mellitus (GDM). Studies have shown the occurrence of increased production of oxygen free radicals, supporting the hypothesis that there is increased oxi-dative stress in patients with gestational diabetes(2). However,
there are still some knowledge gaps regarding oxidative stress during pregnancy and their relection on neonates.
GDM carries several mother-baby risk factors, among them, the increased incidence of teratogenicity, higher in fetuses of diabetic mothers when compared to healthy moth-ers, being this malformations also resulting from the cellular damage caused by the activity of free radicals(2).
The natural antioxidants reduce the adverse effects of free radicals because they have the ability to capture and neutralize reactive oxygen species (ROE), preventing lipid peroxidation. This neutralization is essential, especially in situations of increased oxidative stress, as in GDM(3). Among these
sub-stances, vitamin E stands out, essential micronutrient that corresponds to a group of eight fat soluble compounds clas-siied as α-, β-, γ-, and δ-tocopherol or tocotrienol, being
α-tocopherol the most active biologically(4).
It is known that the placental transfer of vitamin E during pregnancy is limited and reservations of this micronutrient formed in the newborn are low, making exclusive breastfeeding the only source of acquisition to meet their nutritional needs(4).
This offer is extremely important, since the exposure to hyper-oxia at birth increases the risk of formation of free radicals(5).
Given the importance of vitamin E to the mother-child binomial, this study aimed to verify the alpha-tocopherol concentration in serum and colostrum of mothers with ges-tational diabetes mellitus and in healthy mothers, as well as to compare the vitamin values between groups. The relevance of this work consist on verifying whether GDM can be a risk factor for vitamin E deiciency in parturient women and/or newborns, considering that breast milk is the only source of this vitamin to newborns in exclusive breastfeeding.
Method
The present study has a cross-sectional design, and was con-ducted with 51 volunteer mothers, 20 diabetic and 31 without associated diseases, all treated in a public maternity service in the municipality of Natal, state of Rio Grande do Norte. The samples were collected from October 2011 to August 2012.
For the sample size calculation, we used the G*Power
software, version 3.1.7(7). The calculation was performed
con-sidering the following parameters: α=5%, 80% test power, and expectation of the effect measure of 0.81. The total size indicated for the sample was of 50 cases.
Exclusion criteria for the group of healthy parturient women were: presence of diseases (diabetes, hypertension, neoplasia, gastrointestinal tract, and liver diseases, heart diseases, infectious syphilis, and HIV positive); use of vita-min supplements containing vitavita-min E during pregnancy; multiple fetuses or with malformations. Regarding mothers with gestational diabetes, the insulin-depended, those with multiple fetuses or fetuses with malformations, and those who used vitamin supplements during pregnancy were excluded. The diagnosis of GDM was made by the medical staff during the prenatal of the participants. For positive screening during prenatal care regardless of the gestational period, it was established that maternal fasting blood glucose should be ≥85mg/dL. For the diagnosis of GDM, we used the cutoffs of 110mg/dL for fasting glucose and of 140mg/dL for the value of the Oral Glucose Tolerance Test (OGTT), performed 2 hours after oral administration of 75g glucose. All procedures of the study were approved by the Re-search Ethics Committee of the University Hospital Onofre Lopes within Universidade Federal do Rio Grande do Norte (UFRN), under protocol n. 325/09. All participants were informed about the study and signed the informed consent. Data on maternal and obstetric characteristics were obtained from medical records of the women in labor, the pre-natal care card, and through interviews conducted by
the researchers. The pre-pregnancy anthropometric nutri-tional status was determined by the body mass index (BMI), calculated as the ratio between the normal body weight of the woman before pregnancy and her height squared. Wom-en with BMI <19.8kg/m2 were classiied as underweight; those
with a BMI between 19.8–26kg/m2 as eutrophic; women with
BMI between 26–29kg/m2 were classiied as overweight, and
women with BMI>29kg/m2 were classiied as obese(8).
The gestational weight gain of participants was calcu-lated as the difference between the pre-partum body weight and the pre-pregnancy weight and assessed in accordance with the recommendations by the Institute of Medicine(8).
Women with low pre-pregnancy weight should gain between 12.5–18kg until the end of pregnancy; those with adequate pre-gestational weight, between 11.5–16kg; those with overweight, between 7–11.5kg; and obese women should gain about 7kg until the end of pregnancy.
Data on the characteristics of newborns of participating mothers were obtained from medical records. Newborns were classiied according to gestational age in preterm (those born with less than 37 weeks) and term infants (those born between the 37th and the 42thweek)(9). The newborns were
also classiied according to birth weight in underweight (2,500g); adequate weight (weight between 2,500 and 4,000g); and macrosomic (weight above 4,000g)(10).
On the irst day postpartum, 2mL of colostrum and 5mL of blood were collected from each parturient involved in the study. These biological samples were collected in the morning after fasting for about 8 to 12 hours. Colostrum was obtained by manual expression from a single breast to prevent luctuation in fat, and blood was obtained by ve-nipuncture. The samples were collected in polypropylene tubes, protected from light and transported in coolers to the Laboratory of Food and Nutrition Biochemistry at the Biochemistry Department of UFRN. The colostrum samples were subjected to water-bath at 37°C for 5 minutes and stirred for homogenization of the sample. Then, an aliquot of 500µL was placed in a light-protected polypropylene tube and stored at -18°C until analysis. Blood was centrifuged to remove the serum, and 1mL was separated ad stored with the same procedure performed with the colostrum.
The alpha-tocopherol concentrations in the samples of serum and colostrum were determined by high performance liquid chromatography (HPLC). Biochemical analysis of α-tocopherol in biological samples occurred according to the adaptation of the extraction method used by Ortega et al(11), as described below.
used; and then, there were two extractions with 2mL of hexane (Merck®, USA), and evaporation of 2mL of hexane extract in a
water bath at 37ºC. For 500μL of colostrum, 500μL of ethanol 95% (Merck®, USA) were added; then, two extractions with
2mL of hexane (Merck®, USA), and evaporation in the same
conditions as the serum. After these proceedings, the samples were redissolved in 500μL of absolute ethanol (Vetec®, Brazil)
and 20µL were applied to the HPLC apparatus (model LC-10 AD, Shimadzu Corporation®, Japan) coupled to a UV-VIS
detector (SPD-10 A, Shimadzu Corporation®, Japan) and to
a Chromatopac C-R6A integrator (Shimadzu Corporation®,
Japan). A reverse phase column was used (CLC-ODS (M), Shim-pack, Japan) 4.6mm d.i.x25cm in length. The mobile phase used in these analyses was of methanol 100% (J. T. Baker, Mexico) at a low rate of 1.0mL/minute.
The α-tocopherol was identified in the samples by comparing the retention time of the peaks obtained in the chromatograms and that obtained by applying the standard
α-tocopherol Sigma®. In order to quantify α-tocopherol in
biological samples, we used a standard curve for external standardization. The concentration of the standard was conirmed by speciic extinction coeficient in absolute etha-nol(12), ε 1%, 1cm=75.8 to 292nm (Sigma®, USA).
Concentrations of maternal α-tocopherol serum levels above 697.7µg/dL are considered acceptable, according to the values established by Sauberlich(13).
To determine the precision and accuracy, there were tests of recovery and repeatability expressed by relative standard deviation (RSD), with three concentrations, (50, 100, and 200ng/mL), contemplating the range of variation within the linearity curve. We also determined the detection limit (DL) and the quantitation limit (QL).
The α-tocopherol was found in colostrum and serum. The average rate of recovery of α-tocopherol in the serum was of 100% and, for colostrum, of 98.8%. The measurements were characterized by satisfactory repeatability, with RSD of serum and colostrum from 7.7 and 4.2%, respectively.
To determine the DL and the QL, we diluted the samples of serum and colostrum, whose concentrations were known. For each dilution, the samples were applied and the peak was observed, so that the DL was determined when there was no more distinction between the noise and the analytical sig-nal, which was reached in the concentration of 3.18ng/mL. The QL was determined when the analytical signal was de-tected in the lower dilution, equivalent to 6.36ng/mL, ac-cording to the visual method(14). The calibration curve was
performed with standard solutions of α-tocopherol (Sigma®).
The calibration curve for α-tocopherol was linear (r2=0.9998)
and obtained within 1.2–41.3µg/mL.
We analyzed the data by Statistic Release 7®, and they
are presented as mean and standard deviation. We used the Kolmogorov-Smirnov test to check the normality of the metric variables of interest. After veriication of normality, we used the Student t test for independent variables, in order to determine whether there is signiicant difference between the means of α-tocopherol in the studied groups. We used the Pearson correlation to assess the relationship between the concentration of α-tocopherol in serum and colostrum, establishing signiicance at p<0.05. This correla-tion was performed for each studied group.
Control Group
Diabetic Group
n % n %
Maternal age
Adolescents 6 19 0 0
Adults 25 81 20 100
Pre-gestational* nutritional status
Low weight 7 30 1 6
Eutrophy 11 42 4 22
Overweight 4 14 5 28
Obesity 4 14 8 44
Gestational weight gain**
Insuficient 10 38 3 17
Adequate 9 35 4 22
Excessive 7 27 11 61
Type of Delivery
Cesarean 14 45 18 90
Vaginal 17 55 2 10
Parity
Primiparous 15 52 5 28
Multiparous 14 48 13 72
Gestational age***
Term 25 96 10 71
Pre-term 1 4 4 29
Birth weight****
Low weight 3 10 3 17
Adequate 26 87 9 50
Macrosomic 1 3 6 33
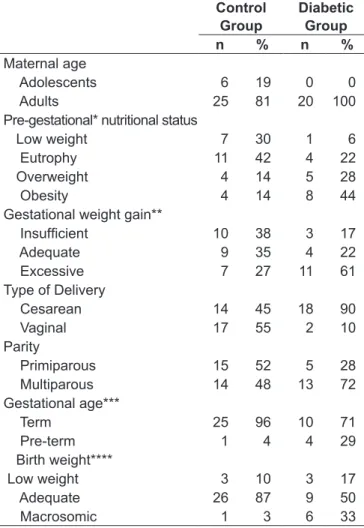
*Pre-pregnancy nutritional status classiied according to the level of pre-gestational body mass index(8); **gestational weight classiied ac
-cording to pre-gestational nutritional status(8); ***pre-term: gestational
age <37 weeks and term: 37≤ gestational age <42 weeks(9); ****low
weight: birth weight <2,500g, adequate weight: 2,500g≤ birth weight
≤4,000g e macrosomy: birth weight >4,000 g(10)
Results
Parturients who participated in this study were distrib-uted for the analysis of results in two groups: Control (n=31) and gestational diabetes mellitus group (n=20).
Women included in the control group were mostly adult (81%), were submitted to vaginal delivery (55%), and had term (96%) and normal weight children (87%). As to pre-pregnancy weight, 42% were classiied as eutrophic. The mean gestational age (GA) of newborns of parturient women in this group was of 39±1.2 weeks, and only one newborn was classiied as pre-term, with a GA of 36 weeks. As for pregnant women included in the diabetic group, all were adults and most had cesareans, (90%) and term children (71%). Regarding the classiication of pre-pregnancy weight, 44% were obese. As for the weight of newborns in this group, 33.3% were born underweight, 33.3% had adequate weight, and 33.3% were macrosomic. The mean GA of infants from mothers included in this group was of 37±2 weeks and four infants were classiied as preterm, being the mean gestational age of 35±1 weeks (Table 1).
In pregnant women in the control group, the mean
α-tocopherol concentration found in serum was of 1,059.5±372.7µg/dL (minimum: 482.3; maximum:
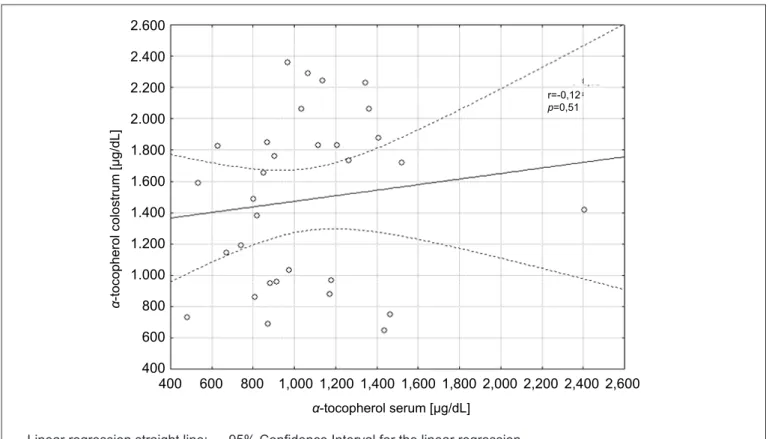
2,405.8). For the group of diabetic women, the mean was of 1,391.4±531.5µg/dL (minimum: 368.0; maxi-mum: 2,311.5), with a significant difference between the groups (p<0.01) (Figure 1). The α-tocopherol con-centration in colostrum was of 1,483.1±533.8µg/dL (minimum: 645.5; maximum: 2,360.1) for participants in Control Group and of 1,368.8±681.8µg/dL (mini-mum: 505.6; maxi(mini-mum: 2,750.6) for diabetic women, with no difference between groups (Figure 2). No cor-relation was found between serum and colostrum for both the control group (p>0.05; r=0.12) and the GDM group (p>0.05; r=-0.11). The correlation for both groups is expressed in Figures 3 and 4.
Discussion
The maternal nutritional state pre- and during pregnancy is one of the most important variable factors for the mother-child health. The inadequacy of the maternal nutritional state inluences the outcome of pregnancy and the conditions of growth presented by the newborn, as the gestational pe-riod is a phase in which the nutritional needs are high, due to physiological adjustments of the pregnant woman and the nutritional demands for fetal growth(15).
2,250
* 2,000
1,750
1,500
1,250
α
-tocopherol [
µg/dL]
1,000
750
500
250
0
Control Group (n=31)
Gestacional Diabetes Mellitus Group (GDM) (n=20)
*Student t test: p<0.05
Figure 1 - α-tocopherol concentration in serum of lactating women in the Control Group and in the Gestational Diabetes Mellitus Group
2,250
2,000
1,750
1,500
1,250
α
-tocopherol [
µg/dL]
1,000
750
500
250
0
Control Group (n=31)
Gestacional Diabetes Mellitus Group (GDM) (n=20)
Figure 3 - Correlation between α-tocopherol concentration in the serum and colostrum of lactating women in Control Group
2.600
2.200 2.400
2.000
1.800
1.600
1.400
r=-0,12
p=0,51
1.200
1.000
800
600
400
2,600
400 600 800 1,000 1,200 1,400 1,600 1,800 2,000 2,200 2,400
α
-tocopherol colostrum [
µg/dL]
α-tocopherol serum [µg/dL]
— Linear regression straight line; --- 95% Conidence Interval for the linear regression
3,000
2,800
2,600
2,200 2,400
2,000
1,800
1,600
1,400
r=-0,11
p=0,66
1,200
1,000
800
600
400
200 400 600 800 1,000 1,200 1,400 1,600 1,800 2,000 2,200 2,400
α
-tocopherol colostrum [
µg/dL]
α-tocopherol serum [µg/dL]
Figure 4 - Correlation between the concentration of α-tocopherol in serum and colostrum of lactating women from the Group of Gestational Diabetes Mellitus
From the means of α-tocopherol serum concentrations observed in both groups, the nutritional biochemical state of the serum is acceptable(13), and there was no deiciency
related to diabetes. Regarding the colostrum, it was veri-ied that both groups meet the nutritional requirement of the newborn, considering that the estimated volume of colostrum ingestion is of 500mL/day(16), and the result was
compared directly to the 2000 reference value of the Institute of Medicine(17) for the ingestion of the nutrient (4mg/day).
From the results, it was observed that the serum of women with GDM showed higher α-tocopherol concentrations when compared to healthy mothers. However, Grissa et al(18)
and Peuchant et al(19), in a study conducted with pregnant
women, reported a decrease in vitamin E concentrations when compared to those of healthy mothers. Suhail et al(20)
also found decreased serum concentrations compared to the control group. However, these authors carried out the col-lection at delivery, unlike this study, in which samples were collected from samples in the irst day postpartum.
In studies conducted by Lammi-Keefe et al(21) and Dey
et al(22), there was no signiicant difference between the amount
of tocopherol in the serum of the diabetic group and the healthy group. The study by Lammi-Keefe et al(21) was the irst
conducted with insulin-dependent diabetes mellitus lactat-ing women and their respective control group, composed of healthy lactating women. The second study was conducted in India and analyzed tocopherol in pregnant women diagnosed with gestational diabetes. However, another study conducted in India by Santra et al(23) found a higher amount of vitamin E
in the serum of women with GDM compared to the control group, conirming the results obtained in this research. The amount of vitamin E has undergone gradual increase even after 4 weeks, though new serum collection.
Increased α-tocopherol serum concentration may be related to metabolic changes that occur in the maternal body due to GDM. At the end of pregnancy, there should be a reduction in insulin secretion, leading to a hormonal response that make tissues dependent on insulin to metabo-lize lipids instead of carbohydrates, initiating a process of lipolysis(24-26), which culminates in increased release of free
fatty acids in the circulation(27). Once the primary means
of storage of α-tocopherol in the body is the adipose tis-sue(28), this vitamin can be inluenced by increased lipolysis,
leading diabetic women to present high concentration of serum tocopherol.
There is evidence that increased oxidative stress may enhance antioxidant enzyme activity in animals, as an
adaptive body condition. De Angelis etal found that dia-betic rats had an increase of 92% in catalase activity and of 27% in glutathione S-transferase in muscles, compared to the control group. As vitamin E acts as an antioxidant, it is oxidized and transformed into a free radical (tocopherol), thereby, requiring, a regeneration system which allows the recovery of its antioxidant function. Thus, other antioxidants act removing the free radical from the tocopherol molecule, such as ascorbic acid, reduced-glutathione and Coenzyme Q10(29,30). Giannubilo et al(31) found a signiicantly higher
plasma concentration of coenzyme Q10 in late pregnancy (36–40 weeks) in patients with GDM, when compared to the control group. To explain this difference, the authors suggest that there is a compensatory mechanism in response to oxidative stress associated with hyperglycemia and insulin resistance in patients with GDM.
Considering the studies analyzed and the results obtained, despite the few published articles, we could hypothesize that the increase in α-tocopherol in the blood of mothers with GDM is related to the attempt to respond to the dis-ease and minimize damages, in the form of compensatory mechanisms observed both in increased lipolysis in the face of low energy availability and in the increase of antioxidant activity against oxidative stress.
As for the concentration of α-tocopherol in colostrum of diabetic mothers, there are few studies on the subject. Despite the scarcity of studies, Lammi-Keefe et al(21) analyzed
the amount of vitamin E in the milk of diabetic moth-ers in the seventh, 14th, 42th, and 84th days of lactation. In their results, it is observed that the amount of tocopherol in colostrum, which corresponds to sampling in the seventh day, was higher compared to the group of healthy mothers, being a signiicant difference. In the same group, the vitamin concentration was below the reference value adopted by the authors. This same study also found that the α-tocopherol concentrations for diabetic mothers are different from those found in the control group, both in colostrum and in serum; however, in both groups, there was no signiicant correlation between them, similarly to previous studies, such as those from Azeredo and Trugo(32), Dimenstein et al(33), and Lira
et al(34). This reinforces the hypothesis that there is a different
mechanism of tocopherol transfer to the mammary gland in order to meet the needs of the newborn, with no dependence on maternal serum status of this nutrient(32).
formation of the child’s reserves, ensuring protection of the organism against oxygen toxicity and stimulating the develop-ment and maintenance of the immune system(4). In addition
to its action as an antioxidant, which is extremely important to the newborn, vitamin E also acts has a modulating func-tion on the post-translafunc-tion and transcripfunc-tion of genes, anti-inlammatory action, and in membrane stability(5,35,36).
Both healthy pregnant women and those with GDM presented adequate nutritional status regarding vitamin E. Nevertheless, the concentration of serum α-tocopherol was signiicantly higher in the diabetic group, being a protec-tive factor against oxidaprotec-tive stress for these women. It is suggested that this increase results from metabolic changes associated with GDM, such as lipolysis.
Regarding study limitations, it is worth mentioning that the test power expresses the probability of detecting a true effect(37). The probability of a researcher committing a type
II error, in which he does not discard the null hypothesis when it is false to the population, is designed by beta error (β)(38). For sample calculation of this study, we used an 80%
test power and beta error value of 20%. Furthermore, we included some mothers of premature newborns. However, some studies show that gestational age has no inluence on the levels of α-tocopherol in colostrum(39-41). Finally, we also
mention the fact that no dietary assessment of pregnant women included in the study was performed and the fact that milk collection was performed only in one period of lactation. Nonetheless, works like this, that verify the as-sociation between diseases and the concentration of vitamins in serum and breast milk are relevant to deine risk groups for vitamin deiciency.
GDM was not associated with the serum concentration of
α-tocopherol in colostrum and there seems to be a risk factor for vitamin E deiciency in newborns whose mothers have this disease. Vitamin concentrations in both groups supply the dai-ly requirement for vitamin E in infants. In addition, mothers with GDM had higher serum concentrations of α-tocopherol, which may be a relection of physiological and biochemical changes that characterize the disease. Further studies should be conducted to verify the inluence of other common diseases in pregnancy on the concentration of α-tocopherol and other vitamins in serum and maternal milk.
Acknowledgements
The authors are thankful to Januário Cicco Maternity School, for the permission to conduct this study, as well as to the mothers who accepted to participate.
References
1. Einstein FH, Fishman S, Muzumdar RH, Yang XM, Atzmon G, Barzilai N. Accretion of visceral fat and hepatic insulin resistance in pregnant rats. Am J Physiol Endocrinol Metab 2007;294:E451-5.
2. Surapaneni KM. Oxidant–antioxidant status in gestational diabetes patients. J Clin Diagn Res 2007;1:235-8.
3. Bettencourt JM. Type 2 diabetes mellitus and antioxidant vitamins (vitamin E, vitamin C and β-carotene) [monograph on the Internet]. Porto: Universidade do Porto; 2010 [cited 2013 Oct 1]. Available from: http://repositorio-aberto. up.pt/bitstream/10216/54615/3/138435_1031TCD31.pdf
3. Debier C, Larondelle Y. Vitamins A and E: metabolism, roles and transfer to offspring. Br J Nutr 2005;93:153-74.
5. Traber MG. Vitamin E. In: Bowman BA, Russel RM, editors. Present knowledge in nutrition. 9th ed. Washington DC: ILSI Press; 2006. p. 211-9.
6. Vignini A, Alidori A, Montesi L, Raffaelli F, Nanetti L, Bertoli E et al. Vitamin E, diabetes and related diseases: an update. Mediterr J Nutr Metab 2010;4:3-9. 7. Faul F, Erdfelder E, Lang A-G, Buchner A. G*Power 3: a lexible statistical power
analysis program for the social, behavioral, and biomedical sciences. Behav Res Methods 2007;39:175-91.
8. Subcommittee for a Clinical Application Guide, Committee on Nutritional Status During Pregnancy and Lactation, Food and Nutrition Board, Institute of Medicine, National Academy of Sciences. Nutrition during pregnancy and lactation: an implementation guide. Washington (DC): National Academy Press; 1992. 9. World Health Organization. Neonatal and perinatal mortality: country, regional
and global estimates. Geneva: WHO; 2006.
10. Strutz KL, Richardson LJ, Hussey JM. Preconception health trajectories and birth weight in a national prospective cohort. J Adolesc Health 2012;51:629-36.
11. Ortega RM, López-Sobaler AM, Martínez RM, Andrés P, Quintas ME. Inluence of smoking on vitamin E status during the third trimester of pregnancy and on breast-milk tocopherol concentrations in Spanish women. Am J Clin Nutr 1998;68:662-7.
12. Nierenberg DW, Nann SL. A method for determining concentrations of retinol, tocopherol, and ive carotenoids in human plasma and tissue samples. Am J Clin Nutr 1992;56:417-26.
13. Sauberlich HE. Laboratory tests for the assessment of nutritional status. 2nd ed. Boca Raton: CRC Press; 1999.
14. Ribani M, Botolli CB, Jardim IC, Melo LF. Validação de métodos cromatográicos e eletroforéticos. Quim Nova 2004;27:771-80.
15. Ramakrishnan U. Nutrition and low birth weight: from research to practice. Am J Clin Nutr 2004;79:17-21.
16. Ross JS, Harvey PW. Contribuition of breastfeeding to vitamin A nutrition of infants: a simulation model. Bull World Health Organ 2003;81:80-6. 17. Standing Committee on the Scientiic Evaluation of Dietary Reference Intakes,
Food and Nutrition Board, Institute of Medicine. DRI dietary reference intakes for vitamin C, vitamin E, selenium, and carotenoids. A Report of the Panel on Dietary Antioxidants and Related Compounds. Washington DC: National Academy Press; 2000.
18. Grissa O, Atègbo JM, Yessoufou A, Tabka Z, Miled A, Jerbi M et al. Antioxidant status and circulating lipids are altered in human gestational diabetes and macrosomia. Transl Res 2007;150:164-71.
20. Suhail M, Patil S, Khan S, Siddiqui S. Antioxidant vitamins and lipoperoxidation in non-pregnant, pregnant, and gestational diabetic women: erythrocytes osmotic fragility proiles. J Clin Med Res 2010;2:266-73.
21. Lammi-Keefe CJ, Jonas CR, Ferris AM, Capacchione CM. Vitamin E in plasma and milk of lactating women with insulin-dependent diabetes mellitus. J Pediatr Gastroenterol Nutr 1995;20:305-9.
22. Dey P, Gupta P, Acharya NK, Rao SN, Ray S, Chakrabarty S et al. Antioxidants and lipid peroxidation in gestational diabetes - a preliminary study. Indian J Physiol Pharmacol 2008;52:149-56.
23. Santra D, Sawhney H, Aggarwal N, Majumdar S, Vasishta K. Lipid peroxidation and vitamin E status in gestational diabetes mellitus. J Obstet Gynaecol 2003;29:300-4.
24. Andrade OV, Ihara FO, Troster EJ. Metabolic acidosis in childhood: why, when and how to treat. J Pediatr (Rio J) 2007;83 (Suppl 2):S11-21.
25. Barone B, Rodacki M, Cenci MC, Zajdenverg L, Milech A, Oliveira JE. Cetoacidose diabética em adultos — atualização de uma complicação antiga. Arq Bras Endocrinol Metab 2007;51:1434-47.
26. Rodacki M, Zajdenverg L, Lima GA, Nunes RC, Milech A, Oliveira JE. Relato de caso: diabetes latbush – da cetoacidose ao tratamento não-farmacológico. Arq Bras Endocrinol Metab 2007;51:131-5.
27. Fulop T, Tessier D, Carpentier A. The metabolic syndrome. Pathol Biol (Paris) 2006;54:375-86.
28. Herrera E, Barbas C. Vitamin E: action, metabolism and perspectives. J Physiol Biochem 2001;57:43-56.
29. De Angelis KL, Cestari IA, Barp J, Dall’ago P, Fernandes TG, de Bittencourt PI et al. Oxidative stress in the latissimus dorsi muscle of diabetic rats. Braz J Med Biol Res 2000;33:1363-8.
30. Catania AS, Barros CR, Ferreira SR. Vitamins and minerals with antioxidant properties and cardiometabolic risk: controversies and perspectives. Arq Bras Endocrinol Metab 2009;53:550-9.
31. Giannubilo SR, Tiano L, Cecchi S, Principi F, Tranquilli AL, Littarru GP. Plasma coenzyme Q10 is increased during gestational diabetes. Diabetes Res Clin Pract 2011;94:230-5.
32. De Azeredo VB, Trugo NM. Retinol, carotenoids, and tocopherols in the milk of lactating adolescents and relationships with plasma concentrations. Nutrition 2008;24:133-9. 33. Dimenstein R, Pires JF, Garcia LR, Lira LQ. Levels of alpha-tocopherol in
maternal serum and colostrum of adolescents and adults. Rev Bras Ginecol Obstetr 2010;32:267-72.
34. Lira LQ, Lima MS, de Medeiros JM, da Silva IF, Dimenstein R. Correlation of vitamin A nutritional status on alpha-tocopherol in the colostrum of lactating women. Matern Child Nutr 2013;9:31-40.
35. Zingg JM, Azzi A. Non-antioxidant activities of vitamin E. Curr Med Chem 2004;11:1113-33.
36. Rizzo MR, Abbatecola AM, Barbieri M, Vietri MT, Ciofi M, Grella R et al. Evidence for anti-inlammatory effects of combined administration of vitamin E and C in older persons with impaired fasting glucose: impact on insulin action. J Am Coll Nutr 2008;27:505-11.
37. Normando D, Almeida MA, Quintão CC. Análise do emprego do cálculo amostral e do erro do método em pesquisas cientíicas publicadas na literatura ortodôntica nacional e internacional. Dental Press J Orthod 2011;16:e1-9. 38. Carneiro AV. Cálculo da dimensão da amostra em estudos clínicos: princípios
metodológicos básicos. Rev Port Cardiol 2003;22:1513-21.
39. Grilo EC, Lira LQ, Dimenstein R, Ribeiro KD. Inluência da prematuridade e do peso ao nascer sobre a concentração de α-tocoferol no leite colostro. Rev Paul Pediatr 2013;31:473-9.
40. Haug M, Laubach C, Burke M, Harzer G. Vitamin E in human milk from mothers of preterm and term infants. J Pediatr Gastr Nutr 1987;6:605-9.
![Figure 1 - α-tocopherol concentration in serum of lactating women in the Control Group and in the Gestational Diabetes Mellitus Group 2,2502,0001,7501,5001,250α-tocopherol [µg/dL]1,0007505002500 Control Group (n=31)](https://thumb-eu.123doks.com/thumbv2/123dok_br/19058371.485472/5.892.459.831.658.1030/tocopherol-concentration-lactating-control-gestational-diabetes-mellitus-tocopherol.webp)