REVIEW ARTICLE
Psychometric properties of the Beck Depression
Inventory-II: a comprehensive review
Yuan-Pang Wang,
1Clarice Gorenstein
1,21Institute & Department of Psychiatry (LIM-23), School of Medicine, Universidade de Sa˜o Paulo (USP), Sa˜o Paulo, SP, Brazil.2Institute of
Biomedical Sciences, Department of Pharmacology, USP, Sa˜o Paulo, SP, Brazil.
Objective:To review the psychometric properties of the Beck Depression Inventory-II (BDI-II) as a self-report measure of depression in a variety of settings and populations.
Methods:Relevant studies of the BDI-II were retrieved through a search of electronic databases, a hand search, and contact with authors. Retained studies (k = 118) were allocated into three groups: non-clinical, psychiatric/institutionalized, and medical samples.
Results:The internal consistency was described as around 0.9 and the retest reliability ranged from 0.73 to 0.96. The correlation between BDI-II and the Beck Depression Inventory (BDI-I) was high and substantial overlap with measures of depression and anxiety was reported. The criterion-based validity showed good sensitivity and specificity for detecting depression in comparison to the adopted gold standard. However, the cutoff score to screen for depression varied according to the type of sample. Factor analysis showed a robust dimension of general depression composed by two constructs: cognitive-affective and somatic-vegetative.
Conclusions:The BDI-II is a relevant psychometric instrument, showing high reliability, capacity to discriminate between depressed and non-depressed subjects, and improved concurrent, content, and structural validity. Based on available psychometric evidence, the BDI-II can be viewed as a cost-effective questionnaire for measuring the severity of depression, with broad applicability for research and clinical practice worldwide.
Keywords: Psychometric scale; depression; reliability; validity; classical testing theory; item response theory
Introduction
Depression is projected to become a globally prevalent disorder1,2with a huge burden to the population.3Among the available self-assessment instruments, the 21-item Beck Depression Inventory (BDI) is one of the most popular measures of depressive symptoms worldwide.4 First proposed by Beck et al.,5this instrument has been used in more than 7,000 studies so far. The theoretical assumption of the original BDI relied upon the belief that negativistic distorted cognitions would be the core characteristic of depression.6
The BDI has undergone two major revisions: in 1978 as the BDI-IA7 and in 1996 as the Beck Depression Inventory-II (BDI-II).8The updated BDI-II taps psycholo-gical and somatic manifestations of 2-week major depressive episodes, as operationalized in the DSM-IV.9 This version was modified to reword and replace some items. Four items of the BDI-IA that proved less sensitive for identification of typical symptoms of severe depression –– weight loss, distorted body image, somatic
preoccupation, and inability to work –– were dropped and replaced by agitation, worthlessness, difficulty concen-trating, and energy loss to assess a distinctive degree of intensity of depression. In addition, the items on appetite and sleep change were amended to evaluate the increase and decrease of these depression-related behaviors. Unlike the original version, the BDI-II does not reflect any particular theory of depression.
Despite widespread use in both non-clinical and clinical studies for more than 15 years after its publication, to the best of our knowledge, no relevant summary of the performance of this version has been conducted. In addition, the last decade has seen major progress in psychometric theories that were not fully developed at the time the BDI was reformulated. Within this context, we carried out a search of articles dealing with the psychometric properties of the BDI-II. This review is not intended to be a systematic review or meta-analysis, but a synopsis of the subject matter addressing the feasibility of using BDI-II in different population samples. Whenever possible, psychometric advantages and criticisms are underscored, discussing recommendations for use in a variety of settings.
Methods
Both investigators, with previous experience in psycho-metric instruments, searched MEDLINE and PsycINFO
Correspondence: Yuan-Pang Wang, Nu´cleo de Epidemiologia Psiquia´trica (LIM-23), Departmento & Instituto de Psiquiatria, Faculdade de Medicina, Universidade de Sa˜o Paulo, Rua Dr. Ovı´dio Pires de Campos, 785, CEP 05403-010, Sa˜o Paulo, SP, Brazil. E-mail: [email protected]
Submitted Nov 09 2012, accepted Feb 13 2013.
databases. The following MeSH terms were used to filter relevant studies: psychometrics and depression. We restricted the search to articles containing the BDI and published between the time periods of January 1st, 1996 and October 10th, 2012. The following non-psychometric article types were left out: clinical trials, editorials, letters, meta-analyses, practice guidelines, randomized con-trolled trials, and case reports. There was no language or age range restriction.
All retained articles were read for exclusion of additional criteria: non-psychometric studies; other versions of the BDI; small samples (fewer than 30 participants10), unless the study addressed a very important problem, such as between-version comparison or content analysis. Secondary analyses of previously reported datasets were excluded. Summary analysis of the complete sample was preferable when multiple analyses were available (such as separate reports by gender, ethnicity, or depressed vs. non-depressed groups).
The reference sections of review articles11-13and book chapters4,14,15 that were not retrieved in the computer search were examined to identify potential studies for inclusion. Additional efforts to locate relevant studies included contacting authors in the field and a hand search of the reference lists of retained articles.
Results and discussion
Overview
The MeSH search strategy detailed above yielded 2,611 articles. Filtering these studies using BDI resulted in 253 articles, 198 of which matched the time period of interest. The exclusion of non-psychometric study types narrowed the sample to 178 articles. Among those retained from the electronic database plus hand search, 60 did not meet the inclusion criteria: 33 articles did not present relevant psychometric data; 18 used the BDI-I; five used the BDI-Fast Screen; and four presented a small sample. The final list resulted in 118 articles dedicated to investigate psychometric performance of the BDI-II.
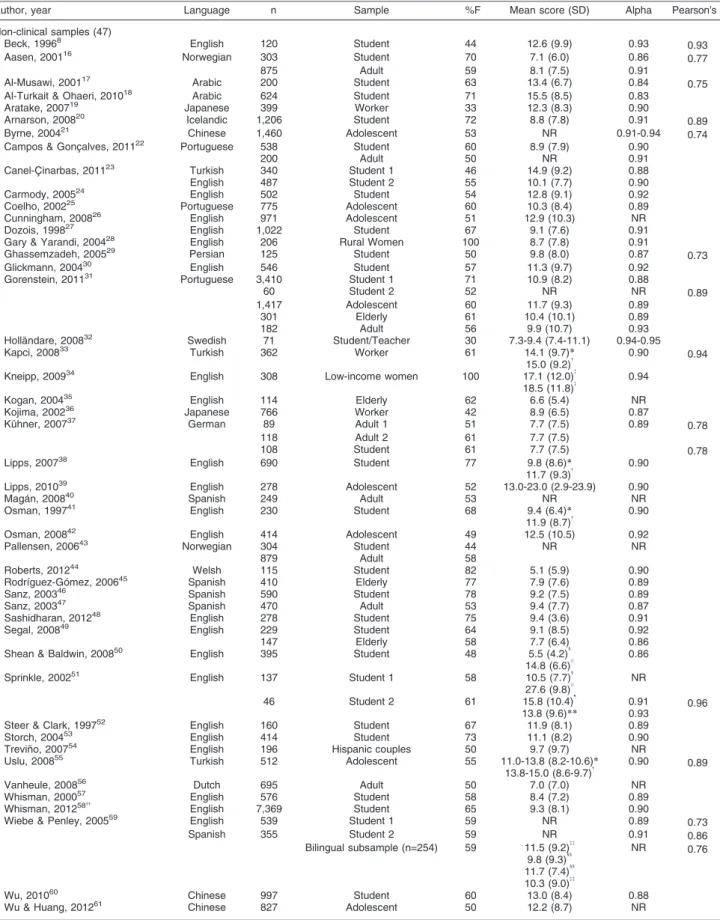
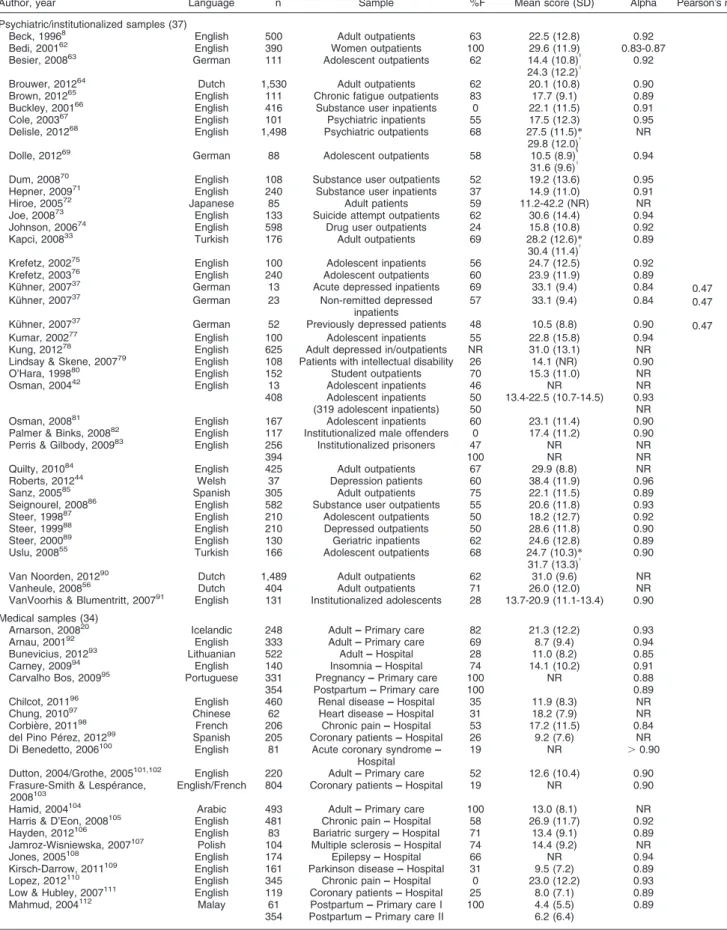
For the sake of comparison between similar investiga-tions, the studies were grouped by sample recruitment source as: non-clinical (k = 47); psychiatric/institutiona-lized (k = 37); or medical samples (k = 34). Typically, non-clinical studies were conducted in student analogue depression samples (average age, 18-23 years), which are referred to in this study as student studies to describe university-recruited samples (k = 29) and adolescent studies to describe school-based underage respondents (k = 8). Psychiatric samples were stratified as inpatient, outpatient, or institutionalized. Medical samples were grouped according to the disease and recruitment setting. The instrument was applied to over 60,000 respondents. The English version of the BDI-II has been translated into 17 languages, and is used in Europe, the Middle East, Asia, and Latin America (Table 1). Although the English version prevailed among the studies (65%), the increasing number of language versions suggests inter-national acceptance of the instrument.
Table 1 shows that the mean score ranged from 5.1 to 38.4. In general, psychiatric samples presented the highest mean scores, medical samples intermediate, and non-clinical samples the lowest means. Since sample standardization is not demographically representative of the population and little evidence has been provided regarding the gender and culture fairness of the items and total score, the original authors recommended development of local norms.
Reliability
Twenty-nine of the 118 retrieved articles (25%) did not report reliability coefficients, indicating that the assump-tion of test score reliability generally has not prevailed in clinical practice regarding application of the BDI. In comparison to the internal consistency of the previous versions of the BDI (average Cronbach’s alpha coefficient around 0.85),8 most studies on BDI-II reported an average alpha coefficient around 0.9, ranging from 0.83 to 0.96 (Table 1). Probably, the replacement of particular items has improved the homogeneity of the scale. Its ability to assess different types of depression, e.g., atypical depression, is superior to that of the BDI-IA, as symptoms of increased and decreased appetite and sleep were included in the BDI-II items. However, superior reliability does not necessarily indicate improve-ment of the clinical validity of the scale.
Retest reliability (Pearson’s r) showed relative stability through re-application of the BDI-II, with good to excellent coefficients (range, 0.73 to 0.96),17,29,33,59,127 with a mean re-application interval of 2 weeks (range, 1 week to 6 months) for the majority of studies (82%). However, two remarks should be taken into account when interpreting these coefficients: 1) as true changes in depressive symptoms can occur without any intervention, while a high correlation is more likely after a short time, a longer interval could explain a smaller correlation; 2) there is no available retest information for patient samples, whether psychiatric or medical. The observed retest coefficients were similar to the values found by the authors of the BDI-II with clinical and non-clinical populations,80.92 and 0.93 respectively for an average time interval of 7 days between application and the re-application of the scale. A reliability generalization analysis showed an average coefficient around 0.65 for the previous version of the BDI.128 Comparison of the retest coefficients of the BDI-I and BDI-II could only be considered definitive if the time intervals of the studies were similar.
Table 1 Studies using the BDI-II by language version, sample size, target sample, gender distribution, mean (SD) score, and reliability (alpha and Pearson’s r)
Author, year Language n Sample %F Mean score (SD) Alpha Pearson’s r
Non-clinical samples (47)
Beck, 19968 English 120 Student 44 12.6 (9.9) 0.93
0.93
Aasen, 200116 Norwegian 303 Student 70 7.1 (6.0) 0.86
0.77
875 Adult 59 8.1 (7.5) 0.91
Al-Musawi, 200117 Arabic 200 Student 63 13.4 (6.7) 0.84
0.75 Al-Turkait & Ohaeri, 201018 Arabic 624 Student 71 15.5 (8.5) 0.83
Aratake, 200719 Japanese 399 Worker 33 12.3 (8.3) 0.90
Arnarson, 200820 Icelandic 1,206 Student 72 8.8 (7.8) 0.91
0.89
Byrne, 200421 Chinese 1,460 Adolescent 53 NR 0.91-0.94
0.74 Campos & Gonc¸alves, 201122 Portuguese 538 Student 60 8.9 (7.9) 0.90
200 Adult 50 NR 0.91
Canel-C¸ inarbas, 201123 Turkish 340 Student 1 46 14.9 (9.2) 0.88
English 487 Student 2 55 10.1 (7.7) 0.90
Carmody, 200524 English 502 Student 54 12.8 (9.1) 0.92
Coelho, 200225 Portuguese 775 Adolescent 60 10.3 (8.4) 0.89
Cunningham, 200826 English 971 Adolescent 51 12.9 (10.3) NR
Dozois, 199827 English 1,022 Student 67 9.1 (7.6) 0.91
Gary & Yarandi, 200428 English 206 Rural Women 100 8.7 (7.8) 0.91
Ghassemzadeh, 200529 Persian 125 Student 50 9.8 (8.0) 0.87
0.73
Glickmann, 200430 English 546 Student 57 11.3 (9.7) 0.92
Gorenstein, 201131 Portuguese 3,410 Student 1 71 10.9 (8.2) 0.88
60 Student 2 52 NR NR 0.89
1,417 Adolescent 60 11.7 (9.3) 0.89
301 Elderly 61 10.4 (10.1) 0.89
182 Adult 56 9.9 (10.7) 0.93
Holla¨ndare, 200832 Swedish 71 Student/Teacher 30 7.3-9.4 (7.4-11.1) 0.94-0.95
Kapci, 200833 Turkish 362 Worker 61 14.1 (9.7)*
15.0 (9.2){
0.90 0.94
Kneipp, 200934 English 308 Low-income women 100 17.1 (12.0){
18.5 (11.8){
0.94
Kogan, 200435 English 114 Elderly 62 6.6 (5.4) NR
Kojima, 200236 Japanese 766 Worker 42 8.9 (6.5) 0.87
Ku¨hner, 200737 German 89 Adult 1 51 7.7 (7.5) 0.89
0.78
118 Adult 2 61 7.7 (7.5)
108 Student 61 7.7 (7.5) 0.78
Lipps, 200738 English 690 Student 77 9.8 (8.6)
*
11.7 (9.3){ 0.90
Lipps, 201039 English 278 Adolescent 52 13.0-23.0 (2.9-23.9) 0.90
Maga´n, 200840 Spanish 249 Adult 53 NR NR
Osman, 199741 English 230 Student 68 9.4 (6.4)
*
11.9 (8.7){ 0.90
Osman, 200842 English 414 Adolescent 49 12.5 (10.5) 0.92
Pallensen, 200643 Norwegian 304 Student 44 NR NR
879 Adult 58
Roberts, 201244 Welsh 115 Student 82 5.1 (5.9) 0.90
Rodrı´guez-Go´mez, 200645 Spanish 410 Elderly 77 7.9 (7.6) 0.89
Sanz, 200346 Spanish 590 Student 78 9.2 (7.5) 0.89
Sanz, 200347 Spanish 470 Adult 53 9.4 (7.7) 0.87
Sashidharan, 201248 English 278 Student 75 9.4 (3.6) 0.91
Segal, 200849 English 229 Student 64 9.1 (8.5) 0.92
147 Elderly 58 7.7 (6.4) 0.86
Shean & Baldwin, 200850 English 395 Student 48 5.5 (4.2)1
14.8 (6.6)I
0.86
Sprinkle, 200251 English 137 Student 1 58 10.5 (7.7)1
27.6 (9.8)I NR
46 Student 2 61 15.8 (10.4)"
13.8 (9.6)**
0.91
0.93 0.96
Steer & Clark, 199752 English 160 Student 67 11.9 (8.1) 0.89
Storch, 200453 English 414 Student 73 11.1 (8.2) 0.90
Trevin˜o, 200754 English 196 Hispanic couples 50 9.7 (9.7) NR
Uslu, 200855 Turkish 512 Adolescent 55 11.0-13.8 (8.2-10.6)
*
13.8-15.0 (8.6-9.7){ 0.90 0.89
Vanheule, 200856 Dutch 695 Adult 50 7.0 (7.0) NR
Whisman, 200057 English 576 Student 58 8.4 (7.2) 0.89
Whisman, 201258{{
English 7,369 Student 65 9.3 (8.1) 0.90
Wiebe & Penley, 200559 English 539 Student 1 59 NR 0.89
0.73
Spanish 355 Student 2 59 NR 0.91 0.86
Bilingual subsample (n=254) 59 11.5 (9.2){{ 9.8 (9.3)11 11.7 (7.4)11 10.3 (9.0){{
NR 0.76
Wu, 201060 Chinese 997 Student 60 13.0 (8.4) 0.88
Wu & Huang, 201261 Chinese 827 Adolescent 50 12.2 (8.7) NR
Table 1 Continued
Author, year Language n Sample %F Mean score (SD) Alpha Pearson’s r
Psychiatric/institutionalized samples (37)
Beck, 19968 English 500 Adult outpatients 63 22.5 (12.8) 0.92
Bedi, 200162 English 390 Women outpatients 100 29.6 (11.9) 0.83-0.87
Besier, 200863 German 111 Adolescent outpatients 62 14.4 (10.8)1
24.3 (12.2)I
0.92
Brouwer, 201264 Dutch 1,530 Adult outpatients 62 20.1 (10.8) 0.90
Brown, 201265 English 111 Chronic fatigue outpatients 83 17.7 (9.1) 0.89
Buckley, 200166 English 416 Substance user inpatients 0 22.1 (11.5) 0.91
Cole, 200367 English 101 Psychiatric inpatients 55 17.5 (12.3) 0.95
Delisle, 201268 English 1,498 Psychiatric outpatients 68 27.5 (11.5)*
29.8 (12.0){
NR
Dolle, 201269 German 88 Adolescent outpatients 58 10.5 (8.9)1
31.6 (9.6)I 0.94
Dum, 200870 English 108 Substance user outpatients 52 19.2 (13.6) 0.95
Hepner, 200971 English 240 Substance user inpatients 37 14.9 (11.0) 0.91
Hiroe, 200572 Japanese 85 Adult patients 59 11.2-42.2 (NR) NR
Joe, 200873 English 133 Suicide attempt outpatients 62 30.6 (14.4) 0.94
Johnson, 200674 English 598 Drug user outpatients 24 15.8 (10.8) 0.92
Kapci, 200833 Turkish 176 Adult outpatients 69 28.2 (12.6)
*
30.4 (11.4){ 0.89
Krefetz, 200275 English 100 Adolescent inpatients 56 24.7 (12.5) 0.92
Krefetz, 200376 English 240 Adolescent outpatients 60 23.9 (11.9) 0.89
Ku¨hner, 200737 German 13 Acute depressed inpatients 69 33.1 (9.4) 0.84
0.47 Ku¨hner, 200737 German 23 Non-remitted depressed
inpatients
57 33.1 (9.4) 0.84 0.47
Ku¨hner, 200737 German 52 Previously depressed patients 48 10.5 (8.8) 0.90
0.47
Kumar, 200277 English 100 Adolescent inpatients 55 22.8 (15.8) 0.94
Kung, 201278 English 625 Adult depressed in/outpatients NR 31.0 (13.1) NR
Lindsay & Skene, 200779 English 108 Patients with intellectual disability 26 14.1 (NR) 0.90
O’Hara, 199880 English 152 Student outpatients 70 15.3 (11.0) NR
Osman, 200442 English 13 Adolescent inpatients 46 NR NR
408 Adolescent inpatients 50 13.4-22.5 (10.7-14.5) 0.93
(319 adolescent inpatients) 50 NR
Osman, 200881 English 167 Adolescent inpatients 60 23.1 (11.4) 0.90
Palmer & Binks, 200882 English 117 Institutionalized male offenders 0 17.4 (11.2) 0.90
Perris & Gilbody, 200983 English 256 Institutionalized prisoners 47 NR NR
394 100 NR NR
Quilty, 201084 English 425 Adult outpatients 67 29.9 (8.8) NR
Roberts, 201244 Welsh 37 Depression patients 60 38.4 (11.9) 0.96
Sanz, 200585 Spanish 305 Adult outpatients 75 22.1 (11.5) 0.89
Seignourel, 200886 English 582 Substance user outpatients 55 20.6 (11.8) 0.93
Steer, 199887 English 210 Adolescent outpatients 50 18.2 (12.7) 0.92
Steer, 199988 English 210 Depressed outpatients 50 28.6 (11.8) 0.90
Steer, 200089 English 130 Geriatric inpatients 62 24.6 (12.8) 0.89
Uslu, 200855 Turkish 166 Adolescent outpatients 68 24.7 (10.3)*
31.7 (13.3){ 0.90
Van Noorden, 201290 Dutch 1,489 Adult outpatients 62 31.0 (9.6) NR
Vanheule, 200856 Dutch 404 Adult outpatients 71 26.0 (12.0) NR
VanVoorhis & Blumentritt, 200791 English 131 Institutionalized adolescents 28 13.7-20.9 (11.1-13.4) 0.90
Medical samples (34)
Arnarson, 200820 Icelandic 248 Adult –– Primary care 82 21.3 (12.2) 0.93
Arnau, 200192 English 333 Adult –– Primary care 69 8.7 (9.4) 0.94
Bunevicius, 201293 Lithuanian 522 Adult –– Hospital 28 11.0 (8.2) 0.85
Carney, 200994 English 140 Insomnia –– Hospital 74 14.1 (10.2) 0.91
Carvalho Bos, 200995 Portuguese 331 Pregnancy –– Primary care 100 NR 0.88
354 Postpartum –– Primary care 100 0.89
Chilcot, 201196 English 460 Renal disease –– Hospital 35 11.9 (8.3) NR
Chung, 201097 Chinese 62 Heart disease –– Hospital 31 18.2 (7.9) NR
Corbie`re, 201198 French 206 Chronic pain –– Hospital 53 17.2 (11.5) 0.84
del Pino Pe´rez, 201299 Spanish 205 Coronary patients –– Hospital 26 9.2 (7.6) NR
Di Benedetto, 2006100 English 81 Acute coronary syndrome ––
Hospital
19 NR .0.90
Dutton, 2004/Grothe, 2005101,102 English 220 Adult –– Primary care 52 12.6 (10.4) 0.90
Frasure-Smith & Lespe´rance,
2008103 English/French 804 Coronary patients –– Hospital 19 NR 0.90
Hamid, 2004104 Arabic 493 Adult –– Primary care 100 13.0 (8.1) NR
Harris & D’Eon, 2008105 English 481 Chronic pain –– Hospital 58 26.9 (11.7) 0.92
Hayden, 2012106 English 83 Bariatric surgery –– Hospital 71 13.4 (9.1) 0.89
Jamroz-Wisniewska, 2007107 Polish 104 Multiple sclerosis –– Hospital 74 14.4 (9.2) NR
Jones, 2005108 English 174 Epilepsy –– Hospital 66 NR 0.94
Kirsch-Darrow, 2011109 English 161 Parkinson disease –– Hospital 31 9.5 (7.2) 0.89
Lopez, 2012110 English 345 Chronic pain –– Hospital 0 23.0 (12.2) 0.93
Low & Hubley, 2007111 English 119 Coronary patients –– Hospital 25 8.0 (7.1) 0.89
Mahmud, 2004112 Malay 61 Postpartum –– Primary care I 100 4.4 (5.5) 0.89
354 Postpartum –– Primary care II 6.2 (6.4)
can be obtained even without intervention and might be attributable to the measurement process. The measure-ment error due to time length as captured by the retest estimate is probably larger than the error due to item heterogeneity and content as captured by cross-sectional internal consistency.128
On the other hand, Hiroe et al.72investigated sensitivity to change by anchoring the BDI-II against the Clinical Global Impression-Change (CGI-I) subscale 2 weeks after first consultation of 40 patients with major depres-sion. The instrument was able to distinguish between all grades of depression severity. Since changes in score could also be the result of a measurement effect, clinicians should be careful when making important treatment decisions based solely on information from the BDI-II.
Item characteristics
The true score of a given scale, as well as its reliability, is the result of a set of scores that are susceptible to the influence of individual item errors.130Further analysis of item characteristics might overcome this measurement effect.
In comparison with its previous version, the item characteristics of the BDI-II have been changed in terms of item endorsement rate, content coverage, and homo-geneity. Most investigations of non-clinical samples reported item scores in the low end of the possible range (0-3), resulting in a skewed distribution of item scores. Typically, non-clinical participants tended to report an average item score below 1.31,131Furthermore, the mean item score does not exceed 2 in most clinical samples. In the case of extreme scores, endorsement bias might push the distribution of the results upward. Some researchers have criticized the possibility of malingered or deceitful ratings by the respondents due to the self-report nature of the scale.75,83,86 The potential fakability of the inventory should be kept in mind during the interpretation of the test.
The item suicidal thoughts had the lowest endorsement rate; however, the substantial correlation still provides evidence of its contribution to the measured construct. Similarly, loss of sexual interest displayed the worst item-total correlation, although it remained significantly related to the whole construct under consideration.8,31 Conversely, somatic items such as change in sleeping pattern and in appetite also presented low scores for non-clinical samples. The hypothesis of gender differ-ences in somatic symptoms132 was not supported by Delisle et al.,68 who showed that the experience and reporting of somatic symptoms could explain merely a small portion of discrepancy in depressed patients. Testing the hypothesis of whether individual baseline depressive symptoms in the interest-activity domain would predict outcome, the items pessimism and loss of energy were found to be independent predictors of both remission and response in the treatment setting.90 The effects of new items and wording revisions on the psychometric performance of the scale have not been fully assessed, and sample type should be taken into account when interpreting scores.
Because the selected items and content of the BDI-II were modified in accordance with symptoms defined in the DSM-IV as specific to a subtype of depression, it is reasonable to expect a more stringent degree of homogeneity. Beck8 reported a median item-total scale correlation of 0.59 for the BDI-II in a sample of college students (n=120). Acceptable item-total scale correla-tions (rit o0.5)10were described for 17 out of 21 items.
Nonetheless, this correlation can vary across studies. For the Arabic version, substantial item-total correlation was described for 10 items among Islamic students,131whereas adequate item-total correlation of the Portuguese version in Brazilian samples was reported for 15 items.31Factors such as language version, type of sample, age range, educational level, and severity of depression might affect the difficulty of item endorsement.133 Insight into which items should be assigned to a scale can improve its performance through item-level analysis.
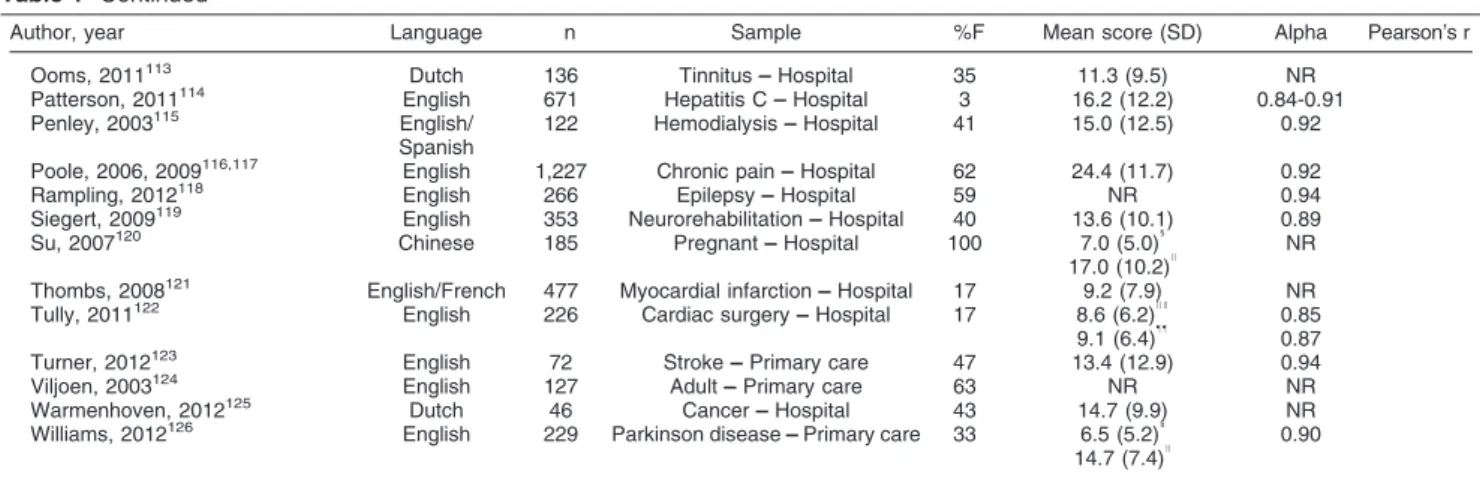
Table 1 Continued
Author, year Language n Sample %F Mean score (SD) Alpha Pearson’s r
Ooms, 2011113 Dutch 136 Tinnitus –– Hospital 35 11.3 (9.5) NR
Patterson, 2011114 English 671 Hepatitis C –– Hospital 3 16.2 (12.2) 0.84-0.91
Penley, 2003115 English/
Spanish
122 Hemodialysis –– Hospital 41 15.0 (12.5) 0.92
Poole, 2006, 2009116,117 English 1,227 Chronic pain –– Hospital 62 24.4 (11.7) 0.92
Rampling, 2012118 English 266 Epilepsy –– Hospital 59 NR 0.94
Siegert, 2009119 English 353 Neurorehabilitation –– Hospital 40 13.6 (10.1) 0.89
Su, 2007120 Chinese 185 Pregnant –– Hospital 100 7.0 (5.0)1
17.0 (10.2)I
NR
Thombs, 2008121 English/French 477 Myocardial infarction –– Hospital 17 9.2 (7.9) NR
Tully, 2011122 English 226 Cardiac surgery –– Hospital 17 8.6 (6.2)II
0.85 9.1 (6.4)""
0.87 Turner, 2012123 English 72 Stroke –– Primary care 47 13.4 (12.9) 0.94
Viljoen, 2003124 English 127 Adult –– Primary care 63 NR NR
Warmenhoven, 2012125 Dutch 46 Cancer –– Hospital 43 14.7 (9.9) NR
Williams, 2012126 English 229 Parkinson disease –– Primary care 33 6.5 (5.2)1
14.7 (7.4)I 0.90
BDI-II = Beck Depression Inventory-II; NR = not reported; SD = standard deviation.
*Men,{
women,{
half-random sample,1
non-depressed,I
depressed,"
first administration,**second administration,{{
sample included some of the dataset from previous reports,{{
English,11
Spanish,II
preoperative,""
Item response theory and Rasch analysis
Most validation studies of the BDI-II were analyzed on the grounds of classic test theory (CTT), assuming a true score for each respondent and disregarding the measure-ment error. In other words, two individuals with the same total score may differ in terms of the relative severity and frequency of symptoms. In CTT, most test performances are computed as a whole rather than at the item level. Error is often assumed to be normally distributed and uncorrelated with the true score. Although the statistics produced are usually generalized to similar respondents taking a similar test, the results should only apply to those individuals taking that test. As a psychometric break-through to these limitations, latent trait models based on item response theory (IRT) aim to look beyond the CTT: at the underlying traits that are producing the test performance. The results of an IRT-based test can provide sample-free measurement and are measured at the item level in terms of difficulty and discrimination. This method is being increasingly used in the empirical construction and evaluation of modern psychometric instruments.
A sound rating scale should measure a single psychopathological construct (i.e., an illness or syn-drome) and be composed of items that adequately cover a constellation of symptoms that are associated with the syndrome. According to IRT, a given scale and its constituent items may have good reliability estimates but still fail to meet IRT criteria of unidimensionality.134 Efforts to analyze individual items and to identify a single dimension of depression severity can benefit from several IRT models, e.g., Rasch analysis. This method assesses the extent to which empirical data correspond to an ideal dimension, by identifying a unidimensional set of items from a rating scale, and evaluates how adequately these items measure the full range of clinical severity.
Use of the IRT is particularly pressing in studies investigating clinical change in depressive syndromes. Items that are insensitive to change will underestimate the strength of actual treatment effects. In contrast, a true treatment effect can be weakened if patients are falsely identified as not having changed, thus leading to spurious claims of ineffectiveness of the therapeutic intervention. If only items measuring mild depression were used to compose a depression scale, it would be very difficult to discriminate between moderate and severe cases of depression with this instrument, since high scores on all items would characterize both states.
The magnitude to which a severity score actually measures depression is related to a unidimensional syndrome. When depression is heterogeneous, the interpretation of a single summed score is unclear. For example, if items assessing psychological and physical symptoms were only loosely related, a single score would not distinguish between two potentially different groups of depressed patients –– with primarily psychological or with primarily vegetative symptoms. Any effects of an inter-vention targeting only one of these aspects would be harder to detect.
Subsequently, a subset of BDI-II items that would measure a single dimension of depression across a wide range of severity can be sensitive at mild, moderate, or severe levels. IRT analysis can improve the scale items in a psychometrically stronger fashion. When disturbed thresholds are identified, item rescoring may be neces-sary. One expects diverse item ratings at different levels of severity, with zeroes more frequent at mild levels of overall depression and higher item scores more common with more severe presentations of depression. Moreover, whereas most items on the BDI-II are sensitive to the level of depression severity, many items may present response options that can be considered awkward, at the very least.
Seigert et al.119 examined each BDI-II item for differential item functioning in a neurological sample (n=315). Three items (changes in sleeping pattern, changes in appetite, and loss of interest in sex) were removed in an iterative fashion after identification of misfit to model expectations. Possibly, these items measure different dimensions. In the real world, the likelihood of receiving a rating of 1 on the insomnia item was essentially the same regardless of the overall severity of depression, but the likelihood of receiving a rating of 3 on sad mood was very low even when overall depression was severe. These findings suggest that the rating scheme was not ideal for many BDI-II items, decreasing its capacity to detect change. Additional applications of this type of technique include detection of translation or equivalence problems between language versions at the item level.23
Measurement invariance is a prerequisite for consider-ing the equivalence of the scale across versions, as well as for using it to make valid and interpretable compar-isons of the severity of depression among different groups. Applying the IRT-related item functioning analy-sis, Hambrick et al.135 compared response patterns of African American and Asian American undergraduates to those of white counterparts on measures of depression, social anxiety, and worry. While the response patterns of African American participants were roughly equivalent to those of their white counterparts, there were substantial differences in measures of worry and social anxiety. Using a mixed item response model incorporating both latent class and Rasch analysis, Wu & Huang136showed that person heterogeneity (e.g., different response usage and styles) of a student sample could reflect two latent classes without compromising scale construct validity. These investigations are examples of how the family of IRT techniques can address several psychometric ques-tions at the item level, beyond the summed score of CTT.
Concurrent and discriminant validity
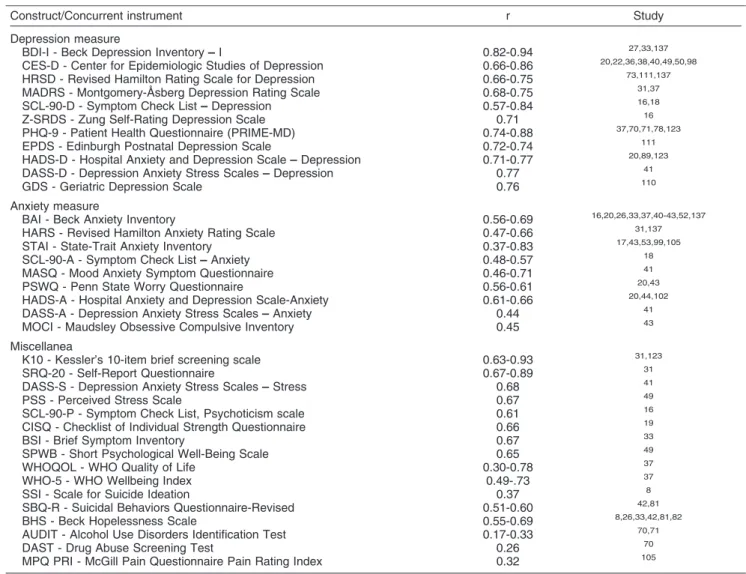
coefficients (r) ranging from 0.82 to 0.94.27,33,137 The overlap of the construct measured by BDI-II with that of other widely used scales to assess depression, e.g., the Center for Epidemiologic Studies of Depression (CES-D), the Hamilton Depression Rating Scale (HAM-D), the Zung Self-Rating Depression Scale (SDS), the Montgomery-A˚ sberg Depression Rating Scale (MADRS), and the Geriatric Depression Scale (GDS), was also quite high, ranging from 0.66 to 0.86 (Table 2). Researchers and clinicians need to be aware of the different constructs covered by depression instruments, which, while supposedly measuring the same attribute, might be focused on different components of this mood condition. Although BDI-II was designed to be a non-theoretically driven instrument, its coverage seems to be broader than the intended DSM-IV description of major depression.
The convergent validity between the BDI-II and scales that assess anxiety –– such as the Beck Anxiety Inventory (BAI), the Hamilton Anxiety Rating Scale (HAM-A), and
the State-Trait Anxiety Inventory (STAI) –– was also significant, with a wide range of correlation coefficients (0.37 to 0.83; rough estimate of 0.50). On the other hand, overlap between the BDI-II and scales that assess general psychopathology (e.g., K10 and Self-Report Questionnaire [SEQ]) was good to excellent.31,123 These significant concurrent correlations are expected and might be linked to the underlying constructs and the characteristics of the instruments. This overlap between anxiety and depressive symptoms is indicative of symptomatic co-occurrence as well as of the high rate of comorbidity of these clinical syndromes. As depression is one of the broadest indicators of mental health, a high score on the BDI scale could be explained by many other disorders, physical illness, or social problems. In this respect, BDI should not be viewed as a specific indicator of depression. In practice, BDI-II scores can be mis-interpreted, leading the clinician to assume depression as a primary issue, when used without a thorough assessment.
Table 2 Concurrent and discriminant validity of the Beck Depression Inventory-II with measures of depression, anxiety, and other miscellaneous constructs*
Construct/Concurrent instrument r Study Depression measure
BDI-I - Beck Depression Inventory –– I 0.82-0.94 27,33,137 CES-D - Center for Epidemiologic Studies of Depression 0.66-0.86 20,22,36,38,40,49,50,98
HRSD - Revised Hamilton Rating Scale for Depression 0.66-0.75 73,111,137 MADRS - Montgomery-A˚ sberg Depression Rating Scale 0.68-0.75 31,37
SCL-90-D - Symptom Check List –– Depression 0.57-0.84 16,18 Z-SRDS - Zung Self-Rating Depression Scale 0.71 16
PHQ-9 - Patient Health Questionnaire (PRIME-MD) 0.74-0.88 37,70,71,78,123
EPDS - Edinburgh Postnatal Depression Scale 0.72-0.74 111
HADS-D - Hospital Anxiety and Depression Scale –– Depression 0.71-0.77 20,89,123
DASS-D - Depression Anxiety Stress Scales –– Depression 0.77 41 GDS - Geriatric Depression Scale 0.76 110
Anxiety measure
BAI - Beck Anxiety Inventory 0.56-0.69 16,20,26,33,37,40-43,52,137
HARS - Revised Hamilton Anxiety Rating Scale 0.47-0.66 31,137 STAI - State-Trait Anxiety Inventory 0.37-0.83 17,43,53,99,105
SCL-90-A - Symptom Check List –– Anxiety 0.48-0.57 18
MASQ - Mood Anxiety Symptom Questionnaire 0.46-0.71 41
PSWQ - Penn State Worry Questionnaire 0.56-0.61 20,43
HADS-A - Hospital Anxiety and Depression Scale-Anxiety 0.61-0.66 20,44,102
DASS-A - Depression Anxiety Stress Scales –– Anxiety 0.44 41
MOCI - Maudsley Obsessive Compulsive Inventory 0.45 43 Miscellanea
K10 - Kessler’s 10-item brief screening scale 0.63-0.93 31,123 SRQ-20 - Self-Report Questionnaire 0.67-0.89 31
DASS-S - Depression Anxiety Stress Scales –– Stress 0.68 41
PSS - Perceived Stress Scale 0.67 49
SCL-90-P - Symptom Check List, Psychoticism scale 0.61 16
CISQ - Checklist of Individual Strength Questionnaire 0.66 19 BSI - Brief Symptom Inventory 0.67 33
SPWB - Short Psychological Well-Being Scale 0.65 49 WHOQOL - WHO Quality of Life 0.30-0.78 37
WHO-5 - WHO Wellbeing Index 0.49-.73 37 SSI - Scale for Suicide Ideation 0.37 8
SBQ-R - Suicidal Behaviors Questionnaire-Revised 0.51-0.60 42,81 BHS - Beck Hopelessness Scale 0.55-0.69 8,26,33,42,81,82
AUDIT - Alcohol Use Disorders Identification Test 0.17-0.33 70,71
DAST - Drug Abuse Screening Test 0.26 70
MPQ PRI - McGill Pain Questionnaire Pain Rating Index 0.32 105
r = Pearson’s product-moment correlation. Negative correlation is omitted in the numerical value.
Concerning discriminant validity, studies have indi-cated low correlation (r,0.4) with instruments assessing alcohol and drug use70,71 and chronic pain.105 It is noteworthy that suicidal ideation, which is one of the core features of depression and an item on the BDI-II, correlated only poorly to moderately with the instru-ment.8,81 More investigations should be conducted to document concurrent validity in comparison with well-known constructs.
Although the construction of the BDI-II adopted a non-theoretical strategy, the high concurrent validity between scales assessing depressive and anxiety states (and, to a lesser extent, the poor discriminant validity between BDI-II and other constructs) suggest the need for a theoretical model to elucidate the relationship, whether similarity or dissimilarity, between these disorders. In light of empirical structural evidence, Watson & Clark’s contributions on a psychopathological construct named negative affect138-140 advocated that the boundaries of mood and anxiety disorders might be collapsed together into an overarching class of emotional disorders and further decomposed into some meaningful subclasses of disorders.
Criterion-oriented validity
Based on the scores of 500 outpatients recruited from four clinics, the original authors of the instrument8 proposed the following rules of thumb for score inter-pretation with different specifiers of severity: 0-13 to indicate minimal or no depression; 14-19, mild depres-sion; 20-28, moderate depresdepres-sion; and 29-63, severe depression. For instance, the average BDI-II score in this patient sample with mood disorders was M=26.6. Mean scores for major depressive episode, recurrent depres-sion, and dysthymia were, respectively, 28.1, 29.4, and 24.0.
Although the instrument was originally designed to measure the severity of depression, existing evidence shows that the BDI-II can be recommended to screen for probable cases of major depression (Table 3). In general, studies reported a sensitivity ofo0.70. Sensitivity should
be viewed as the most important indicator to minimize the chance of false-negative diagnosis of depressive dis-orders. Significant diagnostic accuracy, as expressed by the area under the receiver operating characteristics (ROC) curve, was around 75% and higher. Sources of
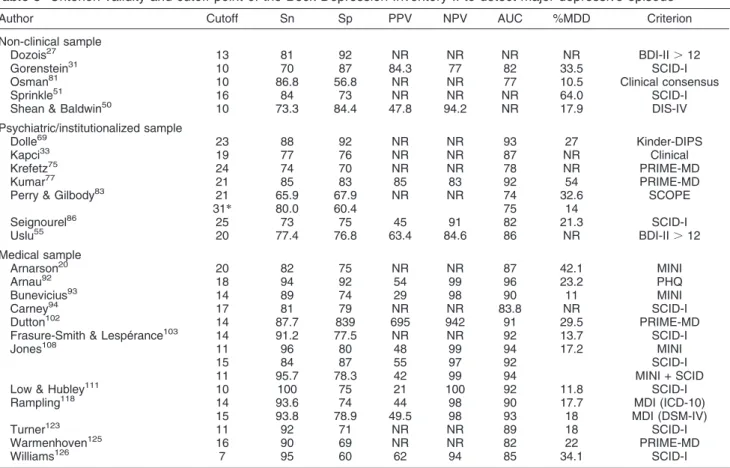
Table 3 Criterion validity and cutoff point of the Beck Depression Inventory-II to detect major depressive episode
Author Cutoff Sn Sp PPV NPV AUC %MDD Criterion Non-clinical sample
Dozois27 13 81 92 NR NR NR NR BDI-II .12 Gorenstein31 10 70 87 84.3 77 82 33.5 SCID-I Osman81 10 86.8 56.8 NR NR 77 10.5 Clinical consensus
Sprinkle51 16 84 73 NR NR NR 64.0 SCID-I
Shean & Baldwin50 10 73.3 84.4 47.8 94.2 NR 17.9 DIS-IV
Psychiatric/institutionalized sample
Dolle69 23 88 92 NR NR 93 27 Kinder-DIPS Kapci33 19 77 76 NR NR 87 NR Clinical
Krefetz75 24 74 70 NR NR 78 NR PRIME-MD Kumar77 21 85 83 85 83 92 54 PRIME-MD
Perry & Gilbody83 21 31*
65.9 80.0
67.9 60.4
NR NR 74 75
32.6 14
SCOPE Seignourel86 25 73 75 45 91 82 21.3 SCID-I
Uslu55 20 77.4 76.8 63.4 84.6 86 NR BDI-II .12 Medical sample
Arnarson20 20 82 75 NR NR 87 42.1 MINI Arnau92 18 94 92 54 99 96 23.2 PHQ
Bunevicius93 14 89 74 29 98 90 11 MINI Carney94 17 81 79 NR NR 83.8 NR SCID-I
Dutton102 14 87.7 839 695 942 91 29.5 PRIME-MD Frasure-Smith & Lespe´rance103 14 91.2 77.5 NR NR 92 13.7 SCID-I
Jones108 11 96 80 48 99 94 17.2 MINI
15 84 87 55 97 92 SCID-I 11 95.7 78.3 42 99 94 MINI + SCID Low & Hubley111 10 100 75 21 100 92 11.8 SCID-I Rampling118 14 93.6 74 44 98 90 17.7 MDI (ICD-10)
15 93.8 78.9 49.5 98 93 18 MDI (DSM-IV) Turner123 11 92 71 NR NR 89 18 SCID-I
Warmenhoven125 16 90 69 NR NR 82 22 PRIME-MD Williams126 7 95 60 62 94 85 34.1 SCID-I
AUC = area under the curve; DIS-IV = Diagnostic Interview Schedule-IV; Kinder-DIPS = Diagnostisches Interview bei psychischen Sto¨rungen im Kindes und Jugendalter; MDI = Major Depression Inventory; MINI: Mini International Neuropsychiatric Interview; NPV = negative predictive value; NR = not reported; PHQ = PRIME-MD Patient Health Questionnaire; PPV = positive predictive value; PRIME-MD = primary care evaluation of mental disorders; SCID-I = Structured Clinical Interview for DSM-IV Axis I Diagnosis; SCOPE: measure of vulnerability to suicide and self-harm behavior; Sn = sensitivity; Sp = specificity; %MDD = proportion of major depressive disorder in the sample.
variation may depend on the type of the sample (non-clinical or (non-clinical), percentage of depressive subjects, and external gold-standard criterion for DSM-IV depres-sion. As shown in Table 3, non-clinical samples displayed the lowest range of cutoff points (from 10 to 16) to detect major depression, medical samples had an intermediate cutoff (from 7 to 20), and psychiatric samples had the highest cutoff (from 19 to 31). However, caution is warranted when using the cutoff guidelines presented for criterion-referenced interpretation and regarding misuse of the BDI-II as a diagnostic instrument. While the reported thresholds are helpful indicators for detecting suspected cases that should be referred for additional clinical assessment, the validity of these findings is essentially limited by the arbitrary external criterion adopted for comparison. Regardless of sound criterion validity, most investigators were unanimous in recom-mending the BDI-II as a screening tool as the first phase of two-stage studies to prevent excessive cases of false-positive detection if the scale is used as a single tool.50
Some BDI-II items were associated with treatment response in a treatment setting.90 In the regression model, the items pessimism and loss of energy emerged as predictors of response after 2 years. When both symptoms were endorsed at baseline, these items could predict a 61.1% chance of response, and absence of both symptoms predicted a 49.4% chance of response. Routine clinical assessment of these depres-sive symptoms can provide information about treatment progress as early as the initial assessment of the intake phase.
Content and construct validity
Besides test performance and criteria scores, the under-lying trait or quality of a given test is a matter of the utmost importance for its validity.141Two relevant topics are the description of content validity and the latent construct assessed by the instrument.142 While content coverage was established by ordinary deduction of the universe of items accepted to define the construct, structural or construct validity can be demonstrated by statistical methods, such as factor analyses. The development of a sound measurement instrument for large-scale use requires demonstration of the latent trait being measured, and of the types, categories, and behaviors that constitute an adequate representation of depression.
The content validity of the BDI-II appears to be adequate but narrower than that of its former version.10,42 The BDI-I reflected six of the nine criteria for DSM-based depression,143,144while the BDI-II presented an improved performance on specificity to indicate DSM-based depression. Consequently, the sensitivity of the test to detect a broader concept of depression may have been affected.27,50The acceptance of the content universe as a qualitative representation of the trait to be measured is critical in this type of validity.130Although this DSM-based instrument for assessment of depression can allow
reliable comparisons in an array of settings and facilitates tailoring of therapeutic interventions, this trend should not be viewed as the true representation of the construct of depression.145
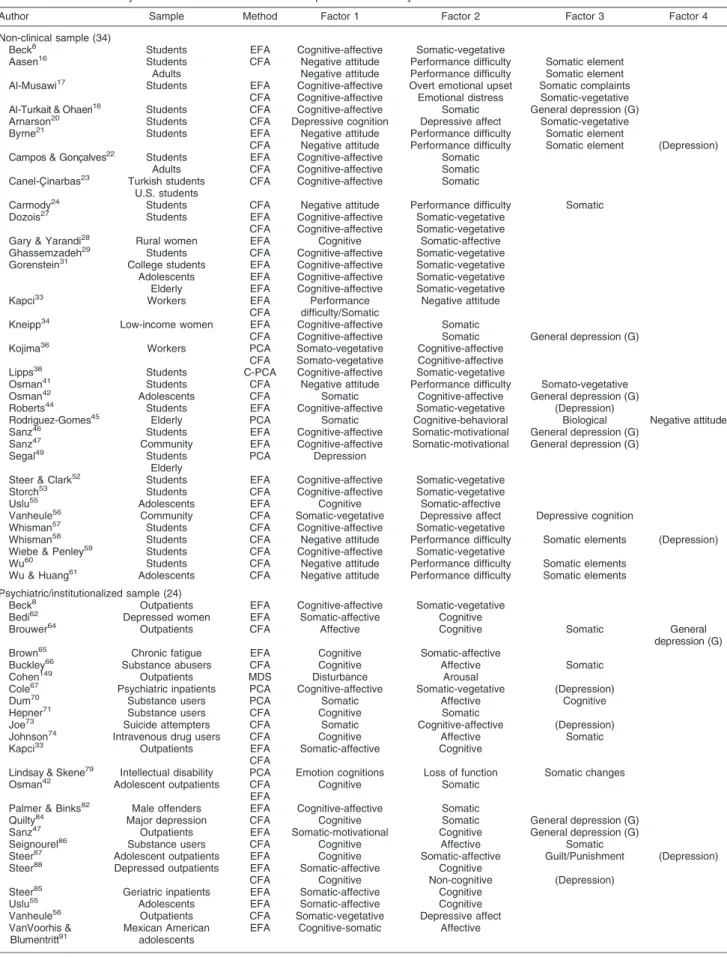
Construct validity tests how well a given psychological measure relates to measures of theory-driven constructs. Therefore, construct validation refers to the simultaneous procedure of measurement and theory validation.146,147 However, since the BDI-II was built on non-theoretical assumptions, investigators often choose factor analysis to account for variance in test performance and deter-mine which psychological events make up test perfor-mance. Besides reducing the items to explain the structure of data covariance, factor analysis depicts the latent structure of a given test. This family of techniques can determine how and to what extent selected items cluster on one or more factors.148 Table 4 lists 74 investigations reporting the factor structure of BDI-II, which represented around two-thirds of the retained studies, grouped by type of sample and specified strategy for factor extraction. Some investigators have adopted both exploratory and confirmatory strategies with different purposes, e.g., to identify problems with items reported to have non-significant factor loadings, or for cross-valida-tion of data. The use of the state-of-art confirmatory approach is a trend in studies investigating the latent structure of BDI-II.
Using the means of exploratory factor analysis, Beck8 reported a structure of two oblique factors, repre-sented by the cognitive-affective and somatic-vegetative dimensions (between-factor correlation, r = 0.62 and 0.66 for student and outpatient samples respectively). A similar two-dimensional structure was obtained in non-clinical samples using a different language version of the BDI-II,27,31,55 in psychiatric samples,8,33,55,62,65,82,88,91 and in medical patients.96,114,116,124 The between-factor correlation coefficients in the two-dimensional structure of the BDI-II were generally high (.0.50, range 0.49-0.87) and could account for a large amount of common data variance. Meta-analysis of selected empirical studies on the factor structure of the BDI concluded that much of the data variability can be attributed to the common dimen-sion of severity of depresdimen-sion and the other part to somatic symptoms.12 However, some investigators also reached different results, with more than two dimensions and different item loadings.21,45,70 These conflicting findings posited the existence of alternative structural models.
Table 4 Construct validity of latent structure of the Beck Depression Inventory-II
Author Sample Method Factor 1 Factor 2 Factor 3 Factor 4
Non-clinical sample (34)
Beck8 Students EFA Cognitive-affective Somatic-vegetative
Aasen16 Students CFA Negative attitude Performance difficulty Somatic element
Adults Negative attitude Performance difficulty Somatic element Al-Musawi17 Students EFA Cognitive-affective Overt emotional upset Somatic complaints
CFA Cognitive-affective Emotional distress Somatic-vegetative Al-Turkait & Ohaeri18 Students CFA Cognitive-affective Somatic General depression (G)
Arnarson20 Students CFA Depressive cognition Depressive affect Somatic-vegetative
Byrne21 Students EFA Negative attitude Performance difficulty Somatic element
CFA Negative attitude Performance difficulty Somatic element (Depression) Campos & Gonc¸alves22 Students EFA Cognitive-affective Somatic
Adults CFA Cognitive-affective Somatic Canel-C¸ inarbas23 Turkish students CFA Cognitive-affective Somatic
U.S. students
Carmody24 Students CFA Negative attitude Performance difficulty Somatic
Dozois27 Students EFA Cognitive-affective Somatic-vegetative
CFA Cognitive-affective Somatic-vegetative Gary & Yarandi28 Rural women EFA Cognitive Somatic-affective
Ghassemzadeh29 Students CFA Cognitive-affective Somatic-vegetative
Gorenstein31 College students EFA Cognitive-affective Somatic-vegetative
Adolescents EFA Cognitive-affective Somatic-vegetative Elderly EFA Cognitive-affective Somatic-vegetative
Kapci33 Workers EFA
CFA
Performance difficulty/Somatic
Negative attitude
Kneipp34 Low-income women EFA Cognitive-affective Somatic
CFA Cognitive-affective Somatic General depression (G) Kojima36 Workers PCA Somato-vegetative Cognitive-affective
CFA Somato-vegetative Cognitive-affective Lipps38 Students C-PCA Cognitive-affective Somatic-vegetative
Osman41 Students CFA Negative attitude Performance difficulty Somato-vegetative
Osman42 Adolescents CFA Somatic Cognitive-affective General depression (G)
Roberts44 Students EFA Cognitive-affective Somatic-vegetative (Depression)
Rodriguez-Gomes45 Elderly PCA Somatic Cognitive-behavioral Biological Negative attitude
Sanz46 Students EFA Cognitive-affective Somatic-motivational General depression (G)
Sanz47 Community EFA Cognitive-affective Somatic-motivational General depression (G)
Segal49 Students PCA Depression
Elderly
Steer & Clark52 Students EFA Cognitive-affective Somatic-vegetative
Storch53 Students CFA Cognitive-affective Somatic-vegetative
Uslu55 Adolescents EFA Cognitive Somatic-affective
Vanheule56 Community CFA Somatic-vegetative Depressive affect Depressive cognition
Whisman57 Students CFA Cognitive-affective Somatic-vegetative
Whisman58 Students CFA Negative attitude Performance difficulty Somatic elements (Depression)
Wiebe & Penley59 Students CFA Cognitive-affective Somatic-vegetative
Wu60 Students CFA Negative attitude Performance difficulty Somatic elements Wu & Huang61 Adolescents CFA Negative attitude Performance difficulty Somatic elements
Psychiatric/institutionalized sample (24)
Beck8 Outpatients EFA Cognitive-affective Somatic-vegetative
Bedi62 Depressed women EFA Somatic-affective Cognitive
Brouwer64 Outpatients CFA Affective Cognitive Somatic General
depression (G) Brown65 Chronic fatigue EFA Cognitive Somatic-affective
Buckley66 Substance abusers CFA Cognitive Affective Somatic
Cohen149 Outpatients MDS Disturbance Arousal
Cole67 Psychiatric inpatients PCA Cognitive-affective Somatic-vegetative (Depression)
Dum70 Substance users PCA Somatic Affective Cognitive
Hepner71 Substance users CFA Cognitive Somatic
Joe73 Suicide attempters CFA Somatic Cognitive-affective (Depression)
Johnson74 Intravenous drug users CFA Cognitive Affective Somatic
Kapci33 Outpatients EFA Somatic-affective Cognitive
CFA
Lindsay & Skene79 Intellectual disability PCA Emotion cognitions Loss of function Somatic changes
Osman42 Adolescent outpatients CFA
EFA
Cognitive Somatic
Palmer & Binks82 Male offenders EFA Cognitive-affective Somatic
Quilty84 Major depression CFA Cognitive Somatic General depression (G)
Sanz47 Outpatients EFA Somatic-motivational Cognitive General depression (G)
Seignourel86 Substance users CFA Cognitive Affective Somatic
Steer87 Adolescent outpatients EFA Cognitive Somatic-affective Guilt/Punishment (Depression)
Steer88 Depressed outpatients EFA Somatic-affective Cognitive
CFA Cognitive Non-cognitive (Depression) Steer85 Geriatric inpatients EFA Somatic-affective Cognitive
Uslu55 Adolescents EFA Somatic-affective Cognitive
Vanheule56 Outpatients CFA Somatic-vegetative Depressive affect
VanVoorhis &
Blumentritt91 Mexican Americanadolescents EFA Cognitive-somatic Affective
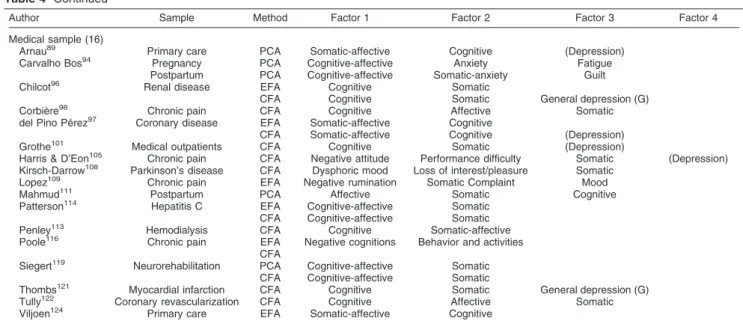
BDI-II can be best described as three-dimensional, distributing the cognitive-affective dimension into two distinct factors.17,20,41,56,66,98,122,136 Further analyses revealed that the BDI-II presents reasonable factorial invariance when assessing the severity of depressive symptoms; this covariance structure is equivalent across gender and ethnicity in American college students58and across gender in Taiwanese college students and adolescents.60,61
Sophisticated alternative structural analysis of the BDI-II was strengthened by two investigative breakthroughs: the hierarchical model and the bifactor model. The first group of strategies depicted a general depression dimension as a higher-order structure to explain the variance of lower-order dimensions.21,58,67,73,87,101,105 Although still scant, the bifactor model (G) was able to identify a non-hierarchical general depression in addition to the traditional two-dimensional struc-ture.18,34,64,81,84,96,121 These investigations shared the view that much of the variance of the BDI-II items can be accounted for by a hierarchical higher order or a parallel dimension of depression, where much of the common variance can be explained by a general construct. Practitioners should be careful when interpreting sub-scale scores, which might be greatly related to the heterogeneous characteristics of depressive conditions.
Cross-cultural issues
With the BDI-II being such a popular measure adapted for use in several countries, information on cross-cultural comparability is still remarkably scarce. The cross-cultural equivalence between the versions of the BDI-II stands out as a topic of fervent academic interest: the symptomatology of depression in different
culture/races or languages can be compared by testing the measurement variance of the instrument.23,48,58,59,150 For example, large differential item functioning values were found for 12 BDI-II items between Turkish and U.S. students with same level of depression.23 Besides suggesting an equivalence problem with the Turkish version, this study indicated that participants would respond in a different way to different language versions of the instrument. Likewise, the construct validity of the BDI-II (Table 4) also varies over existing language versions. Before a true cross-cultural difference can be acknowledged, more fine-grained analyses should be conducted to ascertain the sources of this dissimilarity.
Limitations
Before widespread adoption of the BDI-II as a standard measure of depression, the potential sources of its score variation should be examined. First, this review has attempted to minimize the file drawer bias by including psychometric articles published in journals, monographs, and book chapters. Explicit exclusion criteria were used to select high-quality investigations. Moreover, efforts were made to contact authors in the field to obtain primary psychometric data for the BDI-II. Unlike tradi-tional experimental studies, psychometric analyses are more descriptive in nature, with both significant and non-significant studies being available. Therefore, the pub-lication bias seems to affect the current review to a lesser degree than in experimental-type research.
The spectrum bias refers to the psychometric phenom-enon of differential performance of a test in different settings, thus affecting the generalizability of the results. For example, the somatic factor can be the dominant dimension in patient samples88vs. depressive cognition
Table 4 Continued
Author Sample Method Factor 1 Factor 2 Factor 3 Factor 4
Medical sample (16)
Arnau89 Primary care PCA Somatic-affective Cognitive (Depression)
Carvalho Bos94 Pregnancy PCA Cognitive-affective Anxiety Fatigue
Postpartum PCA Cognitive-affective Somatic-anxiety Guilt
Chilcot96 Renal disease EFA Cognitive Somatic
CFA Cognitive Somatic General depression (G)
Corbie`re98 Chronic pain CFA Cognitive Affective Somatic
del Pino Pe´rez97 Coronary disease EFA Somatic-affective Cognitive
CFA Somatic-affective Cognitive (Depression) Grothe101 Medical outpatients CFA Cognitive Somatic (Depression)
Harris & D’Eon105 Chronic pain CFA Negative attitude Performance difficulty Somatic (Depression)
Kirsch-Darrow108 Parkinson’s disease CFA Dysphoric mood Loss of interest/pleasure Somatic
Lopez109 Chronic pain EFA Negative rumination Somatic Complaint Mood
Mahmud111 Postpartum PCA Affective Somatic Cognitive
Patterson114 Hepatitis C EFA Cognitive-affective Somatic
CFA Cognitive-affective Somatic Penley113 Hemodialysis CFA Cognitive Somatic-affective
Poole116 Chronic pain EFA Negative cognitions Behavior and activities
CFA
Siegert119 Neurorehabilitation PCA Cognitive-affective Somatic
CFA Cognitive-affective Somatic
Thombs121 Myocardial infarction CFA Cognitive Somatic General depression (G)
Tully122 Coronary revascularization CFA Cognitive Affective Somatic
Viljoen124 Primary care EFA Somatic-affective Cognitive
in non-clinical samples. On the other hand, the workup or verification bias arises when respondents with positive (or negative) diagnostic procedure results are preferentially referred to receive verification by the gold-standard procedure, producing considerable distortion in test accuracy. To the extent where these types of bias might occur, the investigators should consider the differential performance of the BDI-II when interpreting scores. Future revisions should include quantitative analysis to assess the sources of scale error.
The self-report nature of the BDI can affect its results according to social desirability, respondent educational attainment, and the gender effect of the condition.130The BDI is sometimes criticized for being too transparent to respondents and thus easily faked by those wishing to present themselves in a favorable or unfavorable light. Fortunately, this does not seem to be a pervasive problem, as the BDI-II tended to provide an accurate index of depressive manifestations in voluntary and anonymous participants, with good correlation with measures of negative psychological states such as anxiety or psychological distress. Furthermore, the non-theoretical approach of the construction of the BDI-II might introduce more problems than solutions for under-standing the scale in terms of psychometric and clinical parameters. In summary, despite its robust psychometric characteristics, as widely reported in available studies, the generalizability of the BDI-II is not free of limitations.
Comments
Depression is a common psychological state in both non-clinical and non-clinical conditions. The predicted high occurrence of depressive disorders worldwide justifies the use of self-assessment scales to detect a consensus definition of depression. These instruments must be inexpensive and easy to administer, with good accep-tance by users in the public health domain. The pressure for rapid evidence-based decisions in clinical practice and the explosion of information in the scientific literature indicate the need for an updated review to summarize the growing body of psychometric literature on self-report measures of depression, such as the BDI-II.
A good measure must supply clinicians with evidence that they find useful and relevant to the needs of their patients. Advantages of this well-investigated inventory are its high internal consistency, capacity to discriminate between depressed and non-depressed subjects, and improved content and structural validity. Consequently, investigators can benefit from this simple, short, reliable, and validated tool to design research in a variety of settings. The fact that the BDI-II is copyrighted and must be obtained from the publisher is the major obstacle against the recommendation of its widespread use as a standard second-generation self-report tool worldwide.
After more than 15 years using the BDI-II in hundreds of investigations and thousands of respondents, evidence of the validity of this authoritative scale is growing, but its use is not free of caveats. Bearing in mind that the stated purpose of the BDI-II was not to establish a diagnosis of
major depressive episode, continuous investigations must examine its appropriateness in monitoring treatment efficacy and its comparability with observer-rated scales, such as the HAM-D or the MADRS. Besides comparing the cross-cultural equivalence and conducting item-level analysis to uncover the factors affecting the interpretation of this scale for measurement of depressive symptoms, future studies of the BDI-II should be mindful of theory-based strategies of validation.
Acknowledgements
Fundac¸a˜o de Amparo a` Pesquisa do Estado de Sa˜o Paulo (FAPESP) sponsors this article and Yuan-Pang Wang is the recipient of the grant (protocol no. 2008/11415-9). Conselho Nacional de Desenvolvimento Cientı´fico e Tecnolo´gico (CNPq) sponsors Clarice Gorenstein.
Disclosure
The authors report no conflicts of interest.
References
1 Ferrari AJ, Somerville AJ, Baxter AJ, Norman R, Patten SB, Vos T, et al. Global variation in the prevalence and incidence of major depressive disorder: a systematic review of the epidemiological literature. Psychol Med. 2013;43:471-81.
2 Moussavi S, Chatterji S, Verdes E, Tandon A, Patel V, Ustun B. Depression, chronic diseases, and decrements in health: results from the World Health Surveys. Lancet. 2007;370:851-8. 3 World Health Organization (WHO). The Global burden of disease.
2004 Update. Geneva: WHO; 2008.
4 McDowell I. Measuring health: a guide to rating scales and questionnaires. 3rd ed. New York: Oxford University; 2006. 5 Beck AT, Ward CH, Mendelson M, Mock JE, Erbaugh JK. An
inventory for measuring depression. Arch Gen Psychiatry. 1961;4:561-71.
6 Beck AT, Steer RA, Garbin MG. Psychometric properties of the Beck Depression Inventory: twenty-five years of evaluation. Clin Psychol Rev. 1988;8:77-100.
7 Beck AT, Rush AJ, Shaw BF, Emery G. Cognitive therapy of depression. New York: Guilford; 1979.
8 Beck AT, Steer RA, Brown GK. BDI-II: Beck Depression Inventory Manual. 2nd ed. San Antonio: Psychological Corporation; 1996. 9 American Psychiatric Association. Diagnostic and statistical manual
of mental disorders - DSM-IV-TRH. 4th ed. Washington: American Psychiatric Publishing; 1994.
10 Nunnally JC, Bernstein IH. Psychometric theory. New York: McGraw; 1994.
11 Furukawa TA. Assessment of mood: guides for clinicians. J Psychosom Res. 2010;68:581-9.
12 McPherson A, Martin CR. A narrative review of the Beck Depression Inventory (BDI) and implications for its use in an alcohol-dependent population. J Psychiatr Ment Health Nurs. 2010;17:19-30.
13 Shafer AB. Meta-analysis of the factor structures of four depression questionnaires: Beck, CES-D, Hamilton, and Zung. J Clin Psychol. 2006;62:123-46.
14 Dozois DJA. Beck Depression Inventory-II. In: Weiner IB, Craighead WE, editors. The Corsini Encyclopedia of psychology. 4th ed. New York: John Wiley & Sons; 2010. p. 210-1.
15 Kazdin AE. Encyclopedia of Psychology. Oxford: American Psychological Association; 2000.