Inventory for depression in university students
Estrutura fatorial do Inventário de Depressão Beck
para depressão em estudantes universitários
Adalberto Campo-Arias
1, Yuly Suárez-Colorado
2, Carmen Cecilia Caballero-Domínguez
2ABSTRACT
Objective: To explore the dimensionality of the Beck Depression Inventory (BDI) among
Colombian college students. Methods: A validation study was designed, involving the
participation of a sample of 786 health science students (medicine, nursing, and psychology) aged between 18 and 27 (M = 20.0, SD = 1.9). The participants completed the 21-item BDI. Internal consistency was calculated (Cronbach’s alpha and McDonald’s omega) and dimensionality
was demonstrated using factorial confirmatory analysis (CFA). Results:The Kaiser-Meyer-Olkin
(KMO) measure of sampling adequacy was high (0.898) and the Bartlett’s sphericity test gave excellent results (chi-square = 3,102.60; df = 210; p < 0.001). One-, two- and three-dimensional models were used. The unidimensional model performed best, representing 24.8% of the total variance, high internal consistency, a Cronbach’s alpha of 0.83 and a McDonald’s omega of 0.84. However, the CFA did not fit adequately (chi-square = 583.79; df = 189; p < 0.001,
RMSEA = 0.052, CI 90% 0.047-0.056, CFI = 0.87, TLI = 0.85 and SMSR = 0.04). Conclusions:The
best factor solution for theBDI is given by the unidimensional model, which presents high
internal consistency. However, its adjustment in the CFA is not acceptable.
RESUMO
Objetivo: Avaliar a dimensionalidade do Inventário de Depressão Beck (BDI). Métodos:
Trata-se de um estudo de validação envolvendo a participação de uma amostra de 786 es-tudantes de Ciências da Saúde (Medicina, Enfermagem, Psicologia) entre 18 e 27 anos, com idade média de 20,0 (DP = 1,9). Os participantes completaram o BDI de 21 itens. A consistên-cia interna foi calculada (alpha de Cronbach e ômega de McDonald’s) e a dimensionalidade
foi demonstrada usando análise confirmatória fatorial (ACF). Resultados: A medida
Kaiser--Meyer-Olkin (KMO) da adequação da amostragem foi alta (0,898) e o teste de esfericidade de Bartlett foi excelente (qui-quadrado 3,102.60; df = 210; p < 0,001). Foram utilizados modelos uni, bi e tridimensionais. O modelo unidimensional foi o que melhor se apresentou estatisti-camente, representando 24,8% da variância total, alta consistência interna, alpha de Cronbach de 0,83 e omega de McDonald’s de 0,84. No entanto, o CFA não se ajustou adequadamente (qui-quadrado = 583,79; gl = 189; p < 0,001, RMSEA = 0,052, IC 90% 0,047-0,056, CFI = 0,87, TLI
= 0,85 e SMSR = 0,04). Conclusões: O modelo unidimensional mostrou-se como melhor
so-lução, apresentando alta consistência interna. No entanto, seu ajuste no CFA não é aceitável.
1 Universidad Del Magdalena, Faculty of Health Sciences, School of Medicine, Santa Marta, Colombia. 2 Universidad Del Magdalena, Faculty of Health Sciences, School of Psychology, Santa Marta, Colombia.
Address for correspondence: Carmen Cecilia Caballero Universidad Del Magdalena, School of Health Sciences Carrera 32, n. 22-08, Santa Marta, Colombia (470004) Telephone: 57 5 4217940 – Ext: 1024
E-mail: [email protected]
Keywords
Students, universities, depressive symptoms, validation studies.
Palavras-chave
Estudantes, universidades, depressão, estudos de validação.
DOI: 10.1590/0047-2085000000198 Received in
2/2/2018 Approved in
INTRODUCTION
Major depressive disorder is a global public health problem that leads to great impairments in school, work, family and social functioning and years of healthy life lost1,2. As such, it
is important to be able to rely on the availability of valid and reliable instruments that allow us to screen depressive symp-toms with possible clinical importance in different contexts3.
Currently, there are many screening instruments for major depressive episodes in different contexts for clinical or
research purposes4. One of the most commonly used surveys
is the Beck Depression Inventory (BDI)5,which has different
versions with different numbers of items that quantify the
cognitive symptoms of major depressive episodes6-8.
It has been tested the psychometric performance of the BDI, internal consistency values within the acceptable range
(between 0.84 and 0.92) have been observed9-15. However,
the dimensional or factorial structure has shown different numbers of dimensions or factors from 1 to 3 factors9-12,16-18.
It is a well-known fact that these variations can present themselves in the psychometric performance of instruments such as the BDI, especially so in the response pattern that
determines the dimensionality of the measurement scale19.
As well as its theoretical implications, this also implies a need to interpret the results according to the characteristics of the
people responding to the instruments20.
The purpose of this study was to test the dimensionality (AFC) of the BDI in a sample of health sciences students in Santa Marta, Colombia.
METHODS
Design
A psychometric study was implemented to evaluate the per-formance of a construct quantification scale. Such studies are also known as instrumental methodological studies or evaluation screening or diagnostic tests according to the
area of knowledge21. The study received the approval of the
research ethics committee. Despite not presenting any risks according to the Ministry of Health Resolution 8,430 of 1993, all the participants signed the informed consent form. Con-fidentiality was guaranteed throughout the application and
analysis of the socio-demographic data and findings22.
Population
A probabilistic sampling of health sciences students in Santa Marta, Colombia, was carried out in different phases. Proba-bilistic sampling was used given that this study is a seconda-ry analysis of a cross-sectional research in which a number of different scales are applied. The sample was made up of a total of 706 students: 186 (23.7%) from nursing, 275 (35.0%) from medicine, and 325 (41.3%) from psychology. The
stu-dents’ ages ranged between 18 and 37 (M = 20.0, DE = 1.9). There was a participation rate of 616 women (78.4%) and 170 men (21.7%). The number of participants was sufficient for the calculation of internal consistency and to carry out a confirmatory factor analysis (CFA), which requires a
mini-mum number of 400 participants20.
Instruments
The students completed the 21-item BDI. The items were ori-ginally qualified in two dimensions. The first (cognitive) was made up of the first 14 sections, and the second (somatic) was made up of the remaining seven sections. Each of the items offers four answer options ranging from “never” to “al-most always”, which are then qualified from 1 to 4. The hi-gher the score, the hihi-gher the possibility of having presented
a major depressive episode in the past two weeks5.
Procedure
The students completed the instrument in the classroom, in a group application. The objectives of the research were explained, as were the ethical considerations, voluntary par-ticipation, and the fact that the exercise would not be com-pensated with any kind of incentive beyond the usefulness of the findings for science and for knowledge generation.
Statistical analysis
Confirmatory factorial analyses were carried out using the maximum likelihood method. The analyses were carried out for the two dimensions proposed originally and for one and
three dimensions, as suggested by more recent research16,17.
The typical coefficients for the beginning of the factorial analysis were used, along with Bartlett’s sphericity coeffi-cient23 and the KMO index24.
In the CFA, we determined the Satorra-Bentler chi square test, with degrees of freedom (DF) and probability value (p), the RMSEA coefficients (Root Mean Square Error of Approximation),
and a confidence interval of 90% (CI 90%), CFI (Comparative
Fit Index), TLI (Tucker-Lewis Index) and SMSR (Standardized Mean Square Residual). For the chi squared, we expected the probability value to be above 5%; for RMSEA and SRMR, below 0.06; and for CFI and TLI, values below 0.89 were expected.
Cronbach’s alpha25 and McDonald’s omega26 were
calculated to find out the internal consistency according to the conceptualized dimensions. The McDonald test is more precise in estimating the internal consistency when the equivalence principle is not fulfilled26. Data analysis was
carried out using STATA for Windows27.
RESULTS
coefficient KMO = 0.898, and Bartlett’s test showed a chi square = 1,301.17; df = 210; p < 0.001.
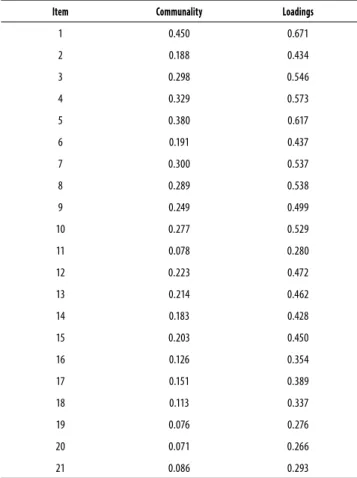
The first test was carried out for a unidimensional scale. The communality analysis in Table 1 shows coefficients higher than 0.400 except for items 11, 16, 17, 18, 19, 20 and 21. For one dimension, we recorded: Factor I = Eigen value 5.2 that explained a variance of 24.8%, a Cronbach’s alpha of 0.83 and McDonald’s omega of 0.84.
Table 1. Communalities and loadings of the BDI for single confirmatory factor analysis
Item Communality Loadings
1 0.450 0.671
2 0.188 0.434
3 0.298 0.546
4 0.329 0.573
5 0.380 0.617
6 0.191 0.437
7 0.300 0.537
8 0.289 0.538
9 0.249 0.499
10 0.277 0.529
11 0.078 0.280
12 0.223 0.472
13 0.214 0.462
14 0.183 0.428
15 0.203 0.450
16 0.126 0.354
17 0.151 0.389
18 0.113 0.337
19 0.076 0.276
20 0.071 0.266
21 0.086 0.293
The goodness of fit calculated for this CFA model
indicates a chi squared of 583, 8;p = 0.01, RMSEA = 0.05, CI
90% 0.04-0.06; CFI = 0.87; TLI = 0.85; SMSR = 0.04.
The second test corresponds to a two-dimensional model. The communality analysis in Table 2 shows: Factor I with a Cronbach’s alpha of 0.80 and McDonald’s omega of 0.82. Factor II with a Cronbach’s alpha of 0.56 and McDonald’s omega of 0.58.
The goodness of fit calculated for this CFA model, showed chi-square = 538.1; df = 188; p < 0.001; RMSEA = 0.05, CI 90% 0.04 -0.06; CFI = 0.88; TLI = 0.87; and SMSR = 0.04.
The test for three dimensions showed Factor I with a Cronbach’s alpha of 0.79 and McDonald’s omega of 0.81. Factor II presented a Cronbach’s alpha of 0.58 and McDonald’s omega of 0.57. Finally, Factor III had a Cronbach’s alpha of 0.55 and McDonald’s omega of 0.52.
Table 2. Communalities and loadings of the BDI in a two-dimensional confirmatory factor analysis
Item Communality Factor I Loadings
Factor II Loadings
1 0.445 0.675
2 0.207 0.455
3 0.314 0.560
4 0.294 0.542
5 0.396 0.629
6 0.196 0.441
7 0.317 0.563
8 0.290 0.538
9 0.277 0.507
10 0.279 0.529
11 0.070 0.265
12 0.219 0.468
13 0.209 0.457
14 0.166 0.407
15 0.140 0.374
16 0.253 0.503
17 0.298 0.546
18 0.183 0.428
19 0.162 0.402
20 0.097 0.312
21 0.044 0.209
Table 3. Communalities and loadings of the BDI in a three-dimensional confirmatory factor analysis
Item Communality Factor I Loadings
Factor II Loadings
Factor III Loadings
1 0.447 0.671
2 0.258 0.434
3 0.341 0.546
4 0.380 0.468
5 0.389 0.617
6 0.200 0.437
7 0.320 0.537
8 0.300 0.538
9 0.367 0.499
10 0.274 0.529
11 0.088 0.196
12 0.222 0.472
13 0.241 0.462
14 0.185 0.428
15 0.238 0.357
16 0.258 0.549
17 0.321 0.648
18 0.285 0.442
19 0.553 0.732
20 0.112 0.318
The goodness of fit calculated for this CFA model, showed a chi-squared = 394.6; df = 167; p < 0.001; RMSEA = 0.04, CI 90% 0.03-0.05; CFI = 0.92; TLI = 0.90; SMSR = 0.04.
DISCUSSION
This study demonstrates that the factorial solutions for one-, two- and three-dimensional BDI do not adjust adequately to the sample of health sciences students in Santa Marta, Co-lombia.
We can see that the BDI presented a Cronbach’s alpha of 0.84 when measured across the 21 items. This observation is consistent with previous research that has shown values within the desired range which falls between 0.70 and 0.959-15. This approach is correct if we consider a BDI with a
unidimensional scale28.
The original proposal of the BDI was for a bi-dimensional scale. In this study, the internal consistency for the first dimension was of 0.79 and for the second, it was 0.61. This finding is inconsistent with research using other populations that showed internal consistency values within the desired range for both dimensions9-15. It is evident that this disparity
found in terms of the values of the coefficients has practical implications for the acceptance of the dimensionality of the
scale19,28. We recommend the use of internal consistency
only for one-dimensional scales. The calculation should be carried out separately for each dimension in bi- or
multi-dimensional scales28. Furthermore, it is highly likely that
a consistency of above 0.80 for the 21 items as a set may be given directly by the number of items and not the high correlation between them19,28. It is known that this coefficient
is very sensitive to the number of items and, as such, the calculation is not recommended for a set of over 15 items for the more conservative, or up to 20 items for the more liberal. The reason is simple: as from 15 items, the internal consistency increases rapidly and tends to steer away from the real value19.
For the CFA, this analysis shows that in none of the three factorial solutions do the five goodness of fit models adjust to the data, with high chi squared and CFI, and TLI of lower than 0.90. Other research has shown that not all goodness
of fit coefficients were adequate for the BDI16,17. However,
it was concluded that the solution for one, two or three factors was the most promising12-18. These divergences in the
conclusions are caused for many different aspects. The first is that there is no absolute agreement for the quantitative and qualitative interpretation of the factorial solutions. The second is that there is an evident lack of consensus in terms
of the interpretation of the goodness of fit coefficients19.
Finally, the third is that there is notable variability of the factorial solutions according to the characteristics of the population for those scales with more than 15 items19,28.
These findings encourage a consideration of the current limitations of factorial analyses and, as such, the factorial structure of the BDI-21. The weaknesses of this approach have led to the reduction of the number of items in the instrument and, as a result, currently, 10 or less item scales which measure the essential part of the construct and that show greater stability and better performance indicators are preferred20,29. A 7-item version is now available for the
BDI, which has one dimension confirmed in CFA, achieving very good fit indices (RMSEA = 0.058, and both CFI and TLI =
0.99)30. The findings encourage us to consider the reduction
of the number of items in the BDI-21 for this population29.
This study’s strength is that it involved a large sample of participants chosen at random and that it considered strict interpretation criteria for the indicators, in particular, the goodness of fit indicators. However, the study was limited in that the number of students in the possible segments did not allow for a reliable analysis.
CONCLUSIONS
We conclude that for the BDI, the one-, two- and three-di-mensional factorial solutions do not adequately adjust to the health sciences students in Santa Marta, Colombia. Care should be taken in the interpretation of BDI results for this population. This performance needs to be corroborated in another group of university students.
INDIVIDUAL CONTRIBUTIONS
Adalberto Campo-Arias – Contributed substantially to
de-sign, analysis and interpretation of data, make substantially contributed to and the drafting of the article. He also gave final approval of the version to be published.
Yuly Suárez-Colorado – Contributed substantially to
con-ception, design and interpretation of data, and to the intel-lectual content. She also gave final approval of the version to be published.
Carmen C. Caballero-Dominguez – Contributed
substan-tially to conception, design, and interpretation of data, and critically reviewed the paper for important intellectual con-tent. She also gave final approval of the version to be publi-shed.
CONFLICTS OF INTEREST
ACKNOWLEDMENTS
The University of Magdalena-Fonciencias, Santa Marta, Colombia supported the research.
REFERENCES
1. Wagner FA, González-Forteza C, Sánchez-García S, García-Peña C, Gallo JJ. Enfocando la depresión como problema de salud pública en México. Salud Mental. 2012;35:3-11. 2. Kassebaum NJ, Arora M, Barber RM, Bhutta ZA, Brown J, Carter A, et al. Global,
region-al, and national disability-adjusted life-years (DALYs) for 315 diseases and injuries and healthy life expectancy (HALE), 1990-2015: a systematic analysis for the Global Burden of Disease Study 2015. Lancet. 2016;388:1603-58.
3. O’Connor EA, Whitlock EP, Beil TL, Gaynes BN. Screening for depression in adult patients in primary care settings: a systematic evidence review. Ann Intern Med. 2009;151:793-803.
4. Sanz J, Izquierdo A, García-Vera MP. Una revisión desde la perspectiva de la validez de con-tenido de los cuestionarios, escalas e inventarios autoaplicados más utilizados en España para evaluar la depresión clínica en adultos. Psicopatol Clin Legal Forense. 2013;13:139-45. 5. Beck AT, Erbaugh J, Mendelson M, Mock J, Ward CH. An inventory for measuring
depres-sion. Arch Gen Psychiatry. 1961;4:561-71.
6. Beck AT, Steer RA, Brown GK. BDI-Fast Screen for medical patients: manual. San Antonio, TX: The Psychological Corporation; 2000.
7. Sanz J, Izquierdo A, García-Vera MP. Una revisión desde la perspectiva de la validez de con-tenido de los cuestionarios, escalas e inventarios autoaplicados más utilizados en España para evaluar la depresión clínica en adultos. Psicopatol Clin Legal Forense. 2013;13:1-54. 8. Nuevo R, Dunn G, Dowrick C, Vázquez-Barquero JL, Casey P, Dalgard OS, et al.
Cross-cul-tural equivalence of the Beck Depression Inventory: a five-country analysis from the ODIN study. J Affect Disord. 2009;114:156-62.
9. Bonicatto S, Dew AM, Soria JJ. Analysis of the psychometric properties of the Spanish ver-sion of the Beck Depresver-sion Inventory in Argentina. Psychiatry Res. 1998;79:277-85. 10. Beltrán MDC, Freyre MA, Hernández-Guzmán L. El Inventario de Depresión de Beck: su
validez en población adolescente. Ter Psicol. 2012;30:5-13.
11. Whisman MA, Perez JE, Ramel W. Factor structure of the Beck Depression Inventory – Sec-ond Edition (BDI-ii) in a student sample. J Clin Psychol. 2000;56:545-51.
12. Carranza E. Propiedades psicométricas del Inventario de Depresión de Beck universitarios de Lima. Rev Psicol. 2015;15:30-42.
13. Rodríguez A, Farjan D. Propiedades psicométricas del Inventario de Depresión de Beck en estudiantes de 5to año de secundaria de Huancayo, 2013. Rev Inv Univers. 2017;4:71-8. 14. Sanz J, García-Vera MP. Rendimiento diagnóstico y estructura factorial del Inventario de
Depresión de Beck-II (BDI-II). Ann Psicol. 2013;29:66-75.
15. Makhubela M, Debusho LK. Factorial invariance and latent mean differences of the Beck Depression Inventory – second edition (BDI-II) across gender in South African university students. J Psychol Afr. 2016;26:522-6.
16. González-Celis AL. Composición factorial del inventario de depresión de Beck en ancianos mexicanos. J Behav Health Soc Iss. 2009;1:15-28.
17. Jakšić N, Ivezić E, Jokić-Begić N, Surányi Z, Stojanović-Špehar S. Factorial and diagnostic validity of the Beck Depression Inventory-II (BDI-II) in Croatian primary health care. J Clin Psychol Med. 2013;20:311-22.
18. Oei TP, Mukhtar F. Exploratory and confirmatory factor validation and psychometric prop-erties of the Automatic Thoughts Questionnaire for Malays (ATQ-Malay) in Malaysia. Hong Kong J Psychiatry. 2008;18:92-101.
19. Keszei AP, Novak M, Streiner DL. Introduction to health measurement scales. J Psychosom Res. 2010;68:319-23.
20. Campo-Arias A, Herazo E, Oviedo HC. Análisis de factores: fundamentos para la evaluación de instrumentos de medición en salud mental. Rev Colomb Psiquiatr. 2012;41:659-71.
21. Montero I, León O. A guide for naming research studies in psychology. Int J Clin Health Psychol. 2007;7:847-62.
22. Resolución 008430. Por la cual se establecen las normas científicas, técnicas y administra-tivas para la investigación en salud. Santa Fe de Bogotá: Ministerio de salud; 1993. 23. Bartlett MS. Test of significance in factor analysis. Br J Psychol. 1950;3 77-85.
24. Kaiser HF. An index of factorial simplicity. Psychometrika. 1974;34:31-6.
25. Cronbach J. Coefficient alpha and the internal structure of test. Psychometrika. 1951;16:297-334.
26. McDonald RP. Theoretical foundations of principal factor analysis and alpha factor analysis. Br J Math Stat Psychol. 1970;23:1-21.
27. STATA 13.0. College Station: STATA; 2013.
28. Campo-Arias A, Oviedo HC. Propiedades psicométricas de una escala: la consistencia in-terna. Rev Salud Publica. 2008;10:831-9.
29. Reise SP, Waller NG, Comrey AL. Factor analysis and scale revision. Psychol Assess. 2000;12:287-97.