ROMANIAN’S SERVICES IN THE ACTUAL CONTEXT OF THE ECONOMIC CRISIS
MANIU CRISTINA,
LECTOR, ROMANIAN-AMERICAN UNIVERSITY, E-MAIL:[email protected]
MARIN PANTELESCU ANDREEA
LECTOR, BUCHAREST UNIVERSITY OF ECONOMIC STUDIES,
E-MAIL:[email protected]
Abstract
The globalization of the economic processes and phenomena triggered a whole chain of global economic transformations that have led to the development of nations. Interdependencies established in this area are aimed at increasing the competitiveness of products and services in international markets. The present paper proposes is to highlight the impact generated by the economic crisis over the Romanian’s services. A deep research of the statistical data from the National Institute of Statistics has been undertaken reflecting the evolution of the main indicators of the service sector in Romania.
Key words: services, international commerce, liberalization, competitiveness
Classification JEL : O10, L8, L80
1.
Introduction
One of the reasons for which many companies have shifted to service sector activity is the increase, as a percentage of GDP, represented by the services sector domination in most developed economies, and the apparent decline in material production. Services contribute to a more efficient use of human, material and financial resources, and satisfying the needs of the population and society at large. It also stimulates growth, renewal and diversification of production of material goods and provides conditions for facilitating the process of distribution and consumption.
Following the development of services, with the increase of economic and social efficiency of labor, and with more efficient use of working time and leisure, better conditions are ensured for training, both culturally and scientifically of society members, along with optimizing public health.
The period of the global economic crisis led to a highlight of the weaknesses of our economies, but also a number of opportunities that Romania could exploit in the future.
Strong developments of new computer technology and telecommunications modernization trigger multiple supply options, returning the key role to services. This juncture opens the perspective of a shift to strategic management of services involving improving, training and qualification of workforce in this sector.
The key features of globalization which includes the services sector target high technology, capital investment, management and marketing performance.
The globalization of services, generated by using modern technology, has led to a quantitative growth but also a qualitative leap in the development of services.
According to the opinion of specialists, the globalization determines a strong increase of competition between business partners in services, for conquest of known market segments targeted by the offer and to conquer new segments.
Despite all, the globalization phenomenon should not lead either to the elimination of each company’s local
specifics and of the area differences, or to the developed countries’ policy to enforce their own success models, but, on the contrary, this phenomenon should trigger the integration of the differences into a common model to be applied at the world – wide level, model whose main goal would consist in obtaining success (Ionescu, Dumitru, 2012).
Increasing competition is the result of new technologies, the rapid exchange of information in the globalized market. Thus, along with the advantage of market information, which involves speculating information on supply and demand of goods or services in a particular area, the quality’s advantage is undeniable. Survival and success depends on how quickly companies adapt to changing conditions and the ability to offer products especially quality services at reasonable prices.
2.
The evolution of the main indicators for the Romanian service sector
companies offering services to identify determinant factors of their quality and service expectations of customers making use of these types of firms and the assessment of services by the customers.
Meeting the needs of large social segments in Romania, generates a set of processes and relationships that print services features a distinct field of activity which must be constantly adapted to changes in economic and social life in close relation with other areas of the economy, due to the complexity and dynamism of this phenomenon more and more specific to modern civilization.
The evolution of services in Romania is justified by the increase in the components, which include: market services rendered mainly to the population, market services provided mainly to operators, transport services, storage and communications.
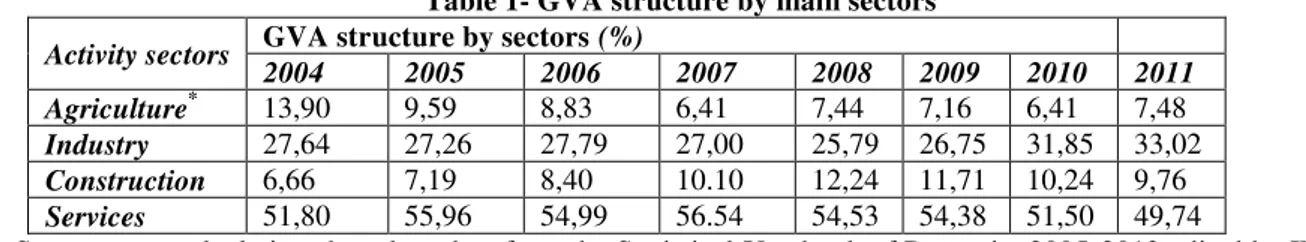
A method for assessing economic performance in services is the sectors and sub-sectors distribution of value added. Added value growth, expressed in constant prices, provides information about the dynamics of service activities, their maturity, their speed and direction of structural change and competitiveness. In Romania, the contribution of services activities to gross value added is increasing, reaching 56.54% in 2007.
Table 1- GVA structure by main sectors
Activity sectors GVA structure by sectors (%)
2004 2005 2006 2007 2008 2009 2010 2011 Agriculture* 13,90 9,59 8,83 6,41 7,44 7,16 6,41 7,48
Industry 27,64 27,26 27,79 27,00 25,79 26,75 31,85 33,02
Construction 6,66 7,19 8,40 10.10 12,24 11,71 10,24 9,76
Services 51,80 55,96 54,99 56.54 54,53 54,38 51,50 49,74
Source: own calculations based on data from the Statistical Yearbook of Romania, 2005-2012 edited by INS, Bucharest
Note: * agriculture sector includes hunting, forestry, fishing and fish farming
In recent years, under the impact of the economic crisis, the added value in services fell, so in 2011 it reached 242,396.9 million Lei in current prices.
Analysis of sector interdependence in terms of GVA formation (Table 1) starts from the consideration that the services include activities such as: trade, hotels and restaurants, transport, storage and communication, financial intermediation, real estate, renting and business activities to enterprises, government and defense, education, health and social assistance, financial intermediation services indirectly measured. In 2011, services contribution to the formation of GVA was lower compared to previous years which correspond to shares exceeding 50% of total GVA.
Figure 1: Structure of GVA per key sectors
Closely related to GVA is the gross domestic product (GDP), compared to which the percentage of contribution was established in services and other sectors.
Service sector contribution to GDP is significantly higher compared to the other sectors, which highlights the important role it occupies in the Romanian economy. Constant growth of the contribution of services to GDP creation, of employment and the expansion of trade flows and international investment is the result of globalization and regional integration intake and liberalization of international trade.
Table 2 - Share of major sectors in GDP
Construction 5,95 6,35 7,43 8,95 10,91 10,54 9,12 8,54
Services 46,23 49,42 48,54 50,13 59,49 58,94 56,80 56
Source: own calculations based on data from the Statistical Yearbook of Romania, 2005-2012 edited by INS Note: * agriculture sector includes hunting, forestry, fishing and fish farming
The contribution of the four sectors shown in Table 2 to GDP follows the same trend as in the GVA. Industry and agriculture have contributed consistently from one year to the other to the national GDP. This is reflected by the percentage values of 28.37% for the industry in 2010 and 5.71% for agriculture, respectively 28.91 percent% and 6.55% in 2011. Declines in construction and services sectors shows that, at the end of 2007, the global economy was heading rushed to the deepest crisis of the postwar period. This was initially started as a financial crisis, and later turned into a generalized economic recession. Increasing requirements regarding construction of residential and economy spaces are an essential argument outlining weights up from 5.95% in 2004 to 10.91% in 2008, reflecting the contribution of the construction sector in the GDP. Since 2009 the situation varies significantly from one country to another and from one sub-sector to another, but there are some general trends: banks do not lend easily and construction companies are facing financial difficulties, the new housing construction was limited due to the lack of confidence in future market prospects.
Since service sector activity is directly linked to the human factor, it is noted the need to address a third indicator to assess the size of this sector employment.
Until 2002 the dominant sector in terms of labor employed was the industry, holding a maximum contribution of 41.43% in 2000. Gradually, structural changes in the economy have led to a shift of population from the industry, which has experienced a process of privatization and technological improvements, which led to the abolition of many jobs to other sectors, especially for construction and services, corresponding weights increased from 2000 to 2009, which means that the job offers were able to attract more labor.
Based on data on employment in each sector we could determine the weight of each indicator in the overall analysis (Table 3).
Table 3 - Structure of employment by major sectors
Activity sectors
Structure of employment by major sectors
2004 2005 2006 2007 2008 2009 2010 Agriculture 24,91 23,51 30,50 30,33 29,55 30,11 31,63
Industry 32,02 31,92 24,54 23,80 23,68 21,87 21,10
Construction 5,09 5,52 5,77 7,07 7.83 7,89 7,66
Services 37,98 39,05 39,19 38,81 38,94 40,13 39,61
Source: own calculations based on data from the Statistical Yearbook of Romania, 2005-2012 edited by INS, Bucharest
Note: * agriculture sector includes hunting, forestry, fishing and fish farming
This increase is the result of the efforts of those involved in the development of service activities in order to provide services that satisfy consumers in a greater measure than their requirements. Structural changes experienced by the four sectors and comparing their contributions to the working population in the year 2010 to 2004 indicates that, currently, Romania is geared towards developing quite well the service sector and agriculture which today are essential components in the sustainable and global development of a modern economy engaged in the global economy. Evolution of market services in Romania is considered nationally between 2004 and 2011, or by comparison with other sectors or types of activity or ownership.
Figure 2: Evolution of market services in Romania
Established trend, we show the overall growth of market services in Romania, during the analysis, as a result of concerns directed towards implementation of economic reforms, to accelerate privatization and especially towards the integration of Romania in plans aimed at globalization and liberalization of trade in services.
Types of services include income market, so companies that have their main activity services and enterprises with main activities which receive income from service activities.
The three categories of services that are part services market in Romania know the period 2008-2011 a growing trend, as shown in figure 3 as:
- Market services mainly rendered to the population registered an average decrease of 264.3 million RON in the period 2008-2011, in the years 2009 and 2010 these having the lowest values of the period.
- Market services provided primarily for economic operators registered a positive trend, increasing an average of 5392.6 million lei current prices, the lowest level recorded at the level of 2009 (154458.2 million lei current prices) ; - Services of transport, storage and communication presents a development close of the second category, ie an increase by an average of 2776.27 million lei current prices. These services have the lowest values recorded in the year 2009, namely 70694.3 million lei current prices.
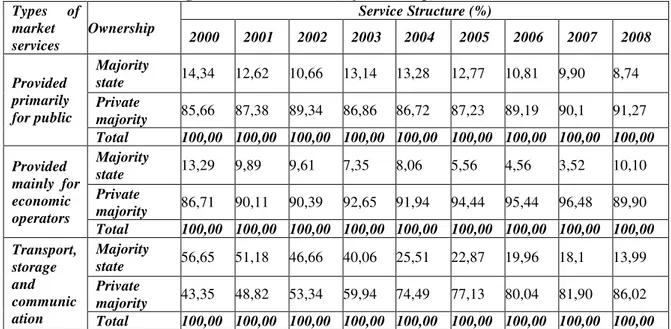
A structural analysis of market services mainly rendered to population, economic operators and the transport, storage, communication, studied by ownership, in 2000-2008 can highlight their evolutionary fluctuations on the two forms of ownership : major state and private (Table 6).
Table 4 - Structure of market services mainly rendered to population, economic operators and transport, storage and communications, by ownership, in 2000-2008
Types of market services
Ownership
Service Structure (%)
2000 2001 2002 2003 2004 2005 2006 2007 2008
Provided primarily for public
Majority
state 14,34 12,62 10,66 13,14 13,28 12,77 10,81 9,90 8,74 Private
majority 85,66 87,38 89,34 86,86 86,72 87,23 89,19 90,1 91,27 Total 100,00 100,00 100,00 100,00 100,00 100,00 100,00 100,00 100,00
Provided mainly for economic operators
Majority
state 13,29 9,89 9,61 7,35 8,06 5,56 4,56 3,52 10,10 Private
majority 86,71 90,11 90,39 92,65 91,94 94,44 95,44 96,48 89,90 Total 100,00 100,00 100,00 100,00 100,00 100,00 100,00 100,00 100,00 Transport,
storage and communic ation
Majority
state 56,65 51,18 46,66 40,06 25,51 22,87 19,96 18,1 13,99 Private
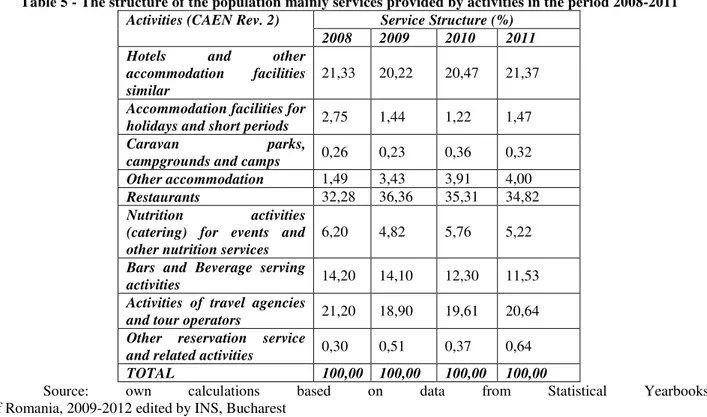
communications were mostly state share exceeding 50%, gradually due to inherent changes took place in these areas in the expansion of the privatization process is reached that in 2008, private sector return to 86.02%. Market services mainly rendered to the population, according to the National Classification of Economic Activities (NACE), include the following activities: hotels and restaurants, travel agencies, rental of personal property; photographic activities, secretarial activities, recreational activities, other personal service activities. These types of services include a variety of acts of great diversity, designed to meet a variety of needs of the people, thus fostering the development of human personality. They include activities that are provided to the population, cost, market relations system, through the sale documents.
Table 5 - The structure of the population mainly services provided by activities in the period 2008-2011
Activities (CAEN Rev. 2) Service Structure (%) 2008 2009 2010 2011 Hotels and other
accommodation facilities similar
21,33 20,22 20,47 21,37
Accommodation facilities for
holidays and short periods 2,75 1,44 1,22 1,47 Caravan parks,
campgrounds and camps 0,26 0,23 0,36 0,32 Other accommodation 1,49 3,43 3,91 4,00
Restaurants 32,28 36,36 35,31 34,82
Nutrition activities (catering) for events and other nutrition services
6,20 4,82 5,76 5,22
Bars and Beverage serving
activities 14,20 14,10 12,30 11,53 Activities of travel agencies
and tour operators 21,20 18,90 19,61 20,64 Other reservation service
and related activities 0,30 0,51 0,37 0,64 TOTAL 100,00 100,00 100,00 100,00
Source: own calculations based on data from Statistical Yearbooks
of Romania, 2009-2012 edited by INS, Bucharest
In the figure bellow, it can be noticed that the most representative shares belong to hotels, travel agencies and restaurants, having values between 32,28% in 2008 and up to 36,36% in 2009. The next main service is represented by travel agencies and travel assistance, with shares between 18, 90% and 21, 20%.
The Romanian tourism sector was affected by the economical recession. In order to survive on the market, traveling agencies and tour operators were forced to make use of great discounts in order to attract customers, as the interest of the latter was declining rapidly.
While other activities have shares of 4,45% to 6,54%, from the total of services provided to the population, the lowest contribution is accounted by: holiday and short term accommodation services, other accommodation services, other reservation services and tourism assistance with shares of only 0,3% and 3,91%.
Note: H- hotels and accommodation facilities similar to hotels. HSTA holiday and short term accommodation
C.T.P.C – camping, trailer parks and camps O Ac S - other accommodation services R- Restaurants
E- events catering and other public alimentation services B- Bars and other beverage serving activities.
Ac T.A. &T.O.- activities of travel agencies and tour operators O R & T As S - Other reservations and tourism assistance services
Establishing the structure of the provided services to the population, based on activities as well as on ownership, led to the conclusion that the highest shares belong to privately owned units.
Privately owned units are associated with lower rates, which vary between 49,93% and 77,06%, for the units performing radio, television, sports and other recreational activities while for the rest of units, the proportion is close to 80%.
Most of the activities included in the services provided, have reached a positive evolution in 2011 in comparison to 2010.
Business to business services include, according to the Classification of Economic Activities in the National economy, activities such as:
- Real estate transactions
- Car and no-operator equipments rental - IT services
- Research and development
- Legal, accounting and audit services
- Architecture, engineering and other technical consultancy
- Advertisement
- Sanitation and garbage collection
- Other services
Diversifying services for traders, the impossibility of separating them as a result of their incorporation in a significant proportion into the final products, make difficult to analyze and assess these types of services.
In the process of establishing the structure of the services provided mainly for economic operators, by activity, during 2008-2011 we can observe the high contribution of “Real estate transactions”. This category has the highest proportion, 14,6%, as revealed due to the dynamic of the real estate demand, occasionally increased by the negative hearsays concerning the housing sector, once Romania entered the European Union, which will gradually decrease throughout the years, reaching 13,82% in 2011.
It is worth noticing the increasing percentage changes from one year to another, recorded by "Active management and management consulting" which from 10.98% in 2008, will reach in 2010 a percentage value of 11.08%. The demand for consulting services is determined by a number of factors, the economic situation of the markets but also the degree of customer education as the most important elements.
The lowest values were recorded by the following activities, “film production activities, video and television programs production; sound recording and music publishing activities", "broadcast activities ", "IT activities", "other professional, scientific and technical activities” and “research and development activities”.
Tabel 6 Structure of services provided mainly for economic operators, by activities 2008-2011
Broadcasting activities 2,76 2,75 2,47 2,14
Information technology activities 8,22 8,45 9,98 9,97
Information service activities 1,12 1,27 1,20 1,31
Real estate 14,60 15,67 14,48 13,82
Legal and accounting activities 2,88 2,44 2,28 2,18
Management and management
consoulting activities 10,98 11,03 11,08 10,91 Architectural and engineering
activities, technical analysis and testing activities
11,76 11,64 10,68 11,81
Research and Development 2,25 1,93 2,15 1,91
Advertising and market research
activities 12,07 10,48 9,70 9,50 Other professional, scientific and
technical activities 1,21 1,23 1,32 2,07 Veterinary activities 0,31 0,41 0,37 0,41
Renting and leasing activities 2,52 2,82 3,07 3,02
Service activities concerning
workforce 1,45 1,49 1,89 2,24 Investigation and protection
activities 3,61 4,20 4,10 3,96 Cleaning activities 1,95 1,97 2,30 2,48
Office administrative, support services and other services activities provided mainly to enterprises
5,65 5,38 5,90 6,06
Other Services (creative activities and artistic interpretation, libraries, museums, gambling and betting activities, amusement and recreational sports activities, computer service, personal and household articles, other service activities)
10,44 10,79 11,00 10,73
TOTAL 100,00 100,00 100,00 100,00
Source: own calculations based on data from Statistical Yearbooks of Romania 2009-2012 published by INS, Bucharest
If in 2000 and 2001 is the contribution of research and development is not significant, since 2002 the situation is measured separately in an integrated activity. Although, in terms of value records in absolute terms the entries are increasing until 2006 however the research and development activity in relation to the others evolved quite constantly, but with a slight decline, placing shares between 2.25 % (2008) and 1.91% (2011).
Accounting services market is influenced in the current period by the effects of economic crisis, but also as a number of other issues such as unfair competition and in excess regulation.
Figure 4 Percentage of services for operators on activities, 2008-2011
Note: A.E.- editing activities; C.V.T.- film production, video and tv program activities; A.D.P- program broadcast activities; T.I.-information technology service activities Sv.I.-information service activities;Tz.I – real estate;A.J-legal and accounting activities; MCm-management and consulting amanagement; A.I- arhitectural and enegenering, technical and testing analysis activities; CD-research and development; P- advertising and market research; Alte activ.PST- other professional, scientific and technical activities; A.V.- veterinary activities; A.I.L.-renting and leasing activities; Sv.F.M.-Service workforce activities; I.P.-Investigation and protection activities; Av.C.-Cleaning activities;Av.S.- office administrative, office suport and other bussines activities; Alte Sv.- other servicies.
The structure of market services rendered in principal for the traders, established both in activities and ownership, in 2000-2007, follows the same trend as that the services provided primarily for public. Justification is oriented in the same direction in the sense that, most services are related to the private sector, as a necessity of their activities on the same coordinates of globalization and sustainable development services.
Distinct branch in most countries, transport is one side of the business that brings important changes in social and economic life of any country. Growing needs of individuals to travel and communicate have increased transports role in the economy. Developing domestic and international trade including the formation and evolution of national and global markets has been possible by the development of transport, increasing its role and its importance in modern society.
Also, you can not talk about globalization of the economy without mentioning the primary role in the penetration of information at all levels, from local, national to the international.
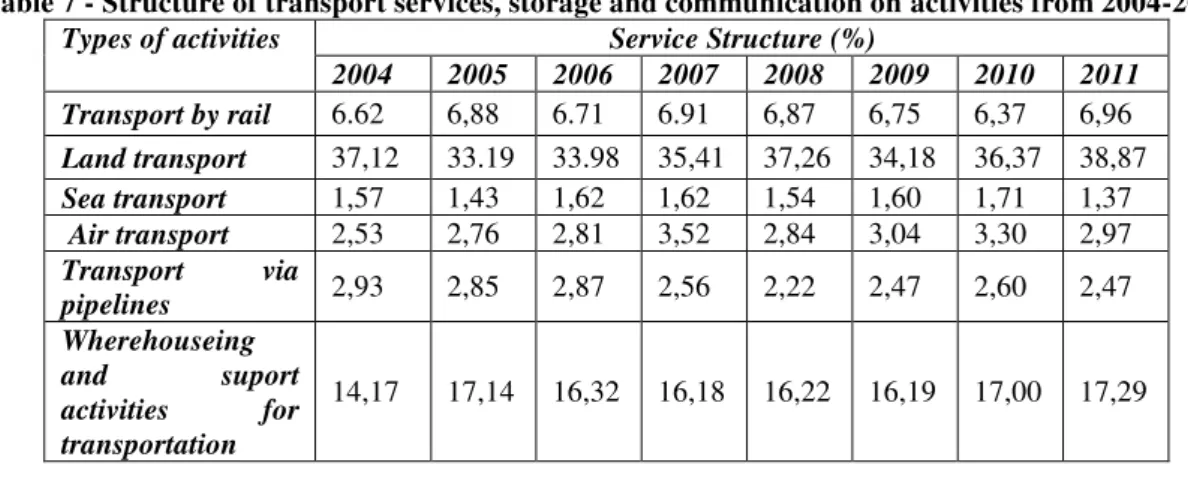
Revolutionary changes in telecommunications in recent years through the emergence and rapid expansion of mobile telephony, its interface with the fixed one and the Internet, leads to a strong expansion of services with profound implications on economic growth. Communications is today for Romania, as for most countries, a strategic sector for the national economy. The main types of activities included in transport services, storage and communications are: land transport, water transport, air transport, transport via pipelines, supporting and auxiliary transport activities; postal and courier, telecommunications.
Information relating to transport, storage and communications activities from 2004-2011 are revealed that there is a structure shown in Table 7.
Table 7 - Structure of transport services, storage and communication on activities from 2004-2011
Types of activities Service Structure (%)
2004 2005 2006 2007 2008 2009 2010 2011 Transport by rail 6.62 6,88 6.71 6.91 6,87 6,75 6,37 6,96
Land transport 37,12 33.19 33.98 35,41 37,26 34,18 36,37 38,87
Sea transport 1,57 1,43 1,62 1,62 1,54 1,60 1,71 1,37
Air transport 2,53 2,76 2,81 3,52 2,84 3,04 3,30 2,97
Transport via
Post and curier 2,40 2,70 2,64 3,16 3,50 3,73 3,80 3,63
Telecomuncations 32,66 32,75 33,05 30,64 29,56 32,06 28,88 26,45
TOTAL 100,00 100,00 100,00 100,00 100,00 100,00 100,00 100,00
Source: own calculations based on data from Statistical Yearbooks of Romania, 2005-2012 edited by INS, Bucharest
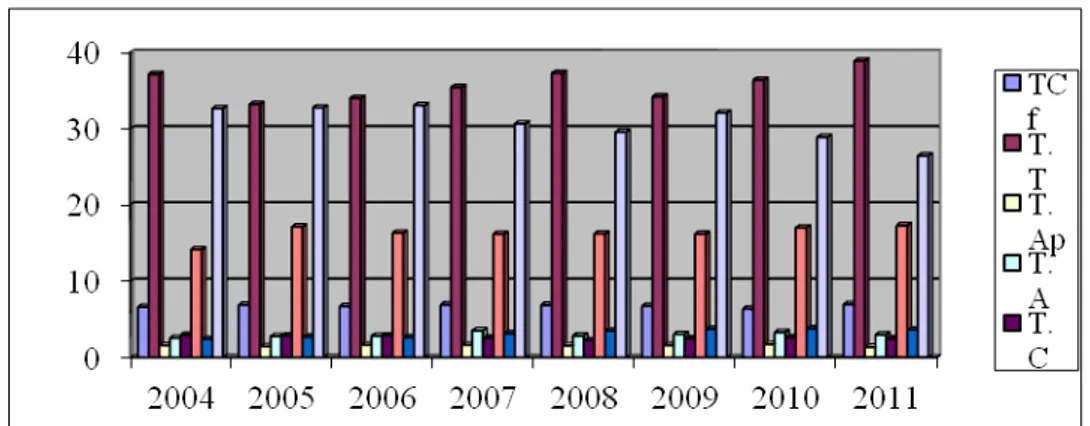
Between 2004 and 2011 the structural changes made to the activities that make up the services of transport, storage and communications are relatively small.
Significant contribution have the land transports with oscillating weights witch slightly increase from one year to another, ranging from 33.19% (2005) and 38.87% (2011). At a relative distance telecommunications contribution is quite significant whose increase in value is reflected in an increase in the minimum percentage of 28.46% in 2001 to 32.06% in 2009 corresponding weights other years, oscillating between them. Third is storage activities and support activities for transportation whose weights are between 14.17% (2004) and 17.29% (2011), which confirms the need for more dynamic processes related to transport activities in all forms and matters arising in practice.
“Other” incumbent insignificant weights, ranging only between 1.37% and 6.96% compared with other categories of activities listed (figure 5).
Figure 5 Share of transport services, storage and communication on activities, 2004-2011
Note: T.Cf- rallway transport; T.T-land transport; T.Ap-sea transport; T.A-air transport; T.C-transport via pipelines; D.A.T-warehousing and support activities for transportation; P.C-mail and courier; Tel.-telecomunications.
It is noted that the process of privatization activities in this category is quite low, compared to the other types of categories previously analyzed.
In this context it is shown that, the state sector recorded significant fluctuations in terms of pipeline transport and telecommunications.
If pipeline transport remains under government coordination because they are the least privatized to date. The financial problems are what caused units to stop these activities to be privatized, the state being better able to intervene in all respects in ensuring that and higher quality standards for this type of this service activities.
Land transport, telephony and other ancillary and related transport are the service categories that have experienced the highest level of privatization in the transport, storage and communications section.
5. Conclusions
For many countries, the year 2009 was entering recession. Romania is also affected by the world’s economic
crisis, and the effects are felt in all fields. In 2010, in our country, the decline of GDP was 1.6%, primarily due to the effects of the financial-economical crisis. In 2011, there has been a revival of the economy, GDP grew by 2.5%.
In 2011, services contribution to the formation of GVA, was lower compared to previous years, wich correspond shares exceed 50% of total GVA.
The four sectors contribution to GDP, follows the same trend as GVA, services contributing in 2010 with 56,8%, and in 2011 with 56%.
Significant increases were also recorded in telecommunications. A very important aspect in the Romanian’s services field is that the share of the private sector has increased generating new jobs and future prosperity.
6. Bibliography
[1] Abbott, Frederick M. - A New Dominant Trade Species Emerges: Is Bilateralism a Threat?, Journal of International Economic Law, 10(3), 571-583, Oxford University Press, Oxford, 2007
[2] Arnold, Jens, Boutheina, Guermazi and Aaditya, Mattoo - "Telecommunications: The Persistence of Monopoly", in Aaditya Mattoo and Lucy Payton (eds), Services Trade and Development - The Experience of Zambia, World Bank, Washington, 2007
[3] Baker, P., Miozzo, M. and Miles, I. - The Internationalization of European Services: What Can Data on
International Services Tell Us?, în Miozzo, M. and Miles, I., (ed.): Internationalization, Technology and Services, Edward Elgar Publishing, Williston, 2003
[4] Cartas, Maria - Industria informaţiei şi comunicaţiilor în perspectiva integrării în UE, Ed. Centrul de Informare şi
Documentare Economică, Bucureşti, 2003
[5] Cerchez, Octavia –Eficienţa economică a comerţului exterior, Ed. Logos, Bucureşti, 2007
[6] Ciochină, Iuliana, Iordache, Maria Carmen, Decuseara, R. - Îmbunătăţirea calităţii produselor în contextul
extinderii procesului de globalizare , în Culegerea de lucrări a Simpozionului "Marfă-Calitate-Globalizare" organizat de
Academia de Studii Economice Bucureşti, Facultatea de Comerţ, Ed.ASE, Bucureşti, 2004
[7] Coroi, M. – Globalizarea economiei sub semnul convergenţei de interese, Ed. ASE, Bucureşti, 2006
[8] Ionescu Alexandru, Dumitru Nicoleta, Multinational companies under the globalization context, Romanian
Economic And Business Review, martie 2012, volumul 7, numărul 1, ISSN-1842-2497, pg.86-95
[9] Maniu, Laura-Cristina, Gogonea, Rodica-Manuela – The Prospect of the Telecommunications Services in Romania within the Context of Integration in the European Union, MIPRO 2008 (31st International Convention on Information and Communication Technology, Electronics and Microelectronics), vol.II, Opatija, Croaţia, 2008
[10] Mann, Catherine.L.- Globalization of IT Services and White Collar Jobs: The Next Wave of Productivity Growth, Institute for International Economics, International Economics Briefing Paper No 19, March 17, Washington, 2004