Applied Physics Laboratory, University of Washington, Seattle, WA, 98195 USA
4Atmospheric Physics Institute, National Research Council of Italy, 00044 Frascatti, Italy
Received: 28 April 2008 – Revised: 24 July 2008 – Accepted: 20 September 2008 – Published: 4 February 2009
Abstract. Satellites carrying X-band Synthetic Aperture Radars (SAR) have recently been launched by several coun-tries. These provide new opportunities to measure precipita-tion with higher spatial resoluprecipita-tion than has heretofore been possible. Two algorithms to retrieve precipitation from such measurements over land have been developed, and the re-trieved rainfall distributions were found to be consistent. A maritime rainfall distribution obtained from dual frequency (X and C-band) data was used to compute the Differential Polarized Phase Shift. The computed Differential Polarized Phase Shift compared well with the value measured from space. Finally, we show a comparison between a recent X-band SAR image of a precipitation distribution and an ob-servation of the same rainfall from ground-based operational weather radar. Although no quantitative comparison of re-trieved and conventional rainfall distributions could be made with the available data at this time, the results presented here point the way to such comparisons.
1 Introduction
Global precipitation measurements are needed by weather forecasters and climate modelers because the release of la-tent heating has a profound effect on the performance of such models. With the improvement in computer capabil-ity, forecast models will be able to operate with more real-istic physics, and with higher spatial and temporal resolu-tion, Randall (2006). The Japanese Earth Simulator is al-ready being run globally with∼10 km horizontal resolution, Ohfuchi et al. (2007). Several mesoscale models are now running operationally with less than 4 km horizontal
resolu-Correspondence to:J. A. Weinman (jim [email protected])
tion, and Chen et al. (2007) showed that mesoscale models with 1.67 km resolution were needed to resolve the inner core structure of hurricanes.
Since the 1980s much of our understanding of global oceanic precipitation has come from space-borne passive mi-crowave radiometers. Space-borne mimi-crowave radiometers have spatial resolution in excess of 10 km. Detailed observa-tions of hurricanes over oceans are obscured by that limita-tion.
Microwave radiometric measurements of rainfall over land rely on the scattering properties of ice in the upper regions of precipitating clouds. However Bennartz and Petty (2001) showed that the relationship between surface rainfall rates and the scattering properties of frozen hydrometeors is prob-lematic.
These limitations can be mitigated by space-borne radars. The Precipitation Radar (PR) aboard the Tropical Rain-fall Measurement Mission (TRMM) satellite has provided unique precipitation measurements as demonstrated by Kum-merow et al. (2000), but even the 4 km horizontal resolution, and the Signal/Noise Ratio (SNR) floor of the PR may inhibit the measurement of compact rain cells, Durden et al. (1998). C-band and L-band (∼5 and ∼21 cm wavelengths, re-spectively) Synthetic Aperture Radars (SAR)s have a long heritage of Earth observation with high spatial resolution. However such radars are insensitive to rainfall in the at-mosphere. Atlas and Moore (1987), Jameson et al. (1997), Moore et al. (1997) Melsheimer et al. (1998) and Alpers and Melsheimer (2004) showed that SARs operating at the shorter wavelength X-band (∼3 cm wavelength) could detect rainfall. With∼100 m resolution, X-band Synthetic Aperture Radars (X-SARs) can provide new insights into the structure of precipitating clouds.
Fig. 1.Left: View around Noakhali, Bangladesh (22.8◦N×91.2◦E) on 7 October 1994 with no rain present. Right: Same scene on 18 April 1994. Note scattering by frozen hydrometeors in the upper right, scattering and attenuation by rain in middle-lower right, and absorption mainly by rain with little ice in the lower left. The maximum NRCS of the scattered signal is∼−3 dB and the minimum NRCS value in the shaded area is∼−30 dB.
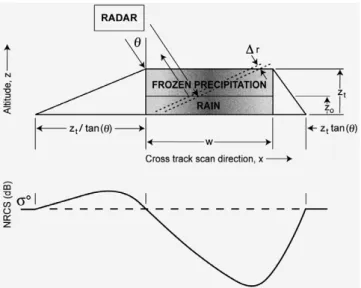
Fig. 2. Upper: Schematic view of the model used to compute the NRCS from a horizontally variable two layer precipitating cloud. Lower: Schematic NRCS (dB) as a function of cross-track scanning distance (km) showing enhanced values on the left of the cross-over point caused by scattering from the cloud top and attenuation from rain in the lower cloud on the right. The background NRCS isσ0.
along with a C-SAR, Jordan et al. (1995). Examples of such data are shown in Fig. 1.
The years following 2007 have provided new opportuni-ties to measure rainfall distributions from X-SARs. Three of four CosmoSkyMed satellites have already been launched,
and the last one will be launched in 2009, Caltagirone et al. (2007). The TerraSAR-X was also launched in 2007, Buckreuss et al. (2003), and TecSAR was successfully launched in January 2008, Sharay and Naftaly (2006). A dual frequency, X and Ku-band SAR has been approved for development by ESA, Rott et al. (2007). Table 1 summarizes some features of the X-SAR systems that will operate during the coming decade.
2 The normalized radar cross section model
Figure 2 shows a schematic view of a cloud scanned from the left by an X-SAR. The surface cross section isσo. The vertical direction is z, and the cross track scan direction is x, whose origin may be set at a distancezt/tanθto the left of the
precipitation, wherezt designates the top of the cloud. The
propagation vectors are depicted as solid lines. The propa-gation direction is oriented at an angle,θ, from nadir. The scattering volume is bounded by the dashed lines that are or-thogonal to the propagation direction.
VH, VV 15 Jun 2007
TecSAR HH, HV 20 550 4–8 yrs
VH, VV 21 Jan 2008
Kompsat-5 HH, HV 100 20 685 5 yrs
VH,VV 2009 start
CoRe-H2O VV, VH >100 25×9 30–40 5 yrs
Dual Frequency TBD
With 17.2 GHz
The NRCS,σSAR, consists of two parts: namely scattering
from the surface, σsrf, and scattering by the precipitation,
σvol, such that:
σSAR=σsrf+σvol
where
σsrf(x)=σ0(x)e −2
x
R
x−zttanθ
k(x”)sindx”θ
σvol(x)=sinθ
x+zt/tanθ
R
x
η(x′)e −2
x′
R
x′−X(x′,θ )
k(x”)sindx”θ dx′ cosθ
The projection of the propagation vector onto the cross track direction is designatedx”, and the projection along the cross track direction of the vector defining the scattering volume is x′. It follows that
x′−x′′=(z′′−z′)tanθ z′=(x′−x)tanθ. and
X(x, θ )=x′+(x′−x)tan2θ−zttanθ.
Attenuation takes place along the propagation path with a coefficient represented by,k=aRb(km−1). The volumetric scattering occurs within a slice of oblique thickness1r in the direction perpendicular to the propagation path from the radar. The reflectivity within the volume element,η(km−1), in terms of wavelength,λ(cm), is
η=10−5π
5|K|2
λ4 Ze
and the attenuation corrected effective radar reflectivity fac-tor isZe=cRd.
Numerous types of hydrometeors, characterized by the rainfall rate, R (mm/h), may occur within precipitating clouds, and they contribute differently toηandk. Thusa, b,c, andd are constants that depend on the phase, density, and size distribution of the hydrometeors. They can initially be given a priori values, as is done for computations of con-ventional single frequency radar returns.
3 Model precipitation distributions
The model rainfall rate distributions, R(x, z), were repre-sented in the form,
R(x, z)=H (x)V (z)
as in Marzano et al. (2006), Weinman and Marzano (2008), and by Marzano and Weinman (2008).
The vertical distributions V (z)= V (z0){(zt−z)/(zt−z0)}
0.25 for z 0≤z≤zt
V (0){0.85+0.15[(z0−z)/z0]0.5}for 0≤z≤z0
were representations extracted from Contoured Frequency by Altitude Diagrams (CFAD) found by Yuter and Houze (1995). The snow cloud top heights were zt. The
freez-ing level heights,z0, could be determined from surface
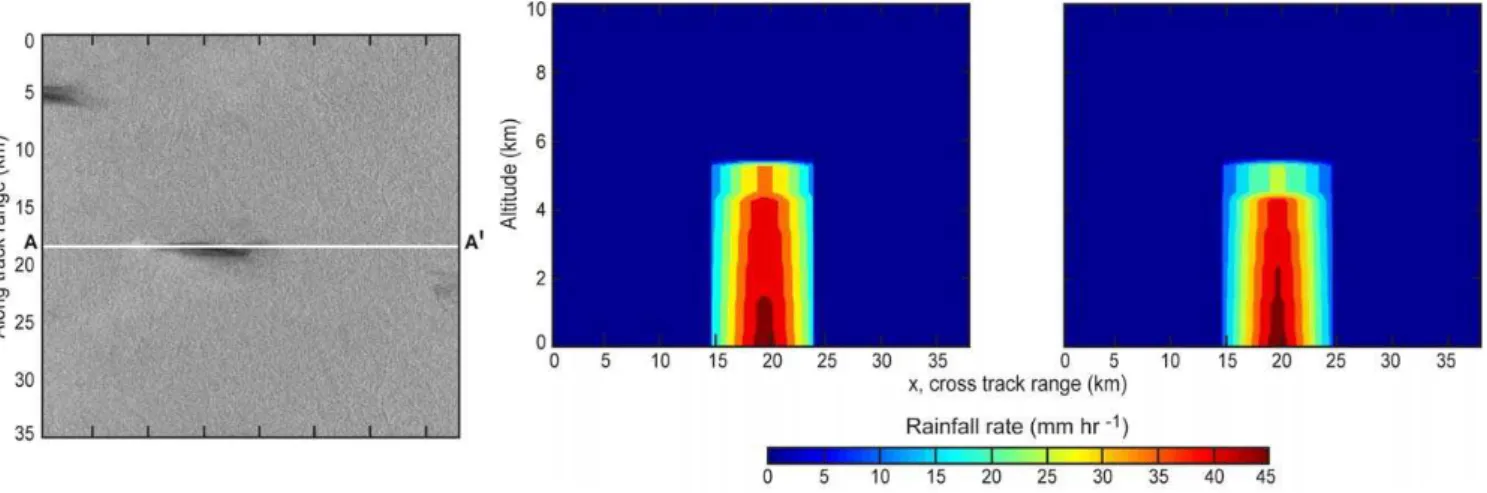
Fig. 3. Left: X-SAR image of an isolated convective cell over Amazonas, Brazil (9.01◦S×68.38◦W) obtained at 18:45 UTC on 15 April 1994. The X-SAR viewed this scene from the left and the satellite passed from the top of the scene to the bottom. Center: The rainfall rate distribution,R(x, z), along the transectA−A′retrieved by the statistical algorithm, and right: that retrieved by the VIE solution.
The horizontal distributions, H (x), were the most vari-able, and they were derived from two distinct algorithms.
4 Precipitation retrieval algorithms over homogeneous land
Two separate retrieval algorithms were developed to infer R(x, z). One was statistical and the other was an analytical solution to the Volterra Integral Equation (VIE) of the second kind.
Briefly summarized, the statistical algorithm described in Marzano and Weinman (2008) and Weinman and Marzano (2008) finds a crossing node,xo, where the NRCS makes a
transition from enhancement due to scattering to reduction due to attenuation. The algorithm then relates moments of theH (x)to moments of the NRCS aboutxo. It also
deter-mines NRCS gradients at several locations. Eleven parame-ters thus comprise components of a vector,xSAR. The shape
ofH (x)is obtained by minimizing the quantity d(cH)=(xSAR−mSAR)∗C−1
CSAR(xSAR−mSAR)
where the subscriptCidentifies the cloud shape class, andm
is the vector of the mean parameters. The asterisk represents the transpose of a vector, andCCSARis the covariance matrix
of the population of model clouds.
The VIE retrieval algorithm was first described in Pichugin and Spiridonov (1991). The NRCS equation presented at the beginning of this paper was transformed, by a series of alge-braic manipulations, to a form:
P (x)=f (x)+λ
x
Z
x∗
K(x, t )P (t )dt
whereP(. . . )is the transformed function ofH (x), andK(x,t),
f(x)andλare transformations of clusters of various
param-eters that appear in the NRCS formulation. The reader is referred to Pichugin and Spiridonov (1991) and to Marzano and Weinman (2008) for a comprehensive description of this method.
An X-band image of a convective cell in the Amazon is shown in Fig. 3 (left) along with the retrievedR(x, z) dis-tributions (center and right) obtained from the statistical and VIE retrieval algorithms respectively. Although no indepen-dent validation was available, the agreement between the two results is reasonably consistent.
5 Dual frequency precipitation retrieval over an inho-mogeneous sea surface
The determination of rainfall over a sea surface is more dif-ficult than over land because sea surface NRCS values are highly variable, and that variability is related to the rainfall rate. The wind field that roughens the sea surface around precipitating clouds, and the impinging raindrops that damp surface waves complicate the sea surface structure. Exam-ples of sea surface roughness patterns around precipitation observed by C-band SARs (C-SARs) are shown in Alpers and Melsheimer (2004).
Fig.3
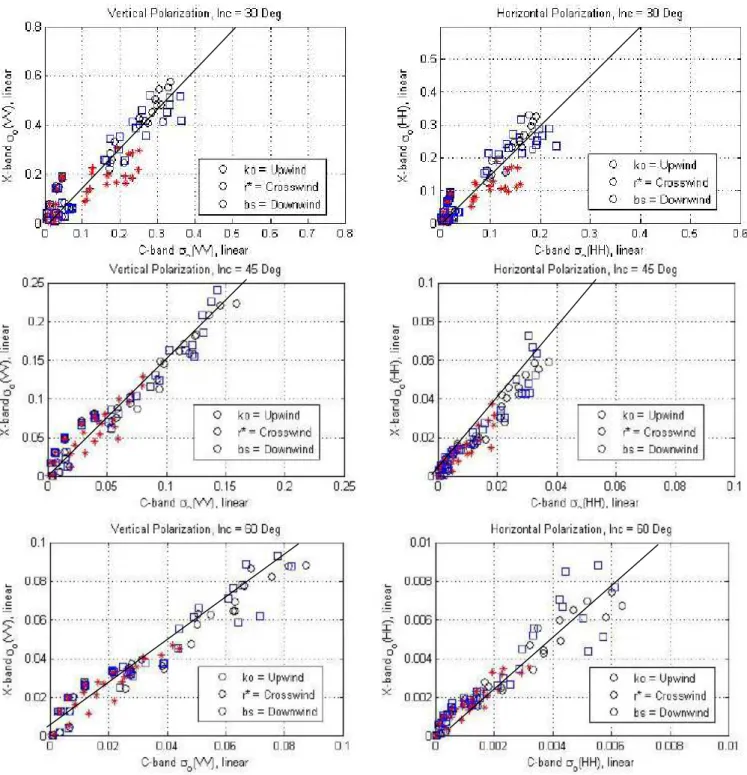
Fig. 4. Comparison between modelσ0C andσ0Xat VV and HH polarization for wind roughened and rain impacted sea surfaces. Black (o), red (*) and blue () represent up-wind, cross-wind and down-wind computations respectively. The left and right columns present the relations among the VV and HH polarizedσorespectively. The cross section model of Contreras and Plant (2006) was used to model various combinations ofR=0, 5, 10, and 40 mm/h andV10=3, 4, 5, 10, 15, and 20 m/s, Values forV10=25, 30, 35, 45 m/s for wind roughened surfaces were interpolated from measured values by Fernandez et al. (2006).
sea surface were considered. The viewing directions could be up-wind, cross-wind and down-wind. In addition, sea surface cross section measurements for wind-roughened sea surfaces found by Fernandez et al. (2006) were interpolated to yield
A
A
A
A
’
’
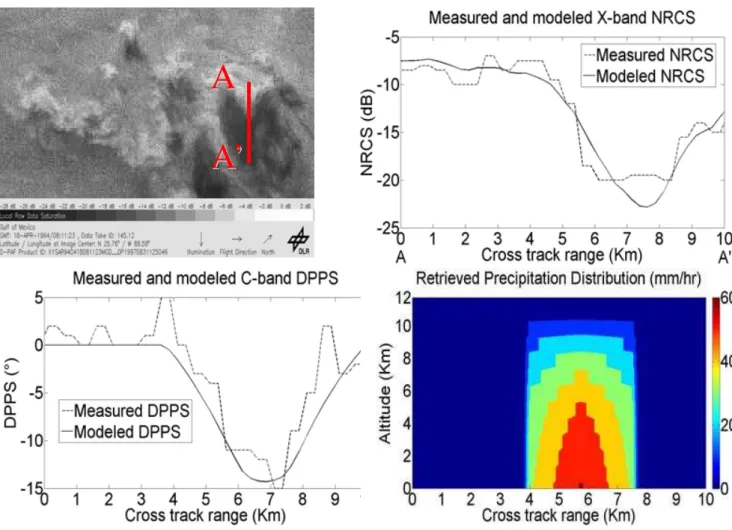
Fig. 5. Upper left: An X-band image observed over the Gulf of Mexico, 17 April 1994 at 18:47 UTC during STS-59, first presented in Melsheimer et al. (1998) as part of their Fig. 3. Upper right: The X-band NRCS scan along the red transectA−A′ in Fig. 7a of the Melsheimer et al. (1998) paper (- - - -). The NRCS computed from the modelR(x, z)distribution found in our study was (——-). The
σ0(x)was obtained from the transformed C-band NRCS. Lower left: The model C-band DPPS for the sameR(x, z)compared to that presented in Fig. 7d of Melsheimer et al. (1998) (- - - -). TheKdp−Rrelationship was an extrapolation from Teschl et al. (2006) and private
communication. Lower right: TheR(x, z)distribution used in the model. Note that the width of this cell is∼3 km. This cell width is consistent with the along-track dimension shown in the upper left. This cell would just fill one TRMM PR footprint.
σ0X=fX−Cσ0C
It is noteworthy that the model data from wind roughened surfaces only, and those from sea surfaces subjected to wind roughening and rain impact damping follow common linear trends within∼15%. Values forfX−Cfor VV polarization at
30◦, 45◦, and 60◦are 1.53, 1.47 and 1.16, respectively, and those for HH polarization are 1.50, 1.88 and 1.42.
A sample of data presented in Fig. 7 of Melsheimer et al. (1998) was analyzed to demonstrate the use of dual frequency data. It was noted from various model runs that rainfall had a minor effect on C-band NRCS measure-ments. (∼0.3 dB) so thatσSARC (x)≃σ0C(x). The background σ0X(x)was thus derived from the application of the linear equation shown above to yieldσ0C(x)presented in Fig. 7a of Melsheimer et al. (1998). The X-band NRCS measued
along A-A′, and that computed from a model with trans-formed sea surface NRCS values is shown in Fig. 5 (upper right). TheR(x, z)that produces this NRCS scan is shown in Fig. 5 (lower right).
6 The C-band differential polarized phase shift as a form of validation
angles,θ, down to 30 to yield: Kdp=
0.168 λ sin
2θ R1.20 (◦ /km)
Ryzhkov and Zrnic (1998) found that Kdp, for snow was ∼0.03◦/km at S-band (∼10 cm wavelength). That value was nearly independent of the melted rainfall rate. TheKdp, of
snow is expected to be about twice that large at C-band. Marzano and Weinman (2008) computedKdp, for snow at
C-band and those computations also yield small values. Be-cause of the irregular shape of snow, there was even some uncertainty about the sign ofKdp. In view of these
consider-ations, we neglected the effect of snow on the C-band DPPS.
7 Comparison of rainfall distributions over land ob-served from ground based radar and X-SAR
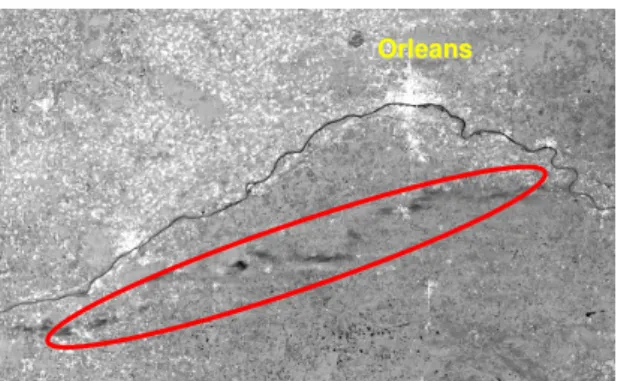
This discussion has been based on data available from the 1994 Shuttle missions. However new opportunities to mea-sure X-band NRCS are rapidly becoming available. Figure 6 (upper) displays a TerraSAR-X image of the region around Orleans, France obtained on 16 March 2008 in which the presence of rain is identified within the red ellipse. The Plan Position Indicator (PPI) display recorded at a height of 2 km by the Trappes operational radar (lower) confirms the pres-ence of rain in the scene. (The Loire River provides a refer-ence in both images.) A 12:00 UTC sounding from Trappes, France suggested that the freezing level was at 1.6 km so that the PPI probably responded to scattering by frozen hydrom-eteors. Digital data files for this case were not available as this document was being written, so a quantitative evaluation of the rainfall retrieval could not be conducted.
8 Preliminary conclusion and discussion
This study employed rainfall retrieval algorithms based on statistical and analytical VIE methods to infer the rainfall dis-tribution over the uniform land surface of the Amazon Basin. Although the techniques are quite distinct, they gave distri-butions that were in reasonable agreement. It should however
Fig. 6. Upper: A TerraSAR-X image obtained at 17:42 UTC over Orleans, France on 16 March 2008. The region enclosed by the red ellipse contains precipitation. Lower: Plan Position Position Indi-cator (PPI) output at 2 km elevation from the Trappes operational radar at 17:40 UTC. Units are mm/5 min.
be stressed that we had no independent verification of the va-lidity of those retrieved distributions.
In spite of the variability of the NRCS of sea surfaces in the proximity of rainfall, we were able to take advan-tage of the insensitivity of the C-band NRCS to atmospheric rain to infer the C-band NRCS of the surface. That C-band NRCS could be transformed to X-band sea surface NRCSs that were needed as boundary conditions to compute the X-band NRCS.
A combined C and X-band retrieval from two SARs car-ried on satellites in a common polar orbital plane may yield additional information regarding precipitation distributions. One such pair of SARs might be the TerraSAR-X and the RadarSAT-2.
Although we had no independent rainfall measurements with which to validate our retrieved maritime rainfall rate distribution, we had measurements of the C-band DPPS. The measured and modeled DPPS were reasonably consistent. However several simplifying assumptions about theKdp, of
credence to the retrieved results, Bringi and Chandrsekar (2001). Once sufficient confidence in the retrievals has been generated, the DPPS and the NRCS could both be incorpo-rated into a future retrieval algorithm. The DPPS could then serve as a constraint on the size distribution used to compute theηandkin the X-band NRCS computation.
Acknowledgements. We would like to thank Saverio Mori, Roberto Cantelmi and Gabriele Poccia, (UniRoma) for their pro-gramming assistance. We also thank Ziad Haddad, Eastwood Im, Bruce Chapman, Steve Durden (NASA-JPL, Cal Tech.), and Susanne Lehner, (DLR, Germany) for their valuable advice. We are also grateful for the data that were provided by Andreas Roesler of InfoTerra and Pierre Tabary of the French Meteorological Office. The graphic support of Beth Tully is also gratefully acknowledged.
Edited by: F. Guzzetti
Reviewed by: E. A. Smith and another anonymous referee
References
Alpers, W. and Melsheimer, C.: Rainfall, Synthetic Aperture Radar Marine Users, Manual, US Dept. of Commerce, NOAA, 355– 371, 2004.
Atlas, D. and Moore, R. K.: The measurement of precipitation with synthetic aperture radar, J. Atmos. Ocean Technol., 4, 368–376, 1987.
Bennartz, R. and Petty, G. W.: The sensitivity of microwave remote sensing observations of precipitation to ice particle size distribu-tions, J. Appl. Meteor., 40, 345–364, 2001.
Bringi, V. N. and Chandrsekar, V.: Polarimetric Doppler Weather Radar, Cambridge University Press, pp. 636, 2001.
Buckreuss, S., Balzer, W., Muhlbauer, P., Werninghaus, R., and Pitz, W.: The TerraSAR-X satellite project, Proc. Intern. Geosci. Remote Sensing Symp. (IGARSS03), 3096–3098, 2003. Caltagirone, F., Angino, G., Impagnatiello, F., Capuzi, A.,
Fagi-oli, S., and Leonardi, R.: COSMO-SkyMed: An advanced dual system for Earth observation, Proc. Intern. Geoscience Remote Sensing Symp. (IGARSS07), Barcelona (E), 23–27 July 2007. Chen, S. S., Price, J. F., Zhao, W., Donelan, M. A., and Walsh, E. J.:
The CBLAST-Hurricane Program and the next generation fully coupled atmosphere-wave-ocean models for hurricane research and prediction, B. Am. Meteorol. Soc., 88, 311–317, 2007. Contreras, R. F. and Plant, W. J.: Surface effect of rain on
mi-crowave backscatter from the ocean: Measurement and model-ing, J. Geophys. Res., 111, C08019, doi:10.1029/2005JC003356, 2006.
Durden, S. L., Haddad, Z. S., Kitiyakara, A., and Li, F. K.: Ef-fects of non-uniform beam filling on rainfall retrieval for the TRMM Precipitation Radar, J. Ocean Atmos. Technol., 15, 635– 646, 1998.
Fernandez, D. E., Carswell, J. R., Frasier, S., Chang, P. S., Clark, P. G., and Marks, F. D.: Dual-polarized C- and Ku-band ocean backscatter response to hurricane-force winds, J. Geophys. Res., 111, C08013, doi:10.1029/2005JC003048, 2006.
Jameson, A. R., Li, F., Durden, S. L., Haddad, Z. S., Holt, B., Fog-ary, T., Im, E., and Moore, R. K.: SIR-C/X-SAR Observations of rainstorms, Rem. Sens. Environ, 59, 267–279, 1997.
Jordan, R. L., Huneycutt, B. L., and Werner, M.: The SIR-C/X SAR synthetic aperture radar system, IEEE Trans. Geosci. Rem. Sens., 33, 829–839, 1995.
Kummerow, C., Ong, Y., Olson, W. S., Yang, S., Adler, R. F., Mc-Collum, J., Ferraro, R., Petty, G., Sun, D. B., Wilheit, T. T.: The status of the Tropical Rainfall Measuring Mission (TRMM) after two years in orbit, J. Appl. Meteor., 39, 1965–1982, 2000. Marzano, F. S., Weinman, J. A., Mugnai, A., and Pierdicca, N.:
Rain retrieval over land from X-band spaceborne synthetic aper-ture radar: a model study, Presentation at the Fourth European Conference on Radar Meteorology and Hydrology, ERAD06, Barcelona, 18–21 September 2006.
Marzano, F. S., Scaranari, D., and Vulpiani, G.: Supervised fuzzy logic classification of hydrometeors using C-band weather radars, IEEE Trans. Geosci. and Remote Sens., 45, 3784–3799, 2007.
Marzano, F. S. and Weinman, J. A.: Inversion of space-borne X-band synthetic aperture radar measurements for precipitation re-mote sensing over land, IEEE Trans. Geosci. and Rere-mote Sens., 46, 3472–3487, 2008.
Melsheimer, C., Gade, M., and Alpers, W.: Investigation of multi-frequency/multipolarization radar signatures of rain cells derived from SIR-C/X-SAR data, J. Geophys. Res., 103, 18 867–18 884, 1998.
Moore, R. K., Mogili, A., Fang, Y., Beh, B., and Ahamad, A.: Rain measurement with SIR-C/X-SAR, Rem. Sens. Environ., 59, 280– 293, 1997.
Ohfuchi, W., Sasaki, H., Masumoto, Y., and Nakamura, H.: “Vir-tual” atmospheric and oceanic circulation in the Earth Simulator, B. Am. Meteorol. Soc., 88, 861–866, 2007.
Pichugin, A. P. and Spiridonov, Yu. G.: Spatial distributions of rain-fall intensity recovery from space radar images, Sov. J. Rem. Sens., 8, 917–932, 1991.
Randall, D.: Towards global cloud resolving models – Modeling in the age of GPM, 6 GPM International Planning Workshop, 6–8 November, Annapolis, MD, 2006.
Rott, H., Cline, D., Nagler, T., Pulliainen, J., Rebhan, H., and Yueh, S.: CoRe-H2O- A dual-frequency SAR mission for hydrologi-cal and climate research, International Geosci. Remote Sensing Symposium (IGARSS’07), Barcelona, Spain, 23–27 July 2007. Ryzhkov, A. V. and Zrnic, D. S.: Discrimination between rain and
snow with a polarization radar, J. Appl. Meteor., 37, 1228–1240, 1998.
Sharay, Y. and Naftaly, U.: TecSAR: design considerations and pro-gramme status, IEE Proceedings- Radar, Sonar and Navigation, ISSN: 1350-2395, 153(2), 117–121, 2006.
Teschl, F., Randeu, W. L., Sch¨onhuber, M., and Teschl, R.: Sim-ulation of the specific differential phase (KDP) from 2D-Video-Distrometer measurements at S- and C-band wavelengths, Pa-per 61P1.16, ERAD2006 Conference, Barcelona, 9/18–22 Spain, and private communication, 2006.
Weinman, J. A. and Marzano, F. S.: An exploratory study to de-rive precipitation over land from X-band synthetic aperture radar measurements, J. Appl. Met., 47, 562–575, 2008.