Wild-Type and H1047R Oncogenic Mutant
Paraskevi Gkeka1., Thomas Evangelidis1., Maria Pavlaki2
, Vasiliki Lazani3, Savvas Christoforidis3,4, Bogos Agianian2, Zoe Cournia1*
1Biomedical Research Foundation, Academy of Athens, Athens, Greece, 2Department of Molecular Biology and Genetics, Democritus University of Thrace, Alexandroupolis, Greece,3Department of Biomedical Research, Institute of Molecular Biology and Biotechnology-Foundation for Research and Technology (IMBB-BR/ FORTH), Ioannina, Greece,4Department of Medicine, University of Ioannina, Ioannina, Greece
Abstract
ThePIK3CA gene is one of the most frequently mutated oncogenes in human cancers. It encodes p110a, the catalytic subunit of phosphatidylinositol 3-kinase alpha (PI3Ka), which activates signaling cascades leading to cell proliferation, survival, and cell growth. The most frequent mutation in PIK3CA is H1047R, which results in enzymatic overactivation. Understanding how the H1047R mutation causes the enhanced activity of the protein in atomic detail is central to developing mutant-specific therapeutics for cancer. To this end, Surface Plasmon Resonance (SPR) experiments and Molecular Dynamics (MD) simulations were carried out for both wild-type (WT) and H1047R mutant proteins. An expanded positive charge distribution on the membrane binding regions of the mutant with respect to the WT protein is observed through MD simulations, which justifies the increased ability of the mutated protein variant to bind to membranes rich in anionic lipids in our SPR experiments. Our results further support an auto-inhibitory role of the C-terminal tail in the WT protein, which is abolished in the mutant protein due to loss of crucial intermolecular interactions. Moreover, Functional Mode Analysis reveals that the H1047R mutation alters the twisting motion of the N-lobe of the kinase domain with respect to the C-lobe and shifts the position of the conserved P-loop residues in the vicinity of the active site. These findings demonstrate the dynamical and structural differences of the two proteins in atomic detail and propose a mechanism of overactivation for the mutant protein. The results may be further utilized for the design of mutant-specific PI3Kainhibitors that exploit the altered mutant conformation.
Citation:Gkeka P, Evangelidis T, Pavlaki M, Lazani V, Christoforidis S, et al. (2014) Investigating the Structure and Dynamics of thePIK3CAWild-Type and H1047R Oncogenic Mutant. PLoS Comput Biol 10(10): e1003895. doi:10.1371/journal.pcbi.1003895
Editor:Bert L. de Groot, Max Planck Institute for Biophysical Chemistry, Germany
ReceivedJuly 19, 2013;AcceptedSeptember 8, 2014;PublishedOctober 23, 2014
Copyright:ß2014 Gkeka et al. This is an open-access article distributed under the terms of the Creative Commons Attribution License, which permits unrestricted use, distribution, and reproduction in any medium, provided the original author and source are credited.
Funding:The initial part of this work was co-funded by the NSRF 2007–2013, the European Regional Development Fund and national resources, under the grant ‘‘Cooperation’’ [No. 09SUN 11-675]. This work has been also supported by a Marie Curie Reintegration Grant (FP7-PEOPLE-2009-RG, No 256533) and an AACR Judah Folkman Fellowship for Cancer Research in Angiogenesis (08-40-18-COUR). TE was partly supported by a Bodossaki Foundation graduate scholarship. MP was also partly supported from a FP7-REGPOT-2008 grant (no 229971). We acknowledge PRACE for awarding us access to the computational facility CURIE at GENCI@CEA, France. This work was also supported by the LinkSCEEM-2 project, funded by the European Commission under the 7th Framework Programme through Capacities Research Infrastructure, INFRA-2010-1.2.3 Virtual Research Communities, Combination of Collaborative Project and Coordination and Support Actions (CP-CSA) under grant agreement no RI-261600. Part of the computational work was performed at BRFAA using a cluster funded from European Economic Area Grant No. EL0084. The funders had no role in study design, data collection and analysis, decision to publish, or preparation of the manuscript.
Competing Interests:The authors have declared that no competing interests exist.
* Email: [email protected]
.These authors contributed equally to this work.
Introduction
The PI3Ka protein is involved in cellular processes vital for cancer progression, such as cell growth, proliferation, motility, survival, and metabolism [1]. As a result, deregulation of PI3Ka
signaling is one of the most frequent events leading to cancer [2]. PI3Kauses ATP to phosphorylate the phosphatidylinositol PIP2 to PIP3, a reaction that requires prior attachment of the enzyme to the cell membrane. Increased PI3Ka signaling may occur by several mechanisms, including somatic mutations and amplifica-tion of genes encoding key components of the PI3Kapathway [1]. PI3Ka comprises a catalytic subunit, p110a, and a regulatory subunit, p85a. The p110a subunit consists of five domains: the adaptor-binding domain (ABD), the RAS-binding domain (RBD), and the C2, helical, and kinase domains. Somatic mutations within the gene encoding p110a(PIK3CA) are frequently observed in a
variety of human tumors, including breast, colon, endometrial cancers, and glioblastomas [3]. These mutations are scattered over the length of p110a but two hotspots account for nearly 80% of them: an H1047R substitution close to the C-terminus and a cluster of three charge-reversal mutations (E542K, E545K, Q546K) in the helical domain of p110a [4]. Both types of mutations can induce oncogenic transformation in cell cultures [5], while H1047R is also able to induce tumorigenesis in transgenic mice [6,7]. According to structural and functional studies, these two hot spot mutations act synergistically, but independently [8–10].
kinase domain, which increase basal ATPase activity as well as expose the membrane binding regions, thereby augmenting basal membrane binding [8,12,13]. It has also been shown that the C-terminal region, where H1047R resides, is essential for catalysis. The C-terminus enhances membrane binding, while it inhibits the basal activity of the enzyme in the absence of the membrane [14– 16]. This recent experimental work has provided mechanistic insights into the mutational activation; however, an atomic-level description of the factors that contribute to the enzyme overactivity is still missing.
In the present study, we have modeled the full-length catalytic p110asubunit in the WT and H1047R mutant forms in order to gain insights into the overactivation mechanism of the commonly-expressed H1047R mutant through Molecular Dynamics (MD) simulations and Functional Mode Analysis (FMA) and have used SPR experiments to validate our results. The simulations are in excellent agreement with experimental data and allow us to provide atomic-detail insights into the mechanism of overactiva-tion of thePIK3CAH1047R mutant by monitoring structural and dynamical elements of the WT and mutant proteins.
Results
Convergence of WT and H1047R systems
Five independent simulations have been performed for the full length WT and H1047R mutant p110a(the catalytic subunit of PI3Ka), respectively (Figure S1 and Table S1). Ca Root Mean Square Deviation (RMSD) indicates that a plateau is reached in ,100–120 ns for the WT and,100–135 ns for the mutant p110a
(Figure S2). For the different systems, we performed Principal Component Analysis (PCA) using the last 50 ns of sampling for each independent simulation for the WT and H1047R mutant proteins, respectively. The 50 ns used for the PCA were chosen based on the RMSD of the Ca of the non-flexible loops (res. number 1–7, 231–240, 291–330, 410–417, 505–530, 863–872, 941–952, 1047–1068). The overlap of the 2D projections of the trajectories on the first two eigenvectors indicates that the five independent simulations for the WT and the H1047R mutant
proteins span the same or similar conformational phase space (Figure S3). For the analysis of the trajectories we used the last 50 ns of each trajectory, i.e. WT1 (100–150 ns), WT2 (100– 150 ns), WT3 (100–150 ns), WT4 (120–170 ns), WT5 (100– 150 ns) for the WT and Mut1 (125–175 ns), Mut2 (100–150 ns), Mut3 (130–180 ns), Mut4 (135–185 ns), Mut5 (100–150 ns) for the mutant (Table S1).
Cluster analysis and conformation of a second binding pocket in PI3Ka
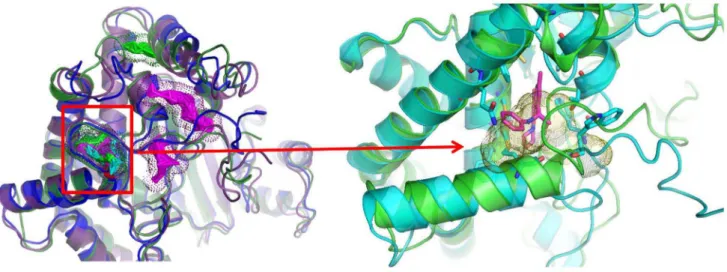
It has been proposed that a second binding site, distinct from the active site, exists in PI3Ka as demonstrated in a recent WT crystal structure [8]. Representative conformations from the first three cluster representatives of the WT protein (taken from simulation WT1, see Table S2) were submitted to Q-SiteFinder server [17] for ligand binding site prediction in the kinase domain. As seen in Figure 1, the existence of a new binding pocket, distinct from the active site and close to H1047 in the WT protein, is confirmed.
An altered hydrogen bonding network leads to changes in polar contacts within the mutation region
To determine key features of the mutant protein that may result to overactivity with respect to the WT, the structure and dynamics of interaction network in both proteins were monitored. Functionally important structural elements of the PI3Ka kinase domain are highlighted in Figure 2. It has been suggested that intermolecular interactions between helix ka11 (res. numbers 1031–1047), which precedes the C-terminal tail, and the catalytic loop (res. numbers 909–920) shield the conserved catalytic DRH motif from performing futile ATP hydrolysis by His-917 [15,16]. Indeed, our calculations show that an interaction network, tightly coupled to His-1047, accurately controls the DRH motif and retracts it from the vicinity of the active site: the hydrogen bond between the WT His-1047 backbone nitrogen and Met-1043 backbone oxygen as well as the hydrogen bond between the WT His-1047p-imidazole ring nitrogen (see Figure S4 for definition) and Met-1043 backbone oxygen stabilize the lasta-helix of the protein, ka11 (see Figure 3 A, hydrogen bonds have frequencies 4667% and 6465%, respectively). Statistical errors have been calculated as standard deviations from five independent simula-tions. The autocorrelation functions of the hydrogen bonds time series have been calculated and found to converge within the simulation time. ka11 is further stabilized by a frequent hydrogen bond between the WT Gly-1049 nitrogen and Asn-1044 backbone oxygen (7268%). As a result, a hydrogen bond between the His-1047 t-imidazole ring nitrogen and the amide hydrogen of activation loop residue Leu-956 occurs at high frequency (9261%) in four out of five simulations of the WT p110a, in agreement with experimental data (Table S3) [12]. In Simulation WT1, this hydrogen bond is infrequent (1%), however, Leu-956 backbone oxygen is frequently hydrogen bonded with Thr-1053 backbone oxygen (90%), leading to a similar conformation of the WT protein ka11 helix in all five simulations (Figure S5). As His-1047 is kept tightly controlled in the WT, Arg-949 forms frequent hydrogen bonds with Asp-915 of the conserved DRH motif in four out of five of WT simulations (7866%, Table S3). In the remaining simulation (Simulation WT3), Arg949 side chain nitrogen atoms form hydrogen bonds with Asp-939 backbone oxygen with a frequency of 78%. In all five simulations, we consistently observed a hydrogen bond formed between Arg-916 of the DRH motif and Asp-933 of the DFG motif in agreement with Miller et al. [15].
Author Summary
In stark contrast, this extensive hydrogen bond network observed in the vicinity of the WT His-1047 is not present in the mutant structure. Arg-1047 breaks the hydrogen bond with Leu-956. Consequently, the His-to-Arg substitution at position 1047 desta-bilizes the ka11 a-helix by disruption of the hydrogen bonds between Arg-1047 and Met-1043 as well as Gly-1049 and Asn-1044 (Figure 3 B, Table S3). The disruption of thea-helix allows Asp-1045 to hydrogen bond with Arg-949 in three out of five mutant simulations. In the other two simulations, the final residues of ka11, Asp-1045, Ala-1046, and Arg-1047, are in an extended conforma-tion and do not form any hydrogen bonds with the activaconforma-tion loop. In all five simulations of the H1047R mutant the activation loop residue Asp-951 forms frequent hydrogen bonds with either residues Gly-912, Phe-909 or Asp-939 from the activation loop. In turn, the
hydrogen bond between Arg-949 and Asp-915 is abolished in the mutant H1047R p110a. This destabilization of Asp-915 allows the side-chain of His-917 of the DRH motif (which in the active PI3Ka
conformation participates in the ATP hydrolysis) to point towards the active site (Figure S6). This conformation of the His-917 was also observed in Ref. 17, where His-745 of PI3Kcin its active form points towards the active site as compared to the catalytic His-807 of Vsp34 (the primordial PI3Ka) that points away from the ATP site (see Figures 2 C and 3 of Ref. [15]). Similarly to the WT simulations, the hydrogen bond between Arg-916 of the DRH motif and Asp-933 of the DFG motif is also evident, though to a lesser extent (WT frequency, 7966%; mutant, 50614%).
To further probe intermolecular interactions that govern the observed differences between WT and mutant, we have calculated the average distances of the side chains of the WIF motif residues (res. numbers 1057, 1058, and 1059). This motif is conserved in class I and class II PI3Ks as a triplet of hydrophobic residues and has been proposed to be crucial for lipid binding in the C-terminal region [8]. Stacking of the hydrophobic side chains of the WIF motif is evident in our simulations as has been suggested by experiments and may play a role in lipid binding (Figures S7, S8 and Table S4) [8,18]. In particular, we observe stacking between Ile-1058 and Phe-1059 in the largest part of the trajectory of both the mutant and WT simulations, while Trp-1057 and Ile-1058 are occasionally found within stacking distance in both proteins.
We also monitored the effect of the H1047R mutation on the solvent accessibility of ka11 and ka12 (C-terminal tail, residues 1032–1068). Our results demonstrate that residues 1032–1047 (ka11) are significantly more solvent exposed in the H0147R mutant, while residues 1048–1069 (ka12) are more solvent exposed in the WT (Table S5). In particular, residues Met-1043, Trp-1057 as well as the mutated residue 1047 have higher solvent accessible area in the mutant, whereas Met-1055 and Asp-1056 are more solvent accessible in the WT protein (Figure S9).
The polar contacts within the active site are altered in the mutant form
The examination of the polar contact network of the WT and the mutant proteins (i.e. salt bridges and hydrogen bonds) indicates Figure 1. Conformation of a second binding pocket in PI3Ka.(A) The first three cluster representatives from the WT trajectory in blue, green, and magenta, respectively. Dots represent predicted binding sites identified by the Q-SiteFinder server. The color of the dots corresponds to the respective cluster representative. (B) The first cluster representative from the trajectory is colored in green and aligned with the 4A55 crystal structure in cyan. His1047 is shown in cyan stick representation. The crystallized ligand of 4A55, PIK-108, is shown in magenta [8]. The predicted binding site by QSiteFinder appears in yellow dots and highly overlaps with the position of PIK-108 in the experimental structure.
doi:10.1371/journal.pcbi.1003895.g001
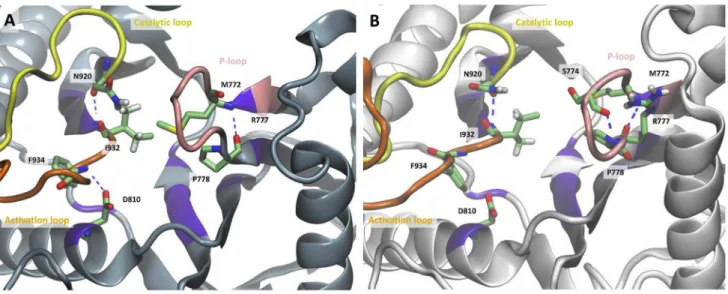
differences between the two protein forms within the active site (Figures 4, S10, and S11). The hydrogen bond between Asp-810 of the affinity pocket and Phe-934 of the activation loop (DFG motif) occurs at a frequency of 9261% of the simulation time in the WT, while it has zero or low occurrence in three out of five simulations of the mutant. In the other two simulations of the mutant the Asp-810-Phe-934 hydrogen bond has an average frequency of 8563%, this, however, does not affect the conformation of the activation loop which is similar in all five simulations of the mutant (Figure S11). Met-772 is hydrogen bonded through its backbone nitrogen to the backbone oxygen of Pro-778 in 75612% of the simulation time in the WT and in 8961% of the mutant trajectories. Loop residues 771–780 interact with the phosphates of the ATP and are known to comprise the P-loop (see Table 1) [18]. Despite this common interaction within the P-loop residues, two hydrogen bonds between the backbone oxygen and nitrogen of both Arg-770 and Trp-780 occur with higher frequency in the mutant protein than in the WT, 7369% and 8761% for the mutant and 3768% and 3968% in the WT, leading to a more compact conformation of the P-loop in the case of H1047R mutant (Figure 4 B). This closed conformation is further enforced through a hydrogen bond between the backbone oxygen of Ser-774 and the backbone nitrogen of Arg-777 in the mutant simulations (4567%). The same hydrogen bond is either infrequent or completely absent in the WT simulations, allowing for a more wide conformation of the P-loop. Estimation of the solvent exposed surface area in the active site of the WT and H1047R p110a subunit showed that both proteins have similar solvent accessibility (Figure S12, Table S5). This finding is in agreement with previous observations [19].
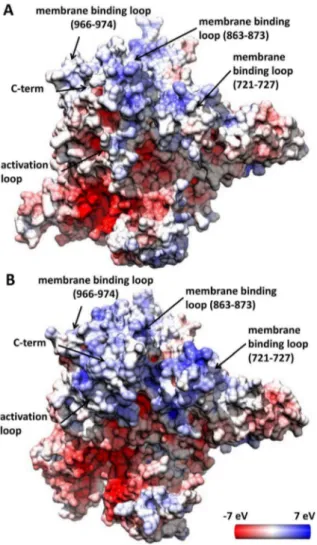
H1047R accumulates positive charge in regions that contact the cell membrane
PI3Ka attaches to the cell membrane in order to retrieve the PIP2 substrate and transform it to PIP3. It has been reported that the H1047R mutation augments the interaction between PI3Ka
and the membrane; the enzymatic activity of PI3KaH1047R is increased compared to the WT protein upon interaction with
phosphatidylserine (PS) and cancer liposomes [12]. Further lipid-PI3Kaassociation studies [8], using the WT and H1047R mutant proteins and neutral and anionic PS liposomes, showed that lipid binding of the mutant protein is many fold higher than that of the WT enzyme. The inner leaflet of the cell membrane has a net negative charge resulting from the predominance of phosphati-dylserine and phosphatidylinositol on the cytosolic face of the plasma membrane. Thus, to rationalize the fact that H1047R PI3Kabinds to cell membranes with higher affinity, we performed electrostatic potential calculations on the proposed membrane binding domains, which involve residues 863–873, 721–727, the end of the C-terminal tail, and residues along the activation loop [11,12]. The calculated electrostatic potential on the surface of the two proteins reveals major differences in the positive charge distribution of membrane binding regions (Figures 5 and S13). In the H1047R p110a, the C-terminus protrudes to the plane of the membrane as a hydrophobic tail, while it is surrounded by enhanced positive charge accumulated along the activation loop, the ka7/ka8 (966–974), and ka6/ka5 (863–873) elbows (Figures 5 B and S13 B,D). These regions of the kinase C-lobe, which are pronouncedly less positively charged in the WT (Figure 5 A and S13 A, B), have been found to interact with neutral and anionic membranes only in the case of H1047R mutant [13]. Interestingly, the mutant also exhibits higher positive charge than the WT along the other membrane binding site (residues 721–727 on the N-lobe) which was protected in both WT and H1047R HDX-MS experiments by PIP2 phospholipid vesicles [13]. Positive charge is also detected on loops 343–351 and 410–418 of the mutant C2 domain, which have also been proposed to contact the cell membrane [11].
H1047R displays higher membrane binding compared to WT
In order to validate our MD results and compare lipid binding of WT and mutant PI3Ka, we employed Surface Plasmon Resonance (SPR) to monitor direct binding to cancer liposomes. Liposomes were prepared from total lipid extractions from HCT116 human colorectal cancer cells and were enriched with Figure 3. Polar contacts close to the mutation site, in (A) the WT and (B) H1047R p110a.The activation loop is colored orange, the catalytic loop yellow, and the P-loop in pink. Residues that form polar contacts are shown in licorice representation.
2% PIP2. As cell membranes contain mostly negatively charged lipids, we expect the liposomal surface to be predominantly negatively charged. In titration experiments, a concentration dependent binding of both WT (Figure 6 A) and mutated PI3Ka
(Figure 6 B) to liposome surfaces was observed. H1047R bound liposomal membranes at repeatedly higher levels than equimolar WT protein (typically ,2–2.5 fold at 40 nM at the peak of association which corresponds to end of injection; Figure 6 B). This increase in lipid binding characterizes the behavior of the inactive forms of the enzyme as no activating RTK phosphopep-tide was included in the experiments. No significant binding was observed to control surfaces for both proteins, demonstrating PI3K specificity for lipids. In the absence of PIP2, we could not detect substantial PI3Ka-liposome interaction, indicating that our results do not depend on endogenous PIP2 in cancer liposomes.
Comparisons were performed using data obtained from the same injection and liposomal surface, in a ‘‘one shot’’ grid approach (see Materials and Methods section).
The dynamics of functionally relevant elements are significantly different in the mutant form
Root mean square fluctuation (RMSF) analysis of the MD trajectory reveals that three regions important for enzyme function exhibit different mobility in the WT and the mutant (Table S6). The activation loop (933–958) has an average RMSF of 1.2660.12 A˚ in the WT and 1.6660.16 A˚ in the mutant. Moreover, the catalytic loop is more flexible in the mutant with an RMSF of 1.0460.05 A˚ compared to an RMSF of 0.8160.04 A˚ in the WT, as well as the P-loop. The C-terminus (residues 1048– 1068) sporadically forms helical turns (see Videos S1 and S2) in both the mutant and the WT proteins, but its overall flexibility remains high. The RMSF is 3.4060.90 A˚ in the WT and 3.4260.36 A˚ in the mutant; however their conformation is entirely different. Although the initial configurations of the C-termini of mutant and WT proteins were modeled to occupy the same area in space (Figure S14 shows the ka7/ka8 and ka6/ka5 elbows (blue) to be aligned very well in their initial conformation), during the course of the simulation the WT C-terminus always shields the ATP binding pocket, whereas the C-terminus of the mutant is pulled above the ATP site (see Videos S1 and S2).
Kinases are known to exhibit two characteristic large-scale motions in the absence of ATP: a bending motion centered at the hinge region, between the N- and the C-lobe, and a twisting motion of the N- lobe with respect to the C-lobe [20]. Although these motions can be described by Principal Component Analysis (PCA), they are not captured entirely by a single principal mode. Thereby, Functional Mode Analysis (FMA) was implemented in order to identify collective motions related to the hinge bending motion and the C- and N- lobe twisting motions. The functional quantity that yielded the highest correlation to the hinge bending motion was the distance between the Cacarbons of Leu-781 and Met922 of the active site (dLM). Residues Leu-781 and Met-922 were selected to quantify the hinge bending motion as they lie on opposite sites of the catalytic cleft and their distance is directly related to the opening and closing of the active site. In contrast to Figure 4. Polar contacts close to the activation site, in (A) the WT and (B) H1047R p110a.The activation loop is colored orange, the catalytic loop yellow, and the P-loop in pink. Residues that form polar contacts are shown in licorice representation.
doi:10.1371/journal.pcbi.1003895.g004
Table 1.Residue numbers of functionally important structural elements of the PI3Kakinase domain.
Functionally important elements Residues
Mem. Bind. loop 1 721–727
P-loop 771–777
Mem. Bind. loop 2 863–873
Catalytic loop 909–920
DRH motif 915–917
Activation loop 933–958
DFG motif 933–935
C-terminus 1032–1068
WIF motif 1057–1059
Affinity pocket (ATP pocket) 810, 836, 848, 932
Adenine pocket (ATP pocket) 800, 836, 922, 930
Gatekeeper (ATP pocket) 848
Specificity pocket (ATP pocket) 772, 780
Hinge (ATP pocket) 849, 851
the hinge bending motion, which occurs in two dimensions (linear), the twisting motion occurs in three dimensions. For this motion, the highest correlated functional quantity was the RMSD of the Caof the active site residues (RMSDact), which is a non-linear metric.
FordLM, the collective vectorawas optimized by maximizing the Pearson’s correlation coefficient (R), yielding linear models for the WT and mutantdLM. We used the first 35 ns of the production run for model building and the rest 15 ns for cross-validation (Figure S15 C–H). To avoid over-fitting of the model in the selection of the basis set, the Pearson’s correlation coefficients of the model-building (Rm) and the cross-validation set (Rc) were plotted as a function of the number of eigenvectors used as a basis set (Figures S15 A and S15 B). The hinge bending motion between the two lobes of the kinase domain from the WT and H1047R p110ais illustrated in Figures S15A, B and video S3. Our analysis shows that the P-loop is closer to the catalytic loop in the WT than in the mutant throughout the course of the motion (video S3).
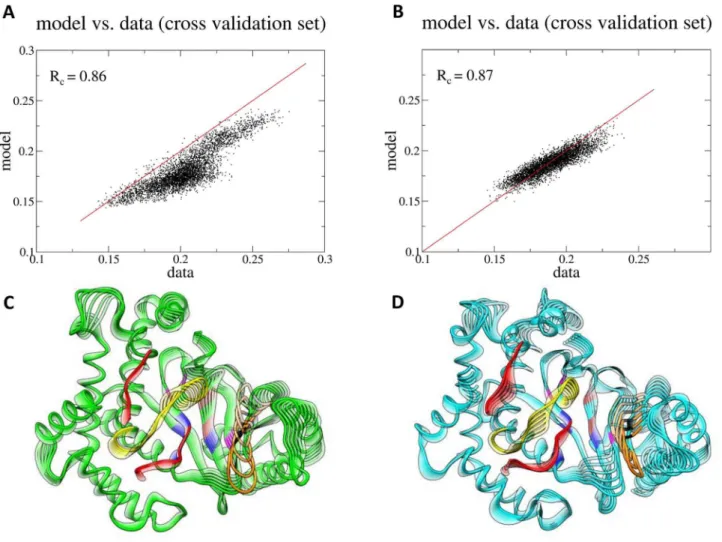
For the description of the twisting motion, the RMSDactwas optimized by maximizing the mutual information (MI) coefficient (see Supporting Information Text S1, section A6 for more details). The MI is used to quantify non-linear, higher order correlation. We used the first 40 ns of the production phase for model building the last 10 ns for cross-validation (Figures S16 A–D). For the optimization of the non-linear model with the MI, we used less than 20 eigenvectors to avoid over-fitting. As shown in Figures S16 A, B, the difference betweenRmandRcreaches a minimum when the number of used eigenvectors is 17 in the WT and 13 in the mutant. The two basis sets yielded a Pearson’s correlation values of 0.86 and 0.87 for the WT and the mutant trajectory, respectively (Figures 7 A, B), which denote high correlation between the RMSDactand the twisting motion of the kinase lobes. In both the mutant and the WT, the P-loop lies on the same plane, however, as the motion progresses, it is shifted outwards in the mutant with respect to the WT, broadening the solvent accessibility of the mutant catalytic cleft (Figures 7 C, D and video S4). A more open conformation of the P-loop in the mutant structure was also observed through our polar contact analysis within the active site of the WT and mutant proteins (see above). A greater catalytic cleft may lead to enhanced substrate accessibility.
Moreover, the catalytic loop of the WT comes closer to the ATP binding site thus reducing the volume of the pocket. The mutant activation loop lies below the activation loop of the WT in the starting position, but this positioning is reversed in the final position. The average conformations of the kinase domains show that the P-loop of the WT p110acurls inwards, towards the ATP-binding cavity when compared with the H1047R p110a, which results to a greater catalytic cleft in the mutant protein (Figure S17).
Figure 5. The electrostatic potential on the surface of the average conformation of the WT and H1047R p110a.The images depict membrane interaction areas of the WT (A) and H1047R mutant (B) first cluster representatives. The surface has been colored with a color scale from27 eV to 7 eV, with red representing negative charge,
white neutral and blue positive. The charge value corresponds to the solvent accessible surface of the protein, namely 1.4 A˚ far from the surface. These structures were derived from a cluster analysis including all the Cacarbon with a cutoff of 1.7 A˚ .
doi:10.1371/journal.pcbi.1003895.g005
Figure 6. PI3Kabinding to PIP2-liposomes. Typical SPR senso-grams depicting concentration dependent binding of WT p110a/p85a (A) and H1047R p110a(H1047R)/p85a(B) PI3Kato liposomes. Signal from WT at 1.25 and 2 nM (A) was nil and is not shown for clarity. Vertical bars indicate beginning and end of injection. Data shown are referenced and corrected for bulk effect.
Moreover, in order to quantify the overlap between the mutant and WT trajectory eigenspaces, we calculated the Root Mean Square Inner Product (RMSIP) for all corresponding eigenvectors arising from PCA for the kinase domain (see Text S1, section A5 and Table S7). The mutant and the WT trajectory RMSIP yielded a normalized value of 0.2360.01 for the kinase domain PCA and for the five independent trajectories, indicating that the eigen-spaces of the WT and the mutant are different. In comparison, the RMSIP of the WT trajectories is 0.3860.03 and for the mutant RMSIP = 0.4260.01. In other words, the motions along each PC of the WT did not correspond to the motions of the equivalent principal component of the mutant as shown by their overlap, which was 23%.
Discussion
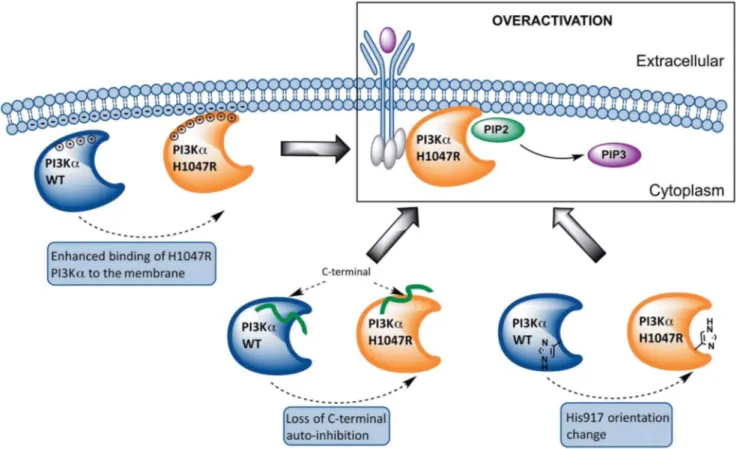
Results presented herein lead to a model of the overactivation mechanism of the commonly-expressedPIK3CAmutant H1047R based on structural and dynamic differences with its WT counterpart, schematized in Figure 8. SPR experiments show that the H1047R mutant binds liposomal membranes with higher competence. This finding is rationalized through MD simulations and subsequent electrostatic potential calculations, which verify
that the mutant protein accumulates positive charge on the membrane binding domains of PIK3CA. This accumulation of positive charge explains the experimental finding that the mutant binds membranes rich in anionic lipids with higher capacity than the WT. Previous studies have shown that the C-terminal tail of the mutant is more solvent exposed than its WT counterpart, which is also confirmed through our MD simulations. Moreover, we verify the prediction of a second, unexpected binding pocket close to the area of the mutation, recently discovered by X-ray crystallography. Following the agreement with experimental results, we extend our studies to highlight the series of events that lead to the overactivation of this protein kinase mutant. Our results support an auto-inhibitory role of the C-terminal tail in the WT protein, which strictly controls the DRH motif to limit its access to the catalytic site.
We propose that the weakening of this role in the H1047R mutant through loss of crucial intermolecular interactions is a plausible explanation of the elevated kinase activity of the enzyme. One major difference between the polar contact network of the WT and H1047R is the loss of the hydrogen bond connecting Arg-949 and catalytic Asp-915 of the DRH motif in the mutant, which occurs in the WT in 7866% occurrence, while it is absent in the mutant. Arg-949 is known for conferring specificity to PIP2 in
Figure 7. Functional mode analysis of the CaRMSD of active site residues.(A/B) Scatter plots of the data versus the model using the cross-validation sets only. (C/D) The functional mode representing the kinase C- and N-lobe twisting motion for the WT and mutant proteins, respectively. Red: activation loop; yellow: catalytic loop; orange: P-loop; brown: hinge; magenta: adenine pocket; blue: affinity pocket (hydrophobic region I); black: specificity pocket.
PI3Ka[8]. The same functional role has also been reported in the
cisoform [21]. The difference in the polar contacts, position, and consequently the availability of the positively charged residue, Arg-949 (along with Lys-948 and Arg-951), alters the configuration of the activation loop and exposes its positive charges, making it seemingly more capable to bind to the membrane and accommo-date negatively charged phosphoinositide headgroups. We also suggest that the abrogation of the Arg-949 - Asp-915 interaction in the mutant may contribute to the overactivity of the enzyme, since when these residues are left unrestrained they have enhanced access to the catalytic site [8].
In the H1047R p110a, Arg-1047 disrupts the last helical turn of ka11 and unwinds the hairpin observed in the crystal structure (compare Figures 3 A and 3 B) [12]. One plausible explanation is that substitution of the bulky imidazole ring by the longer aliphatic straight chain capped with the positively charged guanidium group, rules out the hydrogen bond interaction with the Leu-956 backbone amine, which is conserved throughout the trajectory of the WT, but is completely absent in the mutant (Figures 2, S5 and S6, Table S3). Mandelker et al. [12] also accentuates the loss of this hydrogen bond in the crystal structures of H1047R p110a/ p85a-niSH2 complex (PDB codes 3HIZ, 3HHM) and suggests that it is this interaction that stabilizes the WT activation loop. According to our data, the activation loop in the mutant structure is more flexible than in the WT and this can partially explain the oncogenic phenotype of the H1047R p110a(Table S6). On the other hand, the loss of interaction between residues 1047 and 956,
evoke the disruption of the simultaneously occurring hydrogen bond between Leu-956 backbone carbonyl and Thr-1053 side chain carboxyl. These two stable hydrogen bonds, mediated by Leu-956 in the WT, preserve the hairpin formation and hold the C-terminal tail in an arrangement that favors interaction with the DRH motif of the catalytic loop. This interaction with the DRH motif in the WT keeps His-917, which participates in ATP hydrolysis, pointing away from the active site thus preventing ATP hydrolysis more efficiently. This conformation of His-917 has also been observed in the inactive form of Vsp34 (the primordial PI3Ka), where the catalytic His-807 points away from the ATP site (see Figures 2 C and 3 of Ref. [15]). In contrast, in the mutant PI3Ka structure, His917 points towards the active site, a conformation that is also observed in the structure of the active PI3Kc, where His-745 is the residue participating in catalysis [15]. Additionally, the C-terminal tail of the H1047R mutant is significantly more solvent exposed in the H1047R mutant compared to the WT. It is worth noting that Hon et al. [8] reported that all mutations in the ka11/ka12 elbow (H1047L, H1047R, G1049R) exhibited a few fold higher levels of hydrophobic binding to neutral lipids and electrostatic binding to negatively charged lipids than the WT p110a, which may be associated with enhanced solvent accessibility of the mutant ka12 region and in particular higher solvent accessible area per residue, as indicated by Figure S9.
The importance of the final C-terminal helices of the p110a catalytic subunit in the regulation of the enzyme has been
Figure 8. Proposed model of the overactivation mechanism of the PIK3CAmutant H1047R based on structural and dynamic differences with its WT counterpart.From left to right: The mutant protein accumulates positive charge in regions that contact the cell membrane and displays higher membrane binding affinity compared to the WT protein. The auto-inhibitory role of the C-terminal tail, which strictly controls the DRH motif to limit its access to the catalytic site, is abolished in the mutant protein due to loss of crucial intermolecular interactions. In the WT protein, His-917 of the DRH motif, points away from the active site thus preventing ATP hydrolysis more efficiently, while in the mutant PI3Ka structure, His917 points towards the active site, a conformation that is also observed in the structure of the active PI3Kc.
previously highlighted [14–16]. This regulatory arch encircles the catalytic and activation loops and is believed to control the enzymatic activity [14]. The last helix, ka12, which is disordered in p110aand p110d, has two additional roles: (a) an activating role when in contact with the membrane [8], (b) an auto-inhibitory role when the enzyme is not interacting with the membrane [14–16]. In the latter case, ka12 locks the catalytic loop in an inactive state, presumably by shielding the conserved catalytic DRH motif (915– 917) from performing futile ATP hydrolysis. This second role has been inferred from inspection of the crystal structures of PI3K isoformsa,b,c,dand their paralogue in Drosophila melanogaster Vps34, as well as from truncation of the C-terminus of p110a, p110band Vps34 that resulted to enhanced basal ATPase activity in the absence of lipid substrate [8,15,16]. These results verify the self-inhibitory role of the C-terminus. Remarkably, the C-terminus interaction with the activation loop is relieved in the H1047R p110a (Tables S8, S9, S10), which may well be part of the explanation of the enhanced kinase activity of that enzyme.
The highly conserved DFG motif (933–935) at the beginning of the activation loop is believed to adopt different configurations during the various steps of the catalytic cycle of kinases [22] In PI3K, the aspartate side chain of DFG (Asp-933) bends in order to form polar contacts with the last phosphate group of ATP [23]. This is believed to be the ‘‘in’’ conformation which designates the active state, whereas in the ‘‘out’’ conformation the aspartate side chain extends straight towards the ribose ring. Our results show that both WT and mutant Asp-933 adopt an ‘‘in-like’’ conforma-tion, albeit Asp-933 of the WT structure is frequently turned away from the ATP binding site due to a high-frequency hydrogen bond with Arg-916 and a low frequency hydrogen bond with the Gly-935 backbone amine (Table S3 and videos S1 and S2). Both these polar contacts have significantly lower frequencies in the H1047R p110aand thus the mutant Asp-933 shows a tendency to assume an ‘‘in-like’’ conformation more frequently than the WT, providing an advantage to the former regarding ATP binding. Moreover, Asp-933 in both protein structures forms a salt- bridge with residue Lys-802 of the active site. The equivalent of residue Lys-802 in PI3Kc crystal structure (Lys-833) forms a hydrogen bond with the pan-PI3K inhibitor PIK-90 [24]. It is, therefore, plausible that Lys-802 plays a crucial role in the design of inhibitors like PIK-90. Lastly, in accordance with a previous simulation [19], the change in the orientation of Asp-933 is accompanied by a flip of the Phe-934 side chain that renders it more exposed to substrates entering the ATP-binding site. These observations may provide an important basis for the design of mutant selective inhibitors.
Changes in the polar contact network within the active site were also observed. We discern a change in the hydrogen bonding frequency between the side chain of Asp-810 and the backbone of Phe-934 from the DFG motif. This hydrogen bond loss could be exploited in the design of mutant-specific inhibitors targeting Asp-810, given that ligand binding in the WT active site would have to overcome the additional enthalpic cost for breaking these two frequent hydrogen bonds. Moreover, the specificity pocket residue Trp-780 is involved in two hydrogen bonds with Arg-770 with much higher frequency in the mutant than in the WT protein, providing valuable information for the design of inhibitors targeting the H1047R p110a.
Finally, through FMA we show that differences in the twisting motion of the kinase lobes exist, with the mutant having a greater opening of the catalytic cleft, which may favor ATP binding and thus influence kinase activity. Changes in the twisting motion have been previously proposed to alter kinase activity [20]. Through the FMA and polar contact analysis, we observe a wider conformation
of the P-loop relative to the ATP pocket in the mutant structure, while at the same time it is more compact compared to the WT structure, which could lead to enhanced accessibility of the active site.
Overall, understanding how the H1047R mutation causes the enhanced activity of the protein in atomic detail is of paramount importance for developing mutant-specific therapeutics for cancer.
Materials and Methods
Model construction and refinement
A full description of the methods can be found in the Text S1 (sections A1–A6). Briefly, two models of the WT p110a were constructed: in Model 1a the missing C2 domain loop residues 415–423 were created through loop modeling (Figure S18 B, Text S1, section A2). In Model 1b, residues 335–361 and 401–428 were re- constructed through homology modeling (Text S1, section A1 and Figure S18 C), using as a template the solution NMR structure of the human C2 domain with PDB accession code 2ENQ (Figure S18 D), due to the low electron density of the WT p110astructure (2RD0) at this area (Figure S19). The rest of the missing loops of 2RD0 were created through loop modeling and share the same coordinates in both Models 1a and 1b. Model 2 was built from the PDB structure 3HIZ [12]. C2 domain residues 335–361 and 402–428 were rebuilt from structure 2ENQ and residues 857–884 were rebuilt using PDB structure 3HHM as a template through homology modeling due to low electron density in this region (Text S1, section A3).
Molecular dynamics simulations and functional mode analysis
The MD trajectories for the WT and H1047R p110a were generated with NAMD v2.7 [25], using the CHARMM22 all-atom force field with the CMAP correction [26,27] and the TIP3P water model [28]. Five independent simulations for each protein were performed. Moreover, for the WT protein, we simulated both Model 1a and one of Model 1b in order to assess the effect of the remodeled C2 domain. All proteins were solvated into a cubic box large enough to ensure a 30 A˚ minimum separation of the protein from its periodic images. Na+ counter-ions were placed randomly in the system to neutralize the total charge (see Text S1, section A4 for more details). The production runs were performed under constant pressure, temperature, and number of particles (NPT). The convergence of our simulations was evaluated using the total Ca carbon RMSD, while to ensure that each set of independent simulations corresponds to the same conformational protein phase space, we plotted the 2 d projection of the trajectories on the first two eigenvectors of each simulation (Text S1, section A5). The trajectory was analyzed with nMOL-DYNv3.0.8 [29], MMTK-2.7.4 [30], GROMACS tools v4.5.5 [31], NAMD v2.7 [25,32], PDB2PQR [32], APBS [33], and VMD [34]. Functional Mode Analysis (FMA) was performed as discussed in Ref. [35]. Binding site prediction was performed with the QSiteFinder web server [17]. For more details on trajectory analysis see the Text S1, section A5.
Surface Plasmon Resonance (SPR)
The ProteOn biosensor (Bio-rad) was used for SPR analysis. ProteOn uses a unique 666 chip array (positions L1 to L6 are
liposome loaded channels but lacked liposomes, were used for data reference. Appropriate concentrations of WT and H1047R PI3K (diluted in SPR running buffer just before run) were injected over the chip using the parallel (A) channels. To ensure high experimental uniformity and confidence in SPR data comparisons, each binding experiment was performed in ‘‘one shot’’, i.e. both WT and H1047R were injected in the same parallel injection (occupying different A positions). Background PI3K binding and bulk effects within each injection were referenced using blank L channels. Experiments were repeated at least 3 times, using fresh liposomes loadings. SPR running buffer: 10 mM NaPi pH 7.4, 150 mM NaCl, 0.1 mg/ml BSA.
Proteins
Pure human WT p110a/p85a and mutant p110a(H1047R)/ p85a heterodimers were purchased from Millipore. Protein activity was verified using PI3-Kinase HTRF Assay (Millipore). Proteins in 50 mM Tris/HCl pH 8.0, 300 mM NaCl, 0.1 mM EGTA, 0.03% Brij-35, 270 mM sucrose, 0.2 mM PMSF, 1 mM benzamidine, 0.1% 2-mercaptoethanol were aliquoted and stored at280uC before use.
Liposomes
Liposomes have been prepared using lipids isolated from the cancer cell line HCT116, which carries a mutation in exon 20 of PIK3CA(H1047R) [2], according to Folch’s method [36]. Then,
L-a-phosphatidylinositol-4,5-bisphosphate (brain, porcine, ammo-nium salt, Avanti Polar Lipids, Inc.) was added to the extracted lipids (PIP2 concentration was 2% of the total lipids), and the mixture was immediately dried under N2 stream. When the sample was completely dried, lipids were left for another 30 minutes under the N2stream, followed by speed-vacuum for 1 hr. Subsequently, water was added to the dried lipids and the mixture was incubated at room temperature for 1 hr, while it was vortexed every 10 minutes. The liposomal preparation was subjected to 5 freeze/thaw cycles and was sonicated in a waterbath for 30 minutes. Finally, the liposomes were extruded using the Avanti mini-Extruder apparatus, according to manufacturer’s instructions, in order to obtain a homogeneous preparation of unilamelar liposomal vesicles at a size of 100 nm.
Supporting Information
Figure S1 The models of the full-length (A) WT p110a, (B) H1047R mutant.Regions created with loop modeling are colored red. In blue are shown the regions reconstructed through homology modeling. The indices of the modeled residues are indicated. His-1047 and Arg-1047 are depicted with stick representation in magenta in (A) and (B), respectively.
(TIF)
Figure S2 RMSD of the Cacarbons of p110a.(A) WT, (B) H1047R p110a. The highly flexible loop residues 1–7, 231–240, 291–330, 410–417, 505–530, 863–872, 941–952, 1047–1068 have been excluded from the calculation.
(TIF)
Figure S3 2D projection of the trajectories on the first two eigenvectors of each independent simulationfor the WT and the H1047R mutant proteins.
(TIF)
Figure S4 The structure of the L-histidine showing thep (ord) andt(ore) imidazole nitrogen atoms.
(TIF)
Figure S5 Snapshots close to the mutation site of the first cluster representatives of the five WT p110a simulations. The activation loop (res. numbers 933–958) is colored orange and the catalytic loop (res. numbers 909–920) is colored yellow. Residues forming hydrogen bonds are shown in licorice representation.
(TIF)
Figure S6 Snapshots close to the mutation site of the first cluster representatives of the five 1047R p110a simulations. The activation loop (res. numbers 933–958) is colored orange and the catalytic loop (res. numbers 909–920) is colored yellow. Residues forming hydrogen bonds are shown in licorice representation.
(TIF)
Figure S7 Stacking of the WIF motif for the WT protein as indicated by the center of mass distance between tryptophan, phenylalanine ring, and the side chain of isoleucine for the five simulations of the WT protein.
(TIF)
Figure S8 Stacking of the WIF motif for the H1047R protein as indicated by the center of mass distance between tryptophan, phenylalanine ring, and the side chain of isoleucine for the five simulations of the H1047R mutant protein. (TIF)
Figure S9 Average solvent accessible area and stan-dard deviation of the C-terminal residues 1032–1068 from five independent unbiased MD simulations for the WT and H1047R mutant proteins. Residues Met-1043, Trp-1057 as well as the mutated residue 1047 have higher solvent accessible area in the mutant, whereas Met-1055 and Asp-1056 are more solvent accessible in the WT protein.
(TIF)
Figure S10 Snapshots close to the active site of the first cluster representatives of the five WT p110a simula-tions.The P-loop (res. numbers 771–777) is shown in yellow, the affinity pocket (res. numbers 810, 836, 848, 932) in pink, the adenine pocket (res. numbers 800, 836, 922, 930) in orange, and the hinge region (res. numbers 849, 851) is colored in purple. Residues forming hydrogen bonds are shown in licorice represen-tation.
(TIF)
Figure S11 Snapshots close to the active site of the first cluster representatives of the five 1047R p110a simula-tions.The P-loop (res. numbers 771–777) is shown in yellow, the affinity pocket (res. numbers 810, 836, 848, 932) in pink, the adenine pocket (res. numbers 800, 836, 922, 930) in orange, and the hinge region (res. numbers 849, 851) is colored in purple. Residues forming hydrogen bonds are shown in licorice representation. (TIF)
Figure S12 Average solvent accessible area and stan-dard deviation of the active site residues from five independent unbiased MD simulations for the WT and H1047R mutant proteins. Following Williams’ notation (Williams et al., 2009), the catalytic site was defined to consist of the P-loop (771–777), the hinge region (849, 851), the adenine pocket (800, 836, 922, 930), the gatekeeper (848), the affinity pocket (810, 836, 848, 932) and the specificity pocket (772, 780).
(TIF)
The images depict membrane interaction areas of the WT (A, C) and H1047R mutant (B, D) cluster 2 and cluster 3 representatives. The surface has been colored with a color scale from27 eV to 7 eV, with red representing negative charge, white neutral and blue positive. The charge value corresponds to the solvent accessible surface of the protein, namely 1.4 A˚ far from the surface. These structures were derived from a cluster analysis including all the Cacarbon with a cutoff of 1.7 A˚ .
(TIF)
Figure S14 The kinase domain of the same model (cyan) overlaid onto the WT model (green). Residues created through loop modeling are colored orange in the mutant and red in the WT. The initial configuration of the C-termini of the two proteins occupy the same area in space. Residues constructed through homology modeling in the mutant are blue. Arg-1047 and His-1047 are depicted as magenta sticks.
(TIF)
Figure S15 Functional mode analysis of the distance between the Cacarbons of Leu781 and Met922 (dLM).(A/ B) the functional mode representing the kinase C- and N-lobe hinge bending motion for the WT and mutant proteins, respectively. Red: activation loop; yellow: catalytic loop; orange: P-loop; brown: hinge; magenta: adenine pocket; blue: affinity pocket (hydrophobic region I); black: specificity pocket. (C/D) the functional quantity f (dLM) versus the simulation time (black curve) for the WT and mutant, respectively. Red and green curves represent the model in the model and cross-validation building set, respectively. (E/F) scatter plots of the data versus the model using the cross-validation sets only. (G/H) Correlations Rmand Rcfor dLMas a functions of the number of eigenvectors used during the optimization; blue arrows indicate the number of eigenvectors used for the basis set.
(TIF)
Figure S16 Functional mode analysis of the CaRMSD of active site residues.(A/B) Correlations Rmand Rcfor RMSD as a functions of the number of eigenvectors used during the optimization; blue arrows indicate the number of eigenvectors used for the basis set. (C/D) the functional quantity f (RMSD) in nm versus the simulation time (black curve) for the WT and mutant, respectively. Red and green curves represent the model in the model and cross-validation building set, respectively. (TIF)
Figure S17 Average conformation of the ATP-binding site of the WT (green) and the H1047R (cyan) p110a.The P-loop of the WT curls inward towards the ATP-binding cavity when compared with the H1047R p110a, so than the active site of the WT is more closed than the mutant. Red: activation loop; yellow: catalytic loop. In the final state, the Caatoms of the two P-loops are within an average distance of 4.79 A˚ . The ATP is placed manually to indicate the active site.
(TIF)
Figure S18 The C2 domain of the human WT p110a.The two ends of the missing loop (positions 414 and 424) are colored yellow. (A) The C2 domain of the WT p110a crystal structure (PDB accession code: 2RD0). (B) The C2 domain of the same structure after loop modeling. The predicted conformation of the loop residues (415–423) is shown in red. (C) The C2 domain of the same structure after homology modeling using the solution NMR structure of the isolated human C2 domain as a template (PDB accession code: 2ENQ). Blue indicates the part that was re-modeled. (D) The solution NMR structure of the isolated human C2 domain (PDB accession code: 2ENQ).
(TIF)
Figure S19 Remodeling of the C2 domain. (A) Electron density around the C2 domain in the WT p110a (PDB code 2RD0). Yellow sticks represent residues that were remodeled. (B) The Ca
RMSD with respect to the starting conformation of the original C2 domain (black) versus the remodeled one (red). The remodeled C2 domain converges faster to average RMSD value, meaning that it is closer to equilibrium than the C2 domain in the original crystal structure.
(TIF)
Table S1 List of simulated systems. The analysis of the trajectories was performed in the last 50 ns of each trajectory. (DOCX)
Table S2 Population (in frames) of the first three clusters of the whole p110a subunit (cutoff = 1.7 A˚ ) and the kinase domain (residues 697–1068) (cutoff = 1 A˚ ) for Simulation 1 of the mutant and WT proteins.Although the total population of the first three clusters is comparable, the majority of the frames in the mutant are accumulated in the first cluster, indicating that the H1047R p110a protein visits less conformational states than the WT p110aduring production run. The first three clusters include almost the same number of frames and cover the majority of the population (94.1% and 91.6% for the WT versus 92.6% and 90.7% for the mutant).
(DOCX)
Table S3 Important hydrogen bonds and their frequen-cies in the WT and mutant p110a kinase domain. The hydrogen bonds are sorted by the amino acid in the donor-acceptor pair with the lowest index. Atom names follow the CHARMM force field naming scheme.
(DOCX)
Table S4 Average distance and standard deviation in A˚ from five independent unbiased MD simulations. (DOCX)
Table S5 Average area and standard deviation of the C-terminal and catalytic site residues from five indepen-dent unbiased MD simulations.
(DOCX)
Table S6 Average RMSF values and standard errors (A˚ ) of the functionally important loops of the kinase domain in the WT and H1047R p110a.
(DOCX)
Table S7 Overlap of the covariance matrices between the independent runs for both WT and mutant calculated by means of the Root Mean Square Inner Product (RMSIP). (DOCX)
Table S8 Hydrogen bond frequencies within the C-terminal tail (res. numbers 1048–1068) and the activation loop (res. numbers 933–958) of the WT p110aprotein.The hydrogen bonds between the two domains are shown in bold. (DOCX)
Table S9 Hydrogen bond frequencies within the C-terminal tail (res. numbers 1048–1068) and the activa-tion loop (res. numbers 933–958) of the H1047R mutant p110aprotein.The hydrogen bonds between the two domains are shown in bold.
(DOCX)
Table S10 Salt-bridge frequencies in the WT and mutant p110akinase domain.The salt-bridges are sorted by the amino acid in the donor-acceptor pair with the lowest index.
Text S1 The supporting information text provides details on the model construction and refinement. (DOCX)
Video S1 Stabilizing interaction at the PIP2 binding site in the WT p110a.Residues that participate in important polar contacts are depicted as sticks. The C-terminus is colored green, the activation loop red, the catalytic loop yellow and the WIF (1057–1059) motif purple.
(MP4)
Video S2 Stabilizing interaction at the PIP2 binding site in the H1047R p110a.Residues that participate in important polar contacts are depicted as sticks. The C-terminus is colored green, the activation loop red, the catalytic loop yellow and the WIF (1057–1059) motif purple.
(MP4)
Video S3 The hinge bending motion of the kinase domain.WT p110ais colored green and H1047R cyan. (MP4)
Video S4 The twisting motion between the N- and C-lobe of the kinase domain.WT p110ais colored green and H1047R cyan.
(MP4)
Acknowledgments
TE thanks Jochen Hub for discussions regarding functional mode analysis. MP and BA are grateful to Dr. Jonathan Popplewell (Bio-Rad Life Science, Europe) and Dr. Roben Luo (Bio-Rad Laboratories, San-Francisco) for providing materials and for critical input on LCP memLayer technology. MP and BA thank the CiBIT facility at the Department of MBG, Democritus University of Thrace.
Author Contributions
Conceived and designed the experiments: ZC TE PG MP VL SC BA. Performed the experiments: PG TE MP VL. Analyzed the data: PG TE MP VL SC BA ZC. Contributed reagents/materials/analysis tools: TE SC BA. Wrote the paper: PG TE MP VL SC BA ZC. Interpreted the data: PG TE MP VL SC BA ZC.
References
1. Courtney KD, Corcoran RB, Engelman JA (2010) The PI3K pathway as drug target in human cancer. J Clin Oncol 28: 1075–1083.
2. Samuels Y, Diaz LA, Jr., Schmidt-Kittler O, Cummins JM, Delong L, et al. (2005) Mutant PIK3CA promotes cell growth and invasion of human cancer cells. Cancer Cell 7: 561–573.
3. Yuan TL, Cantley LC (2008) PI3K pathway alterations in cancer: variations on a theme. Oncogene 27: 5497–5510.
4. Backer JM (2010) The regulation of class IA PI 3-kinases by inter-subunit interactions. Curr Top Microbiol Immunol 346: 87–114.
5. Gymnopoulos M, Elsliger MA, Vogt PK (2007) Rare cancer-specific mutations in PIK3CA show gain of function. Proc Natl Acad Sci U S A 104: 5569–5574. 6. Engelman JA, Chen L, Tan X, Crosby K, Guimaraes AR, et al. (2008) Effective use of PI3K and MEK inhibitors to treat mutant Kras G12D and PIK3CA H1047R murine lung cancers. Nat Med 14: 1351–1356.
7. Meyer DS, Brinkhaus H, Muller U, Muller M, Cardiff RD, et al. (2011) Luminal expression of PIK3CA mutant H1047R in the mammary gland induces heterogeneous tumors. Cancer Res 71: 4344–4351.
8. Hon W-C, Berndt A, Williams R (2012) Regulation of lipid binding underlies the activation mechanism of class IA PI3-kinases. Oncogene 31: 3655–3666. 9. Zhao L, Vogt PK (2008) Helical domain and kinase domain mutations in
p110alpha of phosphatidylinositol 3-kinase induce gain of function by different mechanisms. Proc Natl Acad Sci U S A 105: 2652–2657.
10. Carson JD, Van Aller G, Lehr R, Sinnamon RH, Kirkpatrick RB, et al. (2008) Effects of oncogenic p110alpha subunit mutations on the lipid kinase activity of phosphoinositide 3-kinase. Biochem J 409: 519–524.
11. Huang CH, Mandelker D, Schmidt-Kittler O, Samuels Y, Velculescu VE, et al. (2007) The structure of a human p110alpha/p85alpha complex elucidates the effects of oncogenic PI3Kalpha mutations. Science 318: 1744–1748. 12. Mandelker D, Gabelli SB, Schmidt-Kittler O, Zhu J, Cheong I, et al. (2009) A
frequent kinase domain mutation that changes the interaction between PI3Kalpha and the membrane. Proc Natl Acad Sci U S A 106: 16996–17001. 13. Burke JE, Perisic O, Masson GR, Vadas O, Williams RL (2012) Oncogenic mutations mimic and enhance dynamic events in the natural activation of phosphoinositide 3-kinase p110alpha (PIK3CA). Proc Natl Acad Sci U S A 109: 15259–15264.
14. Vadas O, Burke JE, Zhang X, Berndt A, Williams RL (2011) Structural basis for activation and inhibition of class I phosphoinositide 3-kinases. Sci Signal 4: re2. 15. Miller S, Tavshanjian B, Oleksy A, Perisic O, Houseman BT, et al. (2010) Shaping development of autophagy inhibitors with the structure of the lipid kinase Vps34. Science 327: 1638–1642.
16. Zhang X, Vadas O, Perisic O, Anderson KE, Clark J, et al. (2011) Structure of lipid kinase p110beta/p85beta elucidates an unusual SH2-domain-mediated inhibitory mechanism. Mol Cell 41: 567–578.
17. Laurie AT, Jackson RM (2005) Q-SiteFinder: an energy-based method for the prediction of protein-ligand binding sites. Bioinformatics 21: 1908–1916. 18. Williams R, Berndt A, Miller S, Hon WC, Zhang X (2009) Form and flexibility
in phosphoinositide 3-kinases. Biochem Soc Trans 37: 615–626.
19. Mankoo PK, Sukumar S, Karchin R (2009) PIK3CA somatic mutations in breast cancer: Mechanistic insights from Langevin dynamics simulations. Proteins 75: 499–508.
20. Williams JC, Wierenga RK, Saraste M (1998) Insights into Src kinase functions: structural comparisons. Trends Biochem Sci 23: 179–184.
21. Pirola L, Zvelebil MJ, Bulgarelli-Leva G, Van Obberghen E, Waterfield MD, et al. (2001) Activation loop sequences confer substrate specificity to phosphoinositide 3-kinase alpha (PI3Kalpha). Functions of lipid kinase-deficient PI3Kalpha in signaling. J Biol Chem 276: 21544–21554.
22. Lovera S, Sutto L, Boubeva R, Scapozza L, Dolker N, et al. (2012) The different flexibility of c-Src and c-Abl kinases regulates the accessibility of a druggable inactive conformation. J Am Chem Soc 134: 2496–2499.
23. Walker EH, Pacold ME, Perisic O, Stephens L, Hawkins PT, et al. (2000) Structural determinants of phosphoinositide 3-kinase inhibition by wortmannin, LY294002, quercetin, myricetin, and staurosporine. Mol Cell 6: 909–919. 24. Knight ZA, Gonzalez B, Feldman ME, Zunder ER, Goldenberg DD, et al.
(2006) A pharmacological map of the PI3-K family defines a role for p110alpha in insulin signaling. Cell 125: 733–747.
25. Phillips JC, Braun R, Wang W, Gumbart J, Tajkhorshid E, et al. (2005) Scalable molecular dynamics with NAMD. J Comput Chem 26: 1781–1802. 26. Brooks BR, Brooks CL, 3rd, Mackerell AD, Jr., Nilsson L, Petrella RJ, et al.
(2009) CHARMM: the biomolecular simulation program. J Comput Chem 30: 1545–1614.
27. MacKerell AD, Bashford D, Bellott M, Dunbrack RL, Evanseck JD, et al. (1998) All-atom empirical potential for molecular modeling and dynamics studies of proteins. J Phys Chem B 102: 3586–3616.
28. Jorgensen WL, Chandrasekhar J, Madura JD, Impey RW, Klein ML (1983) Comparison of Simple Potential Functions for Simulating Liquid Water. J Chem Phys 79: 926–935.
29. Rog T, Murzyn K, Hinsen K, Kneller GR (2003) nMoldyn: a program package for a neutron scattering oriented analysis of molecular dynamics simulations. J Comput Chem 24: 657–667.
30. Hinsen K (2000) The molecular modeling toolkit: A new approach to molecular simulations. J Comput Chem 21: 79–85.
31. Hess B, Carsten K, David vdS, Erik L (2008) GROMACS 4: Algorithms for Highly Efficient, Load-Balanced, and Scalable Molecular Simulation. Journal of Chemical Theory and Computation 4: 435–447.
32. Dolinsky TJ, Czodrowski P, Li H, Nielsen JE, Jensen JH, et al. (2007) PDB2PQR: Expanding and upgrading automated preparation of biomolecular structures for molecular simulations. Nucleic Acids Res 35: W522–525. 33. Baker NA, Sept D, Joseph S, Holst MJ, McCammon JA (2001) Electrostatics of
nanosystems: application to microtubules and the ribosome. Proc Natl Acad Sci U S A 98: 10037–10041.
34. Humphrey W, Dalke A, Schulten K (1996) VMD: visual molecular dynamics. J Mol Graph 14: 33–38.
35. Hub JS, de Groot BL (2009) Detection of functional modes in protein dynamics. PLoS Comput Biol 5: e1000480.