Albanian j. agric. sci. 2014;(Special edition) Agricultural University of Tirana
RESEARCH ARTICLE
(Open Access)
The performance evaluation of a local rabbit population
ALMA LLAMBIRI1, LUMTURI PAPA2, LUAN HAJNO1, RREZARTA MARIKA1,
1
Center of Agriculture Technology Transfer, Fushe – Kruja
2
Agriculture University of Tirana
*Corresponding author e-mail: [email protected]
Abstract
The aim of research was to evaluate productive performances of a local rabbit breed population, grown in semi intensive system, in floor pens of different size (130x100 cm vs. 250x100 cm), in groups of 10 heads. The study was carried out in a rabbit farm of Berati district, which lasted from 2009 to 2010. In total 90 heads of rabbits (50 heads females and 40 heads of male heads), were used in this study. The rabbits divided in groups of 10 heads each, were placed in floor pens. The feeding was similar to all groups (ad-libido). The productive indicators taken into account for each individual were; initial live weight (g), final live weight (g), live weight gain (g), average daily gain (g/d), feed intake (g.w.w), feed conversion rate (g.w.w/l.w) and carcass characteristics; slaughter weight, hot carcass weight (l h, g), reference carcasses weight, the front limbs weight, the rear limbs weight, the length of the carcasses, the weight of the head, liver weight, kidney weight, the weight of the heart, full gastrointestinal tract, weight trachea + esophagus + lung, esophagus weight, dressing percentage, reference carcass, total fat (g). The rabbits growth was favorable; It was noticed a slowdown of growing period of about 30 days, a deterioration of the average daily gain, respectively (from 30 to 23 g/d) and feed conversion rate (from 5.1 to 6.01 g w w/g l.w) but the could dressing percentage comparable to those grown in cages. Technical radius meat respectively (62.1 % females and 60.7 males), reference radius, respectively 52.8 females and 51.3 males and lean carcasses 1-1.5 % l.w. In conclusion, the productive performances of local breed reared in floor pens of different size, resulted more matured and therefore more acceptable to the consumer, although it was observed aslowdown of growth period
Key words; rabbit, floor pen rearing, productive performance, carcass characteristics.
1. Introduction
Local rabbit management in our country is a productive alternative with positive effects on the economy of small scale farms. Number of farms that raise rabbits not only for family consumption but also to market has recently increased. Consumer’s preference for local products and the concern increased from farmers for raising this species incited researchers to conduct studies about it. Their goals were to define the most appropriate ways of growth in small scale farms, mainly housing, comparatively studying alternative ways of rabbit growth in: (i) open environment, (ii) group; (iii) individual cages and their effects on the growth dynamics during the fattening period of rabbits as well as carcass quality [4; 1; 5; 6; 7; 8; 9; 2; 3]. In addition to that, the studies on the assessment of the productive performance indicators of rabbit local population were conducted by other researchers [1]. Certainly, it needs to be conducted other studies in order to create the possibilities of adopting the existing housing techniques and to meet the requirements of raising in
group as well as providing animal welfare and product quality.
2. Materials and methods
The trail was conducted in two consecutive stages. In total, 90 rabbits (50 male and 40 female) of local population were separated into groups, composed of 10 heads each. The rabbits put on fenced grounds of different sizes (130 x 100 cm vs. 250 x 100 cm) covered by ample straw layer. The same diet, based on alfalfa hay + supplement fed ad libitum to both groups. At the end of trail, 5 rabbits of each group were slaughtered after a fasting time of 12 hours. The live weights of rabbits before slaughtering were recorded. Carcass performance, measurements and weighing, were studied by the Blasco’s Methodology [12]. According to the methodology, the weights of: blood, skin, the terminal part of the tail, extremities of front and rear legs, gastrointestinal and uro genital tracts, head, liver, kidney heart, lung, esophagi, trachea were included in hot carcass weight. The carcass was divided according to the WRSA Rate [11]. The weights of front parts (shoulder and front legs) and rear parts (rounds and rear legs) were
Llambiri et al
expressed as the percentage to reference carcass weight. The killing out was estimated as a ratio of the weight of reference carcass and live weight before slaughtering. The trail was carried out for fattening period, first period was lasted 12 weeks (46-130 days) and second one lasted 9 and a half weeks. The analysis was carried out for technical indicators: initial and final live weight, live weight gain, average daily gain, feed intake, feed conversion rate, the slaughter weight, hot carcass weight, (1 h, g), cold carcass weight (24 h,g), weight of front part, weight of rear part, carcass length, head weight, filled gastrointestinal tract weight, kidney weight heart weight, weight of trachea + esophagus + lung, blood
weight, dressing percentage, weight of reference carcass, total fat weight. The data was analyzed by ANOVA method.
3. Results and discussio
Ages and body weights of rabbits were different due to the technical reasons. However, the results obtained at the end of experiment made possible to test that the differences in available spaces affect growth performance of rabbits.
Referring to the data in relation to the values of productive indicators of rabbit population studied and shown in table 1.
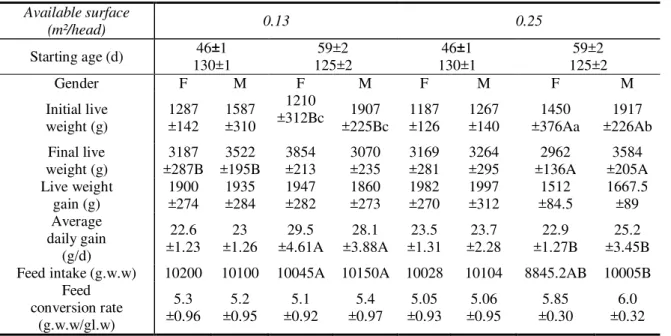
Table 1:Growth performance (mean ± s.d)
Available surface
(m²/head) 0.13 0.25
Starting age (d) 46±1 130±1
59±2 125±2
46±1 130±1
59±2 125±2
Gender F M F M F M F M
Initial live weight (g)
1287 ±142
1587 ±310
1210
±312Bc 1907 ±225Bc
1187 ±126
1267 ±140
1450 ±376Aa
1917 ±226Ab Final live
weight (g)
3187 ±287B
3522 ±195B
3854 ±213
3070 ±235
3169 ±281
3264 ±295
2962 ±136A
3584 ±205A Live weight
gain (g)
1900 ±274
1935 ±284
1947 ±282
1860 ±273
1982 ±270
1997 ±312
1512 ±84.5
1667.5 ±89 Average
daily gain (g/d)
22.6 ±1.23
23 ±1.26
29.5 ±4.61A
28.1 ±3.88A
23.5 ±1.31
23.7 ±2.28
22.9 ±1.27B
25.2 ±3.45B Feed intake (g.w.w) 10200 10100 10045A 10150A 10028 10104 8845.2AB 10005B
Feed conversion rate
(g.w.w/gl.w)
5.3 ±0.96
5.2 ±0.95
5.1 ±0.92
5.4 ±0.97
5.05 ±0.93
5.06 ±0.95
5.85 ±0.30
6.0 ±0.32
A,B: P<0.01; a,b,c:P<0.05
The rabbits raised in the fenced space of smaller dimensions (0.13 m2 ) shown higher daily gains compared to the rabbits raised in fenced space of larger dimensions (0.25 m2 ); (30 g vs 23g) respectively (P<0.01). The differences between groups of rabbits raised in the fenced space of various dimensions were noted in terms of feed consumption. The rabbits kept in the fenced space of smaller dimensions (0.13 m2) consumed larger intake of the feed, compared to other individuals raised in fenced space of larger dimensions (0.25 m2 ); (10200 g vs 8845.2 g ) respectively, as a consequence of the limited possibility for moving in a area of 0.13 m2 (P<0.01). Meanwhile, there is no significant differences for feed conversion rate, although higher values of feed conversion rate were in favor of rabbits kept in larger dimension space (0.25 m2 ), 6.0 g vs 5.1 g , respectively.
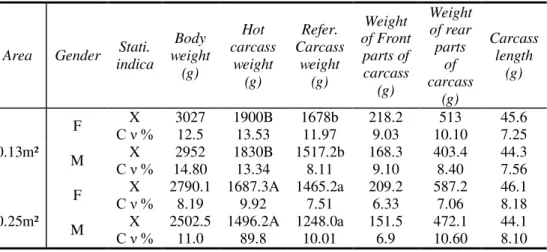
The results obtained from the studies conducted by lots of other authors [1; 4; 5],that treated the same argument but for other native breeds were approximate. Means of live weights of rabbits before slaughtering, hot carcass weight, reference carcass weight, carcass length and weight of legs are given in tables 2 and 3.
Coefficients of Variation (CV) were estimated for all these indicators.
As seen in table No.2 , values of means of hot and reference carcass weights depend on the dimensions of the area, where the rabbits are kept and animal’s sex.
Average values of killing out (%) (technical and reference) computed and shown in table 4 are slightly higher (62.1% females; 60.7%males) for rabbits kept in smaller fenced area (0.13 m²) (P<0.01) compared to the rabbits kept in larger fenced area (61%
The performance evaluation of a local rabbit population
females; 59.9% males), although the latter began to be kept in fenced ground area later.
Table 2: Means of carcass performance
Area Gender Stati. indica Body weight (g) Hot carcass weight (g) Refer. Carcass weight (g) Weight of Front parts of carcass (g) Weight of rear parts of carcass (g) Carcass length (g) 0.13m²
F C ν %X 3027
12.5 1900B 13.53 1678b 11.97 218.2 9.03 513 10.10 45.6 7.25
M C ν %X 2952
14.80 1830B 13.34 1517.2b 8.11 168.3 9.10 403.4 8.40 44.3 7.56 0.25m²
F C ν %X 2790.1
8.19 1687.3A 9.92 1465.2a 7.51 209.2 6.33 587.2 7.06 46.1 8.18
M C ν %X 2502.5
11.0 1496.2A 89.8 1248.0a 10.01 151.5 6.9 472.1 10.60 44.1 8.10 A,B: P<0.01; a,b,c:P<0.05
Table 3: Means of carcass performance
Area Gend Statist indicat Head weigh (g) Filled Gastro intestina tract. (g) Liver weigh (g) Kidney weight (g) Heart weigh (g) Weight of Esoph. and lung (g) Blood weigh (g) Fuer Weigh (g) 0.13m² F X
C ν %
156.6 3.65 358.1 13.3 108.2 21.30 21.2 9.42 10.3 5.8 28.5 9.11 65.2 1.65 374.0 8.6 M X
C ν %
134.3 4.31 396.4 12.4 97.3 23.12 18.1 8.12 10.0 0.00 23.1 4.51 63.6 2.02 346.5 10.10 0.25m² F X
C ν %
127.6 5.71 378.2 13.06 109.2 5.21 22.4 9.83 10.5 5.73 27.3 7.91 65.5 2.20 412.2 10.65 M X
C ν %
117.3 3.04 362.4 11.12 98.3 4.62 20.4 7.16 9.77 5.21 24.1 7.23 64.3 1.95 359.4 12.71
Table 4: Technical and reference carcass dressing percentage and fat
Super. Gender Dressing percentage % Reference carcass % Total
0.13m² F 62.1±0.3A 52.8±0.4 1.25±0.35a M 60.7±0.3AB 51.3±0.4 1.03±0.29b 0.25m² F 61.3±0.4B 51.9±0.3 1.50±0.45a M 59.9±0.4AB 50.8±0.3 1.07±0.32b
A,B: P<0.01; a,b,c:P<0.05
Refering to data, the females had higher percentage of fat (1-1.5 %) (P<0.05), compared to males
Conclusions
The Rabbits raised in group and kept in the fenced ground area showed good performance, a more maturated and pleasant product from consumers, although characterized by lower growth rate and
average daily gain as well as lower feed conversion rate but the killing out is comparable to the rabbits kept in cages [4; 8]
References
1. Lambertini L, et al: Allevamento alternativo del coniglio slettiera. Rivista di Coniglicoltura 2001: 38: (5): 57-60
Llambiri et al
2. Toscano P., Lazzaroni C, Zoccarato I, Benatti G:
Conversation and improvement of the Carmagnola Grey Rabbit. J. of Applied Rabbit Research 1992: 15: 240-246.
3. Toscano P., Lazzaroni C.: Il coniglio Grigio di Carmagnola. In Errante J (ed). Patrimonio zootecnico del Piemonte e della Valle d’Aosta: razze animali autoctone. Quaderni della Regione Piemonte Agricoltura. 1998: 13(suppl.): 71-72
4. Lazzaroni C. Biagini D: Allevamento rurale per il recupero delle razze autoctone: Il coniglio Grigio di Carmagnola. Atti del Convegno Nazionale Parliamo di ..zootecnica e sviluppo sostenibile Fossano 11-12 ottobre 2001: 235-238
5. Lazzaroni C., Biagini D.: Adattabilita del coniglio all’ingrasso a diverse tipologie di allevamento. Atti del Convegno Nazionale Parliamo di allevamento e benessere animale Fossano (Cuneo, Italia) 2000: 205-208
6. Lazzaroni C.: The Carmagnola Grey rabbit. In: Khalil M.H Baselga. M (eds). Book on rabbit genetic resources in Meditteranean Countries Options Mediterraneennes serie B 2002: n.38. CIEHAM, ISBN 2-85352-241-5: 141-150.
7. Pinheiro V., Silva S.R., Silva J.A.
,
Monteiro D.,Mourao J
.
Ll.:. Growth and carcasscharacteristics of rabbits housed in open-air standard systems. Verona Italy: World Rabbit Congress 9: June 2008: 10-13: 8.
8. Paci E.: Caracteristiche produttive di una populacione locale di conigli allevati con sistema biologico e convencionale. Annali della Facolta di Medicina Veterinaria 2008: LVII: Pp 249-256.
1. Toscano P., Zoccarato I., Benatti G., Lazzaroni C.:. Caratterizzazione e valorizzazione di una popolazione locale di conigli. Annali dell Accademia di Agricoltura di Torino 1991: Vol. CXXXIII 133: 85-98
2. Papa L., Daija A., Kume K.: The effect of sex and season of rearing on main features of carcass of local rabbit breed reared in small scale family farms conditions. International Symposium Biodiversity Conservation 2010: 35-39
3. Blasco A., Ouhayoun J., Masoero G.: Status of rabbit meat and carcass: Criteria and terminology, Optionts Mediterranean’s 1996: Serie Seminaire no 17: 105-120
4. Blasco A.: Estudio Genético y Selección de caracteres de crecimiento en el conejo de carne. Tesis Doctoral U.P.V. Valencia 1982: 203 pp.