Received December 8, 2010 and accepted July 11, 2011. Corresponding author: [email protected]
Performance, carcass characteristics and non-carcass components of
Texel × Santa Inês lambs fed fat sources and monensin
1Sandro Braga Soares2, Iraides Ferreira Furusho-Garcia3, Idalmo Garcia Pereira4, Danilo de Oliveira Alves5, Guilherme Rodrigues da Silva5, Amélia Katiane de Almeida6, Clenardo
Macedo Lopes2, Janaina Adna Barbosa Sena2
1Project financed by FAPEMIG.
2Programa de Mestrado em Zootecnia – DZO-UFVJM – Diamantina. 3DZO – UFLA – Lavras.
4DZO – UFVJM – Diamantina.
5Curso de Zootecnia – UVFJM – Diamantina.
6Programa de doutorado em Zootecnia – UNESP – Jaboticabal.
ABSTRACT - Performance, carcass, non-carcass and commercial cuts and components of Texel × Santa Inês crossbred lambs, managed in confinement and fed diets based on soybean oil, soybeans and a conventional diet, with or without the use of monensin (78 ppm dry matter basis) were evaluated. Thirty-six Texel × Santa Inês lambs (18 males and 18 females) were managed in intensive systems. Animals were slaughtered after 87 days of confinement, and performance, carcass characteristics, weight and percentages of carcass and non-carcass components were evaluated. The animals fed the control diet had heavier carcass and parts than animals fed soybean, while the oil diet did not differ from the controls in most parameters. The animals fed soybean showed lower intake kg dry matter (DM), organic matter (OM), crude protein (CP), neutral detergent fiber (NDF) and metabolizable energy (ME) compared with animals fed the control diet, increased ether extract (EE) intake in kg, % body weight (BW) and metabolic weight (MW) and did not differ from the soybean oil diet. Animals receiving monensin had lower DM intake, OM, CP, EE, NDF, gross energy (GE) regardless of the expression, % kg BW, or % PM, than the animals that did not receive the additive. Males produced better and had heavier cuts than the females; the latter deposited subcutaneous fat earlier. Animals that received oil or soybean showed greater body weight and small intestine percentage. Soybean oil intake did not improve performance, carcass weights or parts of Santa Ines × Texel lambs in confinement. Soybeans at 15% dry matter reduced energy intake and lamb performance. The use of monensin at 78 ppm on a dry matter basis is not recommended for lambs in confinement, especially if associated with oil or soybeans that may harm animal performance.
Key Words: efficiency, fat, feed, gain, sheep, weight
www.sbz.org.br
Introduction
The main purpose of sheep rearing nowadays is meat production, but the offer and quality of the commercial product are still bottlenecks to conquering a stable market. Crossing breeds may improve production, and the Texel breed is recommended for mating with the Santa Ines, which is known for earliness and carcass conformation. It is common to slaughter both females and males in this type of crossing, but the nutritional requirements for more productive genetic groups are greater so that the animal can produce meat properly.
Crossbred animal nutrition is of fundamental importance to increase performance, regarding both nutrient supply and cost. Thus, using ingredients to improve the energy in the diet, such as oil or oilseeds, allied to the use of ionophore, may be viable alternatives.
Fat sources in the diet can be used to raise the energetic density, improve performance and manipulate carcass quality (Yamamoto et al., 2005). According to Homem-Junior (2010), the inclusion sunflower grains or protected fat in the diet of confined lambs gives satisfactory yields, influencing the fat proportion and intestinal tract content. Soybean based products have a high percentage of unsaturated fatty acids, and soybean has an average of 75% unsaturated fat (Eifert et al., 2006). However, unsaturated fatty acids can affect the rumen fermentation (Muller et al., 2005) and the ways of including these ingredients have been constantly assessed for use in ruminant diets.
Using fat associated to ionophore/monensin is still polemic. The actions of these ingredients on the ruminal microorganisms and their reflection in the ruminant performance and productive characteristics have not yet been completely elucidated.
The objective of the present study was to assess performance, carcass, cut and non-carcass component yields of Santa Ines × Texel crossbred lambs managed in confinement, fed diets with soybean oil or soybean with or without the use of sodium monensin.
Material and Methods
The experiment was carried out in the Fazenda Experimental do Moura - Universidade Federal dos Vales do Jequitinhonha e Mucuri. Thirty-six lambs were assessed, 18 intact males and 18 females, from the crossing of female Santa Ines with Texel breed lambs.
After birth, lambs were weighed weekly and every event was recorded. Animals were weaned with average 15- ± 3.17-kg live weight and then randomly distributed in six experimental treatments, totaling six animals, three males and three females in each. Animals were confined in individual 0.96-m2 stalls, with feeding troughs, drinking
fountain and a trough for mineral salt. All the animals were wormed at the start of the experimental study.
Six experimental diets were assessed: control diet (CD), with soybean oil (SO), with soybeans (SB), control with monensin (CD+m), soybean oil and monensin (SO+m), soybeans and monensin (SB+m). The oil was mixed daily in the total diet to ensure 2% inclusion in the dry matter, while the monensin was added when the ingredients were mixed at the rate of 78 ppm. The diets (Table 1) were formulated to be isoprotein and iso-energetic in a 40:60% roughage:concentrate ratio, where the roughage used was Tifton 85 hay (Cynodon dactylon) chopped to 1- to 2-cm
particle size.
Diet was offered ad libertum once a day in the
morning when the intake was recorded and the supply for the following day calculated, with provision for 20% leftovers. Samples were collected from the diets offered and the daily leftovers of each animal, which were stored in a freezer (-18 °C) for later chemical analysis for calculation of nutrient intake.
The diet offered and leftover samples were pre-dried in a chamber at 55-60 °C, ground in Wiley type mill with a 1-mm mesh sieve and analyzed for dry matter (DM), mineral matter (MM), ether extract (EE) and crude protein (CP), according to the AOAC (1990), quoted by Silva & Queiroz (2002). The neutral detergent fiber (NDF) was determined using α-amylase and sodium sulfide, according to Van Soest et al. (1991). The non-fibrous carbohydrate content
Table 1 - Proportion of the ingredients and chemical composition of the experimental diets
* Calculated from the digestibility trial.
CD - control diet; SO - soybean oil diet; SB - soybeans diet; M - monensin; DM - dry matter; OM - organic matter; CP - crude protein; EE - ether extract; NFC - non-fibrous carbohydrates; NDF - neutral detergent fiber; ADF - acid detergent fiber; HEMI - hemicellulose; GE - gross energy; ME - metabolizable energy; Ca - calcium; P - phosphorus.
Diet
Ingredients (%) CD SO SB CD + M SO + M SB + M
Corn 45.6 40.2 42.5 45.1 39.4 41.6
Soybean meal 12.6 12.9 0 . 7 12.8 13.3 1 . 0
Tifton hay 40.0 43.1 40.2 40.3 43.6 40.6
Soybean oil 0 2 0 0 2 0
Soybeans 0 0 15.0 0 0 15.2
Monensin 0 0 0 0.0078 0.0078 0.0078
Mineral 1 1 1 1 1 1
Limestone 0 . 8 0 . 8 0 . 6 0 . 8 0 . 7 0 . 6
1 0 0 1 0 0 1 0 0 1 0 0 1 0 0 1 0 0
Nutrients (%)
DM 82.9 82.22 80.64 82.19 84.93 84.09
OM 78.28 77.46 75.76 76.96 80.56 79.74
CP 12.09 11.28 11.48 11.90 12.79 12.42
EE 3.64 4.77 5.54 3.13 5.01 5.82
NFC 43.61 37.28 39.41 45.86 34.47 46.38
NDF 36.04 41.92 38.69 33.87 43.36 31.03
ADF 19.24 18.78 19.29 15.60 20.89 14.0
HEMI 16.79 23.14 19.40 18.27 22.47 16.98
GE (Mcal/kg) 3.62 3.98 4.13 3.86 4.06 4.20
ME(Mcal/kg)* 2 . 2 1 . 7 2 . 0 1 . 6 2 . 0 1 . 5
Ash 4.62 4.75 4.88 5.24 4.37 4.35
Ca 0.52 0.52 0.44 0.52 0 . 5 0.44
was calculated subtracting the percentages of NDF, CP, EE and ash from 100. The quantity of heat produced was assessed by burning samples of the diets and leftovers in a calorimetric pump from which the gross energy (GE) was determined.
The experiment lasted 94 days. The first seven days were for the animals to adapt to the experimental diets and then followed by 87 experimental days with weekly weighing and daily feed sample collections. At the end of the confinement period, animals were fasted for 14 hours, weighed before and after, and slaughtered by stunning by brain concussion and cutting the jugular veins and carotid arteries. After slaughter, animals were skinned and eviscerated and hot carcasses, rumen/reticulum, omasum, abomasum, small intestine, large intestine, blood, liver, heart, spleen, lungs, pancreas, mesentery/fat (mesentery + fat), omental fat and heart fat were measured. After, the percentages of each component were calculated in relation to the empty body live weight, that was determined from the difference between the live weight after fasting and the weight of the digestive content.
The carcass was kept in a cold chamber at 0-4 °C for 24 hours, then it was weighed for determination of chilled carcass weight and after, hot carcass (HCY) and chilled (CCY) carcass yields were calculated in relation to the live weight after fasting. In the chilled carcass, after removing and weighing the kidneys, kidney fat, pelvic fat, neck, tail and measuring the subcutaneous fat thickness, between the 12th and 13th ribs, the carcass length was measured and
associated to its weight, for the carcass compactness calculation, following methodology by Cézar & Sousa (2007). The carcass was then longitudinally cut and the right carcass half was weighed, identified and placed in a freezer and the left carcass half was weighed and subdivided into the commercial cuts loin, shoulder, leg, rib/carré, breast/ flap, anterior limb and posterior limb, according to Santos et al. (2001), then weighed and their percentages were calculated in relation to the chilled carcass weight.
The crude and digestible nutrient intake (NI) was calculated as follows:
The metabolizable energy and digestible nutrient values were estimated from the in vivo digestibility experiments
conducted in parallel where the same experimental diets were tested with the same animal category.
A complete randomized design was used in a 3 × 2 × 2 factorial design with three conditions of fat sources (control diet without fat, diet with soybean, and diet with soybean oil), two monensin levels (0 and 78 ppm) and two genders (males and females), with three replications per treatment. The means were compared by the t-test at 5% probability with the initial weight used as a co-variable. The SASsoftware (Statistical Analysis System, version 9.0)was used.
Results and Discussion
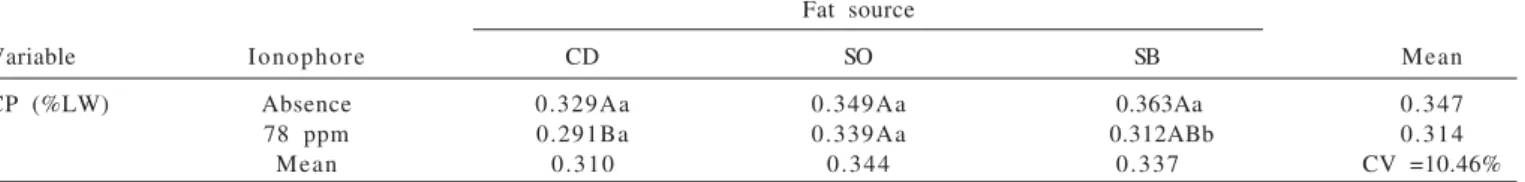
The influence of gender, monensin or fat source on nutrient intake was probably isolated because the interaction between these factors was not significant (P<0.05) except for crude protein intake, where there was interaction between the fat sources and monensin used (Table 2).
Crude protein intake in percentage of live weight, when monensin was added, was greater (P<0.05) for the soybean oil diet, but these values did not differ from the soybeans diet, which did not differ from the control diet. Thus, using monensin may have enhanced crude protein intake when the fat source in the diet was more readily available, as in the case of soybean oil, probably because energy was available in a more efficient and faster form that might optimize microbial growth, especially the species selected with the use of ionophore/monensin. Thus, protein intake increased as long as the oil level in the diet did not exceed limits that might damage rumen fermentation. When the fat source was soybean, the use of monensin decreased the crude protein intake (P<0.05; Table 2). There may have been alterations in the rumen fermentation pattern in function of the associative effect between soybean and monensin that altered the digestion rate in function of the permanence time
Fat source
Variable Ionophore CD SO SB Mean
CP (%LW) Absence 0.329Aa 0.349Aa 0.363Aa 0.347
78 ppm 0.291Ba 0.339Aa 0.312ABb 0.314
Mean 0.310 0.344 0.337 CV =10.46%
Means followed by different letters, uppercase in the rows and lowercase in the columns differed by t-test (P<0.05), in the rows, uppercase letters differentiate the fat sources and lower case letters in the columns differentiate the monensin influence.
CD - control diet; OS - soybean oil diet; SB - soybeans diet.
of the digest and passage rate. Unlike soybean oil, soybeans in the diet are the main source of protein and according to Hino et al. (1987), ionophore/monensin may decrease rumen degradation of the feed protein that could damage microbial growth and consequently decrease intake.
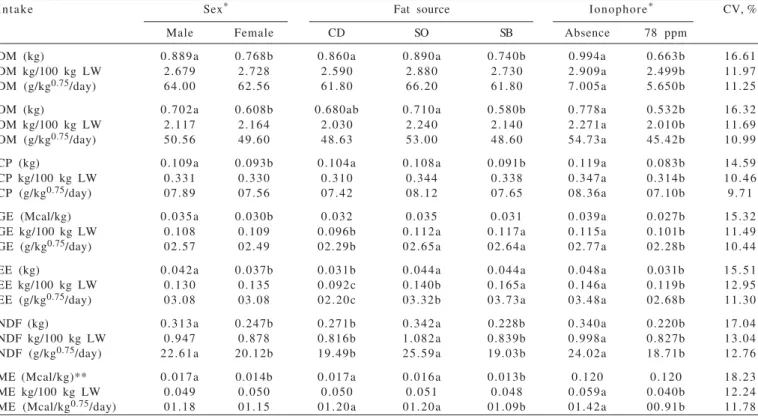
Dry matter intake (kg/day) differed (P<0.05) for gender, fat source and monensin presence (Table 3). Most of the intakes of the other nutrients (kg/day) were influenced similarly. Males obtained (P<0,05) higher intakes of nutrients (kg/day) due to their higher body weight compared to females (Table 4). There was no influence (Table 3) from gender considering the intakes as proportion of the live weight or metabolic unit size, except for NDF intake per metabolic unit size that was consumed in greater quantity by the males.
The animals fed soybeans diet presented lower (P<0.05) DM, CP and organic matter intakes (Table 3), probably because these nutrients were less degradable in the rumen and may have been associated to the form of the fat contained in the ground soybean compared with the soybean oil, and/or the possibility that the protein present in the soybean was little degraded, which favored less microbial growth in the rumen (Table 3). In addition, the intake of certain nutrients may have been affected by feed selectivity.
Monensin inclusion negatively affected (P<0.05) the intake of most of the nutrients (Table 3). The low nutrient intake by the animals fed monensin was probably due to the bitter flavor of the additive, which may have harmed the diet taste, especially considering that they were young animals in the full growth phase, a factor that probably increased the animal sensitivity to the ingredients with this characteristic. According to Araújo et al. (2006), ionophore/monensin functions as an appetite inhibitor because of its bitter flavor. In this sense, some authors supply the additive mixed with flavor enhancers and separated from the diet so the animals do not associate the monensin flavor to the diet (Araújo et al., 2006; Salles & Lucci (2000). These authors reported decreased nutrient intake due to the use of monensin in diets for rumeninants, but in most of the studies this decrease was accompanied by improvement in feed conversion, a result contrary to that found in the present study (Table 4). However, Kuss et al. (2008) reported low dry matter intakes and low weight gain in culled Charolais × Nellore cows fed 200 mg/animal/day.
The dry matter intake (kg/day) of the animals in the present study was lower than that reported by Ítavo (2008), who worked with crossbred lambs fed monensin and propolis in diets containing approximately 16% crude protein, with an average of 1.073 (kg/day). This author also reported
Intake Sex* Fat source Ionophore* CV, %
Male Female CD SO SB Absence 78 ppm
DM (kg) 0.889a 0.768b 0.860a 0.890a 0.740b 0.994a 0.663b 16.61
DM kg/100 kg LW 2.679 2.728 2.590 2.880 2.730 2.909a 2.499b 11.97 DM (g/kg0.75/day) 64.00 62.56 61.80 66.20 61.80 7.005a 5.650b 11.25
OM (kg) 0.702a 0.608b 0.680ab 0.710a 0.580b 0.778a 0.532b 16.32
OM kg/100 kg LW 2.117 2.164 2.030 2.240 2.140 2.271a 2.010b 11.69 OM (g/kg0.75/day) 50.56 49.60 48.63 53.00 48.60 54.73a 45.42b 10.99
CP (kg) 0.109a 0.093b 0.104a 0.108a 0.091b 0.119a 0.083b 14.59
CP kg/100 kg LW 0.331 0.330 0.310 0.344 0.338 0.347a 0.314b 10 . 4 6 CP (g/kg0.75/day) 07.89 07.56 07.42 08.12 07.65 08.36a 07.10b 9.71
GE (Mcal/kg) 0.035a 0.030b 0.032 0.035 0.031 0.039a 0.027b 15.32
GE kg/100 kg LW 0.108 0.109 0.096b 0.112a 0.117a 0.115a 0.101b 11.49 GE (g/kg0.75/day) 02.57 02.49 02.29b 02.65a 02.64a 02.77a 02.28b 10.44
EE (kg) 0.042a 0.037b 0.031b 0.044a 0.044a 0.048a 0.031b 15 . 5 1 EE kg/100 kg LW 0.130 0.135 0.092c 0.140b 0.165a 0.146a 0.119b 12.95 EE (g/kg0.75/day) 03.08 03.08 02.20c 03.32b 03.73a 03.48a 02.68b 11.30
NDF (kg) 0.313a 0.247b 0.271b 0.342a 0.228b 0.340a 0.220b 17.04
NDF kg/100 kg LW 0.947 0.878 0.816b 1.082a 0.839b 0.998a 0.827b 13.04 NDF (g/kg0.75/day) 22.61a 20.12b 19.49b 25.59a 19.03b 24.02a 18.71b 12.76
ME(Mcal/kg)** 0.017a 0.014b 0.017a 0.016a 0.013b 0.120 0.120 18.23 ME kg/100 kg LW 0.049 0.050 0.050 0.051 0.048 0.059a 0.040b 12.24 ME (Mcal/kg0.75/day) 01.18 01.15 01.20a 01.20a 01.09b 01.42a 00.91b 11.78
* Different letters indicate different means by t-test at 5% probability. ** Calculated from the apparent digestibility coefficient.
CD - control diet; SO - soybean oil diet; SB - soybeans diet; DM - dry matter; MO - organic matter; CP - crude protein; GE - gross energy; EE - ether extract; NDF - neutral detergent fiber; ME - metabolizable energy.
Table 3 - Nutrient intake means in (kg/day) (kg), live weight (LW) portion (kg/100 kg LW) and per metabolic unit size (g/kg0.75/day)
decrease in dry matter intake in the diet containing monensin and lower final weight, but greater feed efficiency, which did not occur in the present study (Table 4). The difference for the animals fed diet with soybeans and those fed monensin was that the low intake of the animals fed with the additive was probably caused by the taste of the diet, while it was probably caused by metabolic digestive issues for the animals fed soybean, as for example, some loss in the microbial growth in the rumen in function of the protein associated to the soybean fat and/or loss in the intestinal digestion due to the presence of anti-nutritional factors (Westwood et al., 1998), including tripsin, urease and hemagglutinin inhibitors ((Reddy et al., 1993). In addition, soybean supplies more fat, but soybean oil can reach the degradation and metabolism more quickly, as long as it is supplied in quantities where fat does not harm the degradation process, either by the fiber cover or by the direct losses to the rumen microorganisms. Alves (2001) reported that soybean had a high digestibility rate in the rumen, but when associated to fat, the degradation efficiency may not have been synchronized. Urano et al. (2006) and Luginbuhl et al. (2000) worked with increasing soybean and cottonseed levels for lambs and goats, respectively, and observed linear reduction in the protein and dry matter intake with increase in the ether extract content. These authors related this effect to meeting the energetic requirements and consequent intake inhibition. Yanxia et al. (2009) did not report significant differences in the dry matter intake for cows fed flax seed and soybean compared with the control diet. However, these authors reported greater numerical intake value for the diet with oilseeds: 15.70, 17.00 and 16.46 (kg/day) for the control, flaxseed and soybean, respectively.
There was an increase in the ether extract intake in the following increasing order: control diet, soybean oil and soybeans (Table 3), regardless of monensin use. There was a small increase in the NDF contents in the diets with soybean oil (Table 1), which may have positively affected the intake of this nutrient.
Comparison of the gross energy and metabolizable energy intakes (Table 3) showed the inefficiency of the diet with soybean because the animals fed soybean as fat source presented higher gross energy intake compared with the live weight and per metabolic unit size. However, the metabolizable energy intake was lower in these diets probably because the soybean they contained may have resulted in less ruminal degradablity and/or intestinal digestibility due to the processes reported previously.
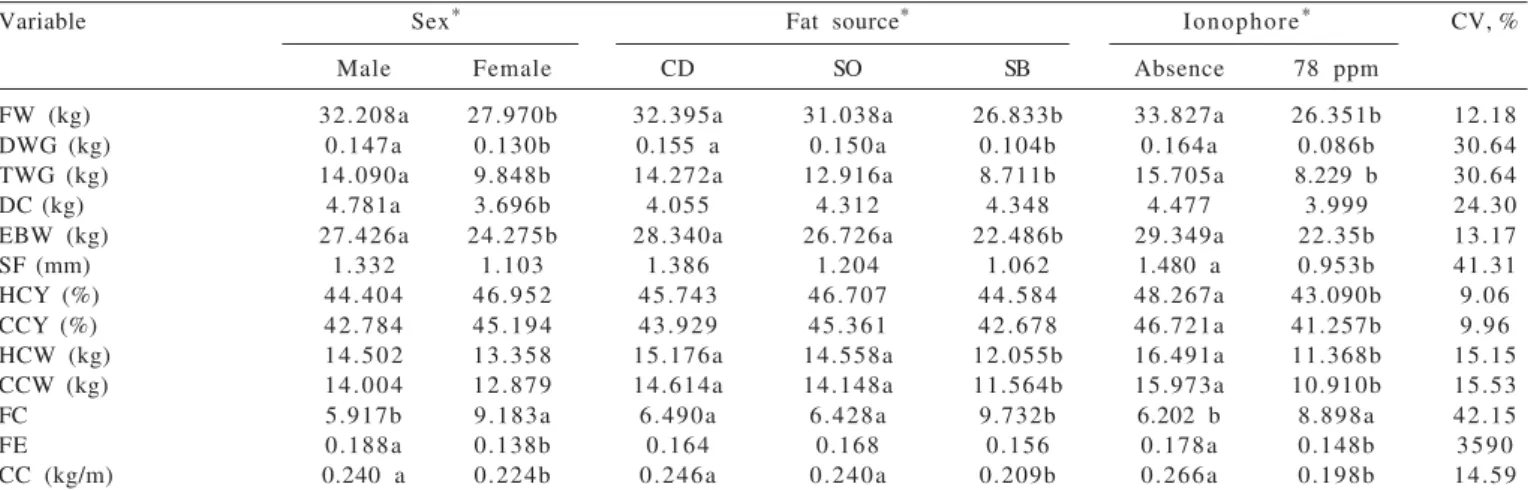
There were no significant interactions between gender, ionophore/monensin and fat source for the performance and carcass characteristics (Table 4). Males were superior (P<0.05) compared with the females for the variables final weight, total weight gain, daily weight gain, digestive content weight and feed conversion (Table 4). This was due to the better performance of the males because they deposited more lean tissue. Gonçalves (2009) reported that males have greater muscle mass development in the neck and females have greater development in the abdominal region. Berg & Butterfield (1976) reported difference in male and female growth because males are tardier and later animals and thus have more time for lean tissue deposition, they are heavier and have less energy requirement for deposition.
The use of 2% soybean oil in the diet did not influence (P<0.05) any of the characteristics studied concerning the control diet, that is, there was no effect on lamb performance when soybean oil was used as fat source (Table 4) at the
Variable Sex* Fat source* Ionophore* CV, %
Male Female CD SO SB Absence 78 ppm
FW (kg) 32.208a 27.970b 32.395a 31.038a 26.833b 33.827a 26.351b 12.18
DWG (kg) 0.147a 0.130b 0.155 a 0.150a 0.104b 0.164a 0.086b 30.64
TWG (kg) 14.090a 9.848b 14.272a 12.916a 8.711b 15.705a 8.229 b 30.64
DC(kg) 4.781a 3.696b 4.055 4.312 4.348 4.477 3.999 24.30
EBW (kg) 27.426a 24.275b 28.340a 26.726a 22.486b 29.349a 22.35b 13.17
SF(mm) 1.332 1.103 1.386 1.204 1.062 1.480 a 0.953b 41.31
HCY (%) 44.404 46.952 45.743 46.707 44.584 48.267a 43.090b 9.06
CCY (%) 42.784 45. 1 9 4 43.929 45.361 42.678 46.721a 41.257b 9.96 HCW (kg) 14.502 13.358 15.176a 14.558a 12.055b 16.491a 11.368b 15.15 CCW (kg) 14.004 12.879 14.614a 14.148a 11.564b 15.973a 10.910b 15.53
FC 5.917b 9.183a 6.490a 6.428a 9.732b 6.202 b 8.898a 42.15
FE 0.188a 0.138b 0.164 0.168 0.156 0.178a 0.148b 3 5 9 0
CC (kg/m) 0.240 a 0.224b 0.246a 0.240a 0.209b 0.266a 0.198b 14.59
* Different letters indicate different means by t-test at 5% probability.
CD - control diet; SO - soybean oil diet; SB - soybeans diet; FW - final weight (kg); DWG - daily weight gain (kg/day); TWG - total weight gain; DC - digestive content; EBW - empty body weight; SF - subcutaneous fat; HCY - hot carcass yield; CCY - chilled carcass yield; HCW - hot carcass weight; CCW - chilled carcass weight; FC - feed conversion; FE - feed efficiency; CC - carcass compactness.
level tested. Yamamoto et al. (2005) studied fat sources in feeding Santa Ines lamb reared in confinement and reported better performance for animals fed diet without soybean oil for weight gain compared with the diet with 3% of this ingredient. Several authors have reported reduction in rumen fermentation when fat was added to the diet (Santos et al., 2001b; Silva et al., 2007a, b; Oliveira et al., 2009; Silva et al., 2010). Ito et al. (2010) worked with (half blood) Nellore × Simental crossbred cattle in confinement, fed diet with soybean oil and flaxseed and did not report differences for the variables initial weight, final weight, average daily gain, carcass weight, carcass yield and backfat thickness. Soybean in the diet resulted in poorer animal performance for final weight, total weight gain and daily weight gain, empty body weight, feed conversion, carcass compactness, and hot and chilled carcass weights (Table 4). The poor performance with the use of soybean can be explained by digestion problems of the protein and/or of the total diet and proved by the lower gross energy contents and metabolizable energy intakes (Table 3). Moreover, the data from the digestibility trial showed reduced coefficients of protein digestibility and dry matter, in addition to indicating probable hepatic problems occurring in the animals fed this diet. Alves (2001) reported that the high ruminal digestibility rates of soybean proteins may result in nitrogen loss through urine and hepatic ammonia overload, and may even damage performance. Inactivation of anti-nutritional factors (proteases inhibitors) present in soybean by the rumen microorganism activity was probably not efficient, leading to decreased intestinal digestion of the fraction that escaped from the rumen degradation (Westwood et al., 1998). The animals fed soybean in the diet were lambs in the growth phase and probably did not have a completely developed rumen during the experimental phase that may have enhanced the action of the anti-nutritional factors present in the soybean.
Grande et al. (2009) worked with ¾ Boer + ¼ Saanen goats, slaughtered at 30-kg live weight and did not report differences with oilseed addition (flax seeds, sunflower and rape) in the diet for the following characteristics: live weight at slaughter, hot carcass weight, true carcass yield, commercial carcass yield, carcass compactness, leg compactness and confirmation index, compared with the control diet. However, the same authors reported better results in the carcass compactness index, greater fat cover and less loss through chilling in the animals fed the control diet. In the present study, the animals fed diet containing ionophore/monensin presented low means (Table 4) for all the variables, except for digestive content. Salles & Luci (2000) worked with high concentrate diet for Frisian steer
and increasing monensin levels (0, 0.4, 0.8 and 1.2 mg/kg live weight) and observed quadratic regression for the weights of hot and chilled carcass, empty weights and meat cuts and the values increased with the monensin level of 0.4 and 0.8 compared with the control, but they observed reductions for the 1.2-mg treatment.
The final live and hot and chilled carcass weights of the animals not fed monensin or soybean were higher than those reported by Silva Sobrinho (2001) to characterize good-quality carcasses, and the means were 31.0, 14.3 and 13.8 kg, respectively (Table 4). The hot carcass yield was also similar to that reported by this author, with a median of 46%.
The poor performance of the animals fed diet containing ionophore/monensin was probably due to depressed nutrient intake (Table 3), caused by the bad taste of this additive. According to Araújo et al. (2006), ionophore/ monensin functions as an appetite inhibitor because of its bitter taste. These authors reported that the effects of ionophore/monensin are various and variable due to the differences between animals, body conditions, diet and physiological stages. Rodrigues et al. (2001) and Borges et al. (2008) reported that the responses obtained using ionophore/monensin were very variable and could be explained in part by the different experimental conditions. It has also been reported that the conditions necessary to improve the digestibility and performance of the animals fed ionophore/monensin have not been defined to date and may be influenced by factors such as feed intake, rumen filling or passage rate (Borges et al., 2008).
Feed conversion was best for the lambs not fed monensin (Table 4) and these results were contrary to those reported by Campos Neto et al. (1995), of 4.5% and 3% decreases for cows fed 300 mg monensin/animal/day compared with those not fed the additive and those that received a dose of 150 mg/animal/day, respectively. The conversion data reported in the present study were lower than those reported by Yamamoto et al. (2005): 3.50; 3.57; 3.89 and 3.95 for Santa Inês × Dorper lambs, in confinement fed control diet and diet with (3%) soybean oil, rapeseed oil or flaxseed oil, respectively. The same occurred for daily weight gain when these authors reported an average of 0.272 (kg/day), higher than the means observed in the present experiment.
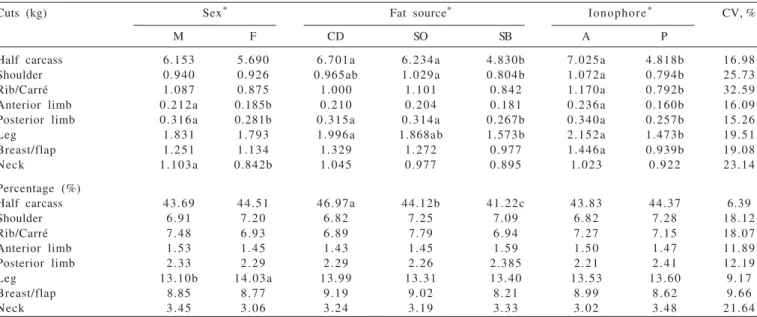
superiority of the males was expected due to their larger body sizes. According to Gonçalves (2009), males have greater muscle mass development in the neck and females have greater development in the abdominal region.
The animals fed the diet with soybean presented lighter cuts (half carcass, shoulder, upper shank and leg) (Table 5). The low intake of the animals fed this diet resulted in poor performance and consequently lighter commercial cuts. A similar result occurred for the animals that received monensin in the diet.
Except for the half carcass, leg and loin, there was no influence from gender, fat source and monensin presence on the proportions of the carcass cuts (Table 5). The females presented higher percentages for the leg. The greatest half carcass percentage proportions occurred in the animals fed the control diet followed by the animals fed soybean oil and low percentage values occurred for the animals fed soybeans. It was expected that animals with better nutrient intake and higher gains would present greater carcass yields and, in the present study, low results were observed in these aspects for the animals fed soybean.
Without monensin inclusion there was a lower percentage of loin in the females compared with the males. It is important to stress that the high percentage values for the treatments with poor results for the performance characteristics were probably due to the small variation in the weight of some cuts.
Monensin reduced most of the weights of the cuts (Table 5), an expected effect due to the lower live weight at slaughter caused by this additive. However, for the loin,
because of the significant fat source - ionophore/monensin interaction in the diets with ionophore/monensin, the value was lower when soybean was used, while in the diets without monensin the use of soybean oil resulted in lighter loin than in the control diet, but heavier than in the diet with soybean (Table 6). Regardless of the fat source used, monensin presence in the diet resulted in lighter loin weights. There was significant gender - ionophore/monensin presence interaction for the proportion of loin compared with the chilled carcass (Table 7). The diets with monensin resulted in a smaller loin percentage in both males and females, but in the absence of monensin, males presented greater loin proportion than the females.
It should be taken into consideration that the differentiated tissue growth in the loin may have been the cause of the results reported above. According to Furusho-Garcia et al. (2009), the loin muscle in Santa Ines × Texel crossbred lambs grows early, which consequently makes the loin more easily influenced by the body weight that is affected by the diet (Furusho-Garcia et al., 2004). Thus, in the present study, the diet containing soybean, because it affected the slaughter weight, consequently affected the loin weight and its proportion was affected by monens, which also resulted in lower slaughter weight.
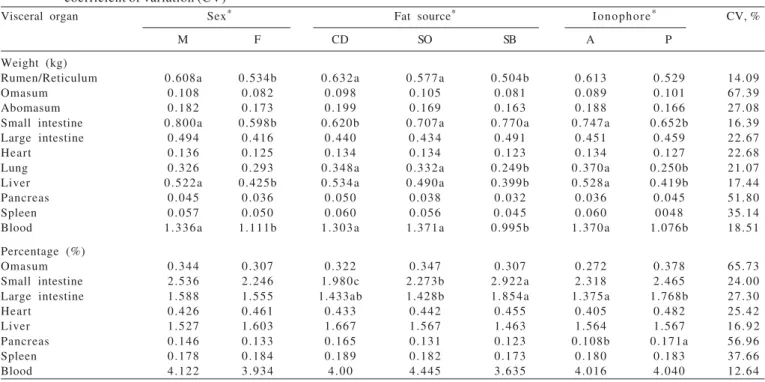
The rumen/reticulum and lung weights were greater (P<0.05) for the control diet and the diet with soybean oil (Table 8). This performance resulted from the greater body weights of these animals at slaughter. In the case of the rumen/reticulum, it is important to report the expected result in the control diet because, theoretically, this performance
Cuts (kg) Sex* Fat source* Ionophore* CV, %
M F CD SO SB A P
Half carcass 6.153 5.690 6.701a 6.234a 4.830b 7.025a 4.818b 16.98
Shoulder 0.940 0.926 0.965ab 1.029a 0.804b 1.072a 0.794b 25.73
Rib/Carré 1.087 0.875 1.000 1.101 0.842 1.170a 0.792b 32.59
Anterior limb 0.212a 0.185b 0.210 0.204 0.181 0.236a 0.160b 16.09 Posterior limb 0.316a 0.281b 0.315a 0.314a 0.267b 0.340a 0.257b 15.26
Leg 1.831 1.793 1.996a 1.868ab 1.573b 2.152a 1.473b 19.51
Breast/flap 1.251 1.134 1.329 1.272 0.977 1.446a 0.939b 19.08
Neck 1.103a 0.842b 1.045 0.977 0.895 1.023 0.922 23.14
Percentage (%)
Half carcass 43.69 44.51 46.97a 44.12b 41.22c 43.83 44.37 6.39
Shoulder 6.91 7.20 6.82 7.25 7.09 6.82 7.28 18.12
Rib/Carré 7.48 6.93 6.89 7.79 6.94 7.27 7.15 18.07
Anterior limb 1.53 1.45 1.43 1.45 1.59 1.50 1.47 11.89
Posterior limb 2.33 2.29 2.29 2.26 2.385 2.21 2.41 12.19
Leg 13.10b 14.03a 13.99 13.31 13.40 13.53 13.60 9.17
Breast/flap 8.85 8.77 9.19 9.02 8.21 8.99 8.62 9.66
Neck 3.45 3.06 3.24 3.19 3.33 3.02 3.48 21.64
* Different letters indicate different means by t-test at 5% probability.
M - male; F - female; CD - control diet; OS - soybean oil diet; SB - soybeans diet; A - monensin absence; P - monensin presence.
accounted for the greater part of the energy digestion compared with the other diets that contained fat source.
The difference in the body weight between males and females also interfered in the weights of the rumen/reticulum, small intestine and blood and males were heavier (Table 8). The presence of monensin in the diet resulted in lower weights for the lungs, small intestine and blood (Table 8),
indicating that the metabolism of these organs was probably damaged because of the poor performance resulting from the diets containing ionophore/monensin that caused lower intake that may have been related to the diet taste.
There were significant interactions between ionophore/ monensin and gender for the rumen/reticulum, abomasum and lungs (Table 9). For the females, the diets with ionophore/monensin resulted in greater rumen/reticulum and omassum percentages compared with the diets without monensin. This was probably due to the lower body weight of the females, especially when fed monensin (Table 4), associated to the metabolism of these digestive organs.
The lungs of the males fed monensin had a lower percentage participation compared with the males that did not have ionophore/monensin in the diets and compared with the females that consumed monensin (Table 9).
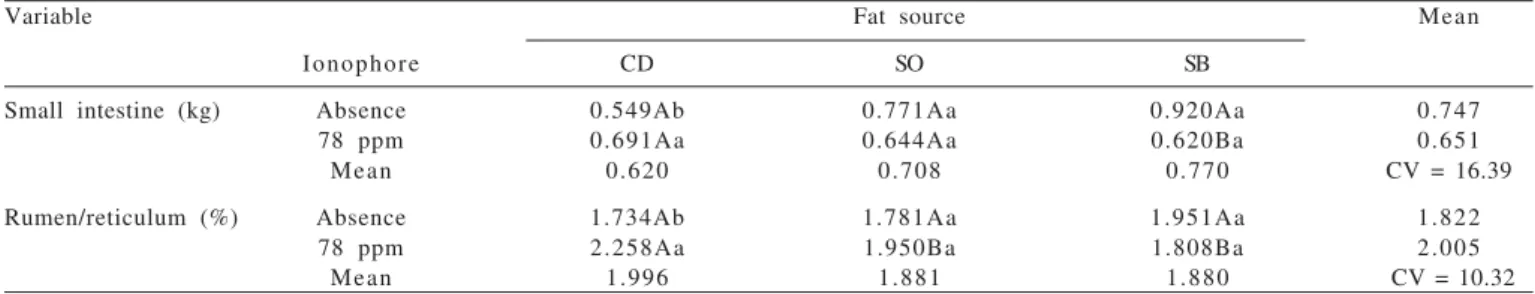
The small intestine weight was greater when monensin was added to the diet without fat sources (Table 10). In the
Variable Fat source Mean
Ionophore CD SO SB
Loin (kg) Absence 0.644Aa 0.517Ba 0.379Ca 0.513
78 ppm 0.329Ab 0.328Ab 0.230Bb 0.296
Mean 0.486 0.422 0.305 CV = 15.49
Different letters, uppercase in the rows and lowercase in the columns indicate different means by the t-test at 5% probability. CD - control diet; SO - soybean oil diet; SB - soybeans diet.
Table 6 - Loin weight of Santa Ines × Texel crossbred lambs in function of fat source and ionophore/monensin content and coefficient of variation (CV)
Variable Ionophore Mean
Sex Absence 78 ppm
% Loin Male 3.137Ab 2.616Ba 2.876 Female 3.239Aa 2.789Ba 3.014
Mean 3.188 2.703 CV = 10.59 * Different letters, uppercase in the rows and lowercase in the columns, indicate
different means by t-test at 5% probability.
CD - control diet; SO - soybean oil diet; SB - soybeans diet.
Table 7 - Loin percentage in relation to chilled carcass weight of Santa Ines × Texel crossbred lambs in function of gender and ionophore/monensin content and coefficient of variation (CV)*
Visceral organ Sex* Fat source* Ionophore* CV, %
M F CD SO SB A P
Weight (kg)
Rumen/Reticulum 0.608a 0.534b 0.632a 0.577a 0.504b 0.613 0.529 14.09
Omasum 0.108 0.082 0.098 0.105 0.081 0.089 0.101 67.39
Abomasum 0.182 0.173 0.199 0.169 0.163 0.188 0.166 27.08
Small intestine 0.800a 0.598b 0.620b 0.707a 0.770a 0.747a 0.652b 16.39 Large intestine 0.494 0.416 0.440 0. 4 3 4 0.491 0.451 0.459 22.67
Heart 0.136 0.125 0.134 0.134 0.123 0.134 0.127 22.68
Lung 0.326 0.293 0.348a 0.332a 0.249b 0.370a 0.250b 21.07
Liver 0.522a 0.425b 0.534a 0.490a 0.399b 0.528a 0.419b 17.44
Pancreas 0.045 0.036 0.050 0.038 0.032 0.036 0.045 51.80
Spleen 0.057 0.050 0.060 0.056 0. 0 4 5 0.060 0 0 4 8 35.14
Blood 1.336a 1.111b 1.303a 1.371a 0.995b 1.370a 1.076b 18.51
Percentage (%)
Omasum 0.344 0.307 0.322 0.347 0.307 0.272 0.378 65.73
Small intestine 2.536 2.246 1.980c 2.273b 2.922a 2.318 2.465 24.00 Large intestine 1.588 1.555 1.433ab 1.428b 1.854a 1.375a 1.768b 27.30
Heart 0.426 0.461 0.433 0.442 0.455 0.405 0.482 25.42
Liver 1.527 1.603 1.667 1.567 1.463 1.564 1.567 16 . 9 2
Pancreas 0.146 0.133 0.165 0.131 0.123 0.108b 0.171a 56.96
Spleen 0.178 0.184 0.189 0.182 0.173 0.180 0.183 37.66
Blood 4.122 3.934 4.00 4.445 3.635 4.016 4.040 12.64
* Different letters indicate different means by the t-test at 5% probability.
M - male; F - female; CD - control diet; SO - soybean oil diet; SB - soybeans diet; A - monensin absence; P - presence of monensin.
Variable (%) Ionophore Mean
Sex Absence 78 ppm
Rumen/ Male 1.870Aa 1.910Aa 1.890 Reticulum Female 1.773Ba 2.100Aa 1.937
Mean 1.822 2.005 CV = 10.32
Abomasum Male 0.598Aa 0.548Aa 0.573 Female 0.546Bb 0.752Aa 0.650
Mean 0.572 0.650 CV = 28.54
Lung Male 1.163Aa 0.838Bb 1.00 Female 1.032Aa 1.085Aa 1.059
Mean 1.098 0.962 CV = 20.56
* Different letters, uppercase in the row and lowercase in the column indicate different means by t-test at 5% probability.
Table 9 - Mean of the percentages of rumen/reticulum, abomasum and lungs in function of the partitioning of the interaction between gender and ionophore/ monensin presence and coefficient of variation (CV)
diet containing monensin, soybean presence resulted in lower weight for the small intestine that may have been due to a smaller ruminal proteolysis on the effect of the additive and this protein had to be digested in the abomasum and small intestine that demanded more of these organs and probably caused their hypertrophy. True vegetable protein can have greater digestive complexity compared with microbial protein depending on the source (Santos, 2001a, 2006 e 2001b). Regarding the soybeans diet that had a high fat content, decreased biohydrogenation caused by monensin may haveenhanced the increase in unsaturated fatty acids to the small intestine reducing the efforts of this organ to digest and absorb fats that led to its smaller development.
For the rumen/reticulatum, monensin presence resulted in a greater proportion of this digestive compartment in the diet without fat source (Table 10). This fact may be related to a probably higher feed degradation rate in these compartments because the microbial action was optimized with the use of ionophore/monensin, but in this case, without the presence of fat sources in the diet. Thus, in spite of the low intake for the diets containing monensin,
the relative development of the rumen/reticulum was better than that of other compartments, considering that in absolute weight it tended to be low in the diets with monensin (Table 8).
Animals in the treatments that resulted in better performance, that is, that were fed diets without fat source or monensin, obtained heavier demand organs (Tables 8, 9 and 10). The visceral organs were greatly influenced by the animal performance, because in animals without food restriction the organs have weight variations proportionally lower compared with body weight so that the percentage values, calculated from the animal weight, increase.
There was probably change in the energy digestion location with greater ether extract content in the diet because the animals fed the control diet had higher rumen/reticular weights and percentages, which is the site of energy digestion, while for the animals fed diets with fat, part of the energy came from the fat, with digestion mainly in the small intestine, which had greater weight and percentage.
Concerning weight and percentage means of the fat deposits, where the males presented lower values for kidney and heart fat (Table 11). This performance was expected because females are more efficient in fat metabolism due to early growth, lower adult weight and greater fat accumulation resulting from the action of their sex hormones.
The better performance of the animals that did not receive ionophore/monensin positively influenced the kidney and omental fat weights, back fat thickness and omental fat percentage of these animals (Table 11).
There was significant interaction between fat source and gender for the mesentery/fat weight (Table 12). The mesentery weight seemed to increase when the ether extract content increased in the diet, but the results were not precise because the diet with soybean inclusion resulted in poor animal performance that consequently influenced the mesentery weights. The mesentery fat in this experiment was measured with the mesentery, so it would be expected that with better performance this component would weigh
Variable Fat source Mean
Ionophore CD SO SB
Small intestine (kg) Absence 0.549Ab 0.771Aa 0.920Aa 0.747
78 ppm 0.691Aa 0.644Aa 0.620Ba 0.651
Mean 0.620 0.708 0.770 CV = 16.39
Rumen/reticulum (%) Absence 1.734Ab 1.781Aa 1.951Aa 1.822
78 ppm 2.258Aa 1.950Ba 1.808Ba 2.005
Mean 1.996 1.881 1.880 CV = 10.32
* Different letters uppercase in the row and lowercase in the columns, indicate different means by t-test at 5% probability. CD - control diet; SO - soybean oil diet; SB - soybeans diet.
more because heavier animals metabolize a greater quantity of nutrients and theoretically would depend on a more developed mesentery for transport. It is important to know that the animals on the diet with soybean obtained a small numerical value for the weight of this deposit but the percentage that regulated the weight factor showed that this group presented intermediate value.
The mesentery weight of the females increased with increase in the ether extract content, resulting from the use of a fat source in the diet. However, between the two sources tested, the use of soybean oil resulted in greater weight for this deposit. The interpretation of these data was confused because the diet with soybean presented numerically greater ether extract content (Table 1). However, the diet with soybeans resulted in poor performance compared with the diet with soybean oil and may have contributed to the low mesentery weight in this group. Because it was a fat-related parameter, this difference between the fat sources and the control diet was only detected in the females because they naturally deposited more fat than the males. Males presented greater mesentery weight compared with females only in the control diet and there was no difference between males and females fed diets with the use of a fat source.
Conclusions
The use of 2% soybean oil in the diets of Santa Ines × Texel crossbred lambs did not alter intake, performance, carcass or non-carcass characteristics. Raw soybean used at 15% in Santa Ines × Texel crossbred lambs harms performance, chilled carcass yield, leg and loin weights and the loin yield. The use of sodium monensin at 78 ppm is not recommended, especially associated to raw soybean, in the diet for male and female Santa Ines × Texel crossbred lambs during the growth phase, since it diminishes intake and consequently reduces performance, carcass characteristics and carcass and non-carcass components.
References
ALVES, M.F.C.C. Avaliação metabólica de vacas leiteiras alimentadas com grão de soja cru e tratado com calor. 2001. 81f. Dissertação (Mestrado em Ciências Veterinárias) -Universidade Federal do Rio Grande do Sul, Porto Alegre. ARAUJO, J.S.; PEREZ, J.R.O.; PAIVA, P.C.A. et al. Efeito da monensina
sódica no consumo de alimentos e pH ruminal em ovinos. Archives of Veterinary Science, v.11, n.1, p.39-43, 2006.
BERG, R.T.; BUTTERFIELD, R.M. N e w c o n c e p t s o f c a t l e growth. Sydney: Sydney University Press, 1976. 255p. BORGES, L.F.O.; PASSINI, R.; MEYE, P.M. et al. Efeitos da
enramicina e monensina sódica sobre a digestão de nutrientes
Body fat deposits Sex* Fat source* Ionophore* CV, %
M F CD SO SB A P
Weight (kg)
Pelvic 0.045 0.046 0.048 0.047 0.046 0.048 0.042 38.16
Renal 0.306b 0.401a 0.301 0.400 0.360 0.400a 0.305b 31.66
Omental 0.481 0.419 0.515 0.485 0.350 0.574a 0.327b 34.78
Heart 0.059b 0.085a 0.061 0.083 0.072 0.082 0.063 42.80
Percentage (%)
Mesenteric 0.958 0.993 0.823 1.081 1.021 0.980 0.970 26.97
Pelvic 0.142 0.164 0.129 0.152 0.179 0. 1 4 5 0.162 45.19
Renal 0.945b 1.402a 0.886 1.284 1.351 1.183 1.164 37.89
Omental 1.22b 1.620a 1.49 1.56 1.212 1.651a 1.190b 30.27
Heart 0.193b 0.315a 0. 2 0 7 0.280 0.274 0.254 0.254 40.33
Table 11 - Weight and percentage means of body fat deposits in lambs fed diets with soybean oil associated to monensin and coefficient of variation (CV)
* Different letters indicate different means by the t-test at 5% probability.
M - male; F - female; CD - control diet; OS - soybean oil diet; SB - soybeans diet; A - monensin absence; P - monensin presence.
Variable Sex Fat source Mean
CD SO SB
Mesenteric fat (kg) Male 0.339Aa 0.317Aa 0.261Aa 0.306
Female 0.204Cb 0.351Aa 0.275Ba 0.276
Mean 0.272 0.334 0.268 CV = 21.17
Different letters, uppercase in the row and lowercase in the columns, indicate different means by the t-test at 5% probability. * CD - control diet; OS - soybean oil diet; SB - soybeans diet.
em bovinos alimentados com dietas contendo alto nível de concentrados. Revista Brasileira de Zootecnia, v.37, n.4, p.674-680, 2008.
CAMPOS NETO, O.; RAMOS, A.A.; ECOBAR, M.J. et al. Avaliação da monensina sódica em vacas leiteiras. Scientia Agrotecnica, v.52, n.2, p.268-273, 1995.
CEZAR, M.F.; SOUZA, W.H. Carcaças ovinas e caprinas: obtenção, avaliação e classificação. Uberaba: Editora Agropecuária Tropical, 2007. 231p.
EIFERT, E.C.; LANA, R.P.; LANNA, D.P.D. et al. Perfil de ácidos graxos e conteúdo de ácido linoléico conjugado no leite de vacas alimentadas com combinação de óleo de soja e fontes de carboidratos na dieta. R e v i s t a B r a s i l e i r a d e Z o o t e c n i a, v.35, n.4, p.1829-1837, 2006.
FERELI, F.; BRANCO, A.F.C.; JOBIM, C.C. et al. Monensina sódica e Saccharomyces cerevisiae em dietas para bovinos:
fermentação ruminal, digestibilidade dos nutrientes e eficiência de síntese microbiana. Revista Brasileira de Zootecnia, v.39, n.1, p.183-190, 2010.
FURUSHO-GARCIA, I.F.; PEREZ, J.O.; PEREIRA, I.G. et al. Estudo alométrico dos tecidos da carcaça de cordeiros Santa Inês puros ou mestiços com Texel, Ile de France e Bergamácia. Revista Brasileira de Zootecnia, v.38, n.3, p.539-546, 2009.
G O N Ç A LV E S , M . S . C r e s c i m e n t o e d e s e n v o l v i m e n t o d e cordeiros machos e fêmeas cruzas Lacaune x Texel. 2009. 65f. Dissertação (Mestrado em Zootecnia) - Universidade Federal de Pelotas, Pelotas.
GRANDE, P.A.; ALCALDE, R.C.; DE LIMA, L.S. et al. Características quantitativas da carcaça e qualitativas do músculo
Longissimus dorsi de cabritos ¾ Boer + ¼ Saanen confinados
recebendo rações contendo grãos de oleaginosas. Revista Brasileira de Zootecnia, v.38, n.6, p.1104-1113, 2009. HINO, T.; RUSSELL, J.B. Relative contributions of ruminal
bacteria and protozoa to the degradation of protein in vitro.
J o u r n a l o f A n i m a l S c i e n c e, v.64, p.261-270, 1987. HOMEM-JUNIOR, A.C.; EZEQUIEL, J.M.B.; GALATI, R.L. et al.
Grãos de girassol ou gordura protegida em dietas com alto concentrado e ganho compensatório de cordeiros em confinamento. Revista Brasileira de Zootecnia, v.39, n.3, p.563-571, 2010.
ÍTAVO, C.C.B.F. Própolis ou monensina sódica como aditivos para cordeiros terminados em confinamento. 2008. 188f. Tese (Doutorado em Zootecnia) - Universidade Estadual Paulista, Botucatu.
ITO, R.H.; DUCATTI, T.; PRADO, J.M. et al. Soybean oil and linseed grains on performance and carcass characteristics of crossbred bulls finished in feedlot. Semina: Ciências Agrárias, v.31, n.1, p.259-268, 2010.
KUSS, F.; RESTLE, J.; PASCOAL, L.L. et al. Desempenho de vacas de descarte recebendo dietas com ou sem monensina. Ciência Rural, v.38, n.1, p.173-177, 2008.
LUGINBUHL, J.M.; POORE, M.H.; CONRAD, A.P. Effect of level of whole cottonseed on intake, digestibility, and performance of growing male goats fed hay-based diets. Journal of Animal Science, v.78, p.1677-1683, 2000.
MULLER, M.; PRADO, I.N.; LOBO JÚNIOR, A.R. et al. Diferentes fontes de lipídeos sobre o desempenho e características da carcaça de novilhas de corte confinadas. Animal Sciences, v.27, p.131-137,
2005.
OLIVEIRA, R.L.; BAGALDO, A.R.; LADEIRA, M.M. et al. Fontes de lipídeos na dieta de búfalas lactantes: consumo, digestibilidade
e N-uréico plasmático. Revista Brasileira de Zootecnia, v.38, n.3, p.553-559, 2009.
REDDY, P.V.; MORRIT, J.L.; BATES, L.S. Effect of roasting temperatures on soybean utilization by young dairy calves.
Journal Dairy Science, n.5, v.76, p.1387-1393, 1993. RODRIGUES, P.H.M.; MATTOS, W.R.S.; MELOTTI, L. et al.
Monensina e digestibilidade aparente em ovinos alimentados com proporções de volumoso/concentrado. Scientia Agricola, v.58, n.3, 2001.
SALLES, M.S.V.; LUCCI, C.S. Monensina para bezerros ruminantes em crescimento acelerado: 1. Desempenho. Revista Brasileira de Zootecnia, v.29, n.2, p.449-455, 2000.
SANTOS, C.L.; PÉREZ, J.R.O.; MUNIZ, J.A. et al. Desenvolvimento relativo dos tecidos ósseo, muscular e adiposo dos cortes da carcaça de cordeiros Santa Inês. Revista Brasileira de Zootecnia, v.30, n.2, p.487-492, 2001a.
SANTOS, F.L.; LANA, R.P.; COELHO SILVA, M.T. et al. Produção e composição do leite de vacas submetidas a dietas contendo diferentes níveis e formas de suplementação de lipídios.
R e v i s t a B r a s i l e i r a Z o o t e c n i a, v.30, n.4, p.1376-1380, 2001b.
SANTOS, F.A.P. Metabolismo de proteínas. In: BERCHIELLI, T.T.; PIRES, A.V.; DE OLIVEIRA, S.G. (Eds.) Nutrição de ruminantes. Jaboticabal, 2006. p.255-285.
SILVA SOBRINHO, A.G. Aspectos quantitativos e qualitativos da produção de carne ovina, In: MATTOS, W.R.S.; FARIA, V.P.; SILVA, S.C. et al. (Eds.) A produção animal na visão dos brasileiros. Piracicaba: Fundação de Estudos Agrários, 2001. p.425-460. SILVA, D.J.; QUEIROZ, A.C. Análise de alimentos (métodos
químicos e biológicos). Viçosa, MG: Universidade Federal de Viçosa, 2002. 235p.
SILVA, G.L.S.; SILVA, A.M.A.; NÓBREGA, G.H. et al. Efeito da inclusão de fontes lipídicas na dieta de cabras em lactação sobre os parâmetros sanguíneos. Ciência Agrotecnologia, v.34, n.1, p.233-239, 2010.
SILVA, M.M.C.; RODRIGUES, M.T.; BRANCO, R.H. et al. Suplementação de lipídios em dietas para cabras em lactação: consumo e eficiência de utilização de nutrientes. Revista Brasileira Zootecnia, v.36, n.1, p.257-267, 2007b. SILVA, M.M.C.; RODRIGUES, M.T.; RODRIGUES, C.A.F. et al.
Efeito da suplementação de lipídios sobre a digestibilidade e os parâmetros da fermentação ruminal em cabras leiteiras. Revista Brasileira Zootecnia, v.36, n.1, p.246-256, 2007a. URANO, F.S.; PIRES, A.V.; SUSIN, I. et al. Desempenho e
características da carcaça de cordeiros confinados alimentados com grãos de soja. Pesquisa Agropecuária Brasileira, v.41, n.10, p.1525-1530, 2006.
VAN SOEST, P.J.; ROBERTSON, J.B.; LEWIS, B.A. Methods for dietary fiber, neutral detergent fiber, and nonstarch polysaccharides in relation to animal nutrition, Journal of Dairy Science, v.74, p.3583-3597, 1991.
WESTWOOD, C.T.; LEAN, I.J.; KELLAWAY, R.C. Indications and implications for testing of milk urea in dairy cattle: a quantitative review. Part 1. Dietary protein sources and metabolism. New Zealand Veterinary Journal, v.43, n.3, p.87-96, 1998. YAMAMOTO, S.M.; MACEDO, F.A.F.; ZUNDT, M. et al. Fontes
de óleo vegetal na dieta de cordeiros em confinamento. Revista Brasileira de Zootecnia, v.34, n.2, p.703-710, 2005. YANXIA, G.; SUN, T.; LI, J. Effect of oilseeds rich in linoleic and