Digital PCR Validates 8q Dosage as
Prognostic Tool in Uveal Melanoma
Mieke Versluis1, Mark J. de Lange1*, Sake I. van Pelt1, Claudia A. L. Ruivenkamp2, Wilma G. M. Kroes2, Jinfeng Cao1,3, Martine J. Jager1, Gre P. M. Luyten1, Pieter A. van der Velden1
1Department of Ophthalmology, Leiden University Medical Center, Leiden, The Netherlands,2Department of Clinical Genetics, Laboratory for Diagnostic Genome Analysis (LDGA), Leiden University Medical Center, Leiden, The Netherlands,3Department of Ophthalmology, The Second Hospital of Jilin University, Changchun, China
Abstract
Background
Uveal melanoma (UM) development and progression is correlated with specific molecular changes. Recurrent mutations inGNAQandGNA11initiate UM development while tumour progression is correlated with monosomy of chromosome 3 and gain of chromosome 8q. Hence, molecular analysis of UM is useful for diagnosis and prognosis. The aim of this study is to evaluate the use of digital PCR (dPCR) for molecular analysis of UM.
Methods
A series of 66 UM was analysed with dPCR for three hotspot mutations inGNAQ/GNA11 with mutation specific probes. The status of chromosomes 3 and 8 were analysed with ge-nomic probes. The results of dPCR analysis were cross-validated with Sanger sequencing, SNP array analysis, and karyotyping.
Results
Using dPCR, we were able to reconstitute the molecular profile of 66 enucleated UM. With digital PCR,GNAQ/GNA11mutations were detected in 60 of the 66 UM. Sanger sequenc-ing revealed three rare variants, and, combined, these assays revealedGNAQ/GNA11 mu-tations in 95% of UM. Monosomy 3 was present in 43 and chromosome 8 aberrations in 52 of the 66 UM. Survival analysis showed that increasing 8q copy numbers were positively correlated with metastasis risk.
Conclusion
Molecular analysis with dPCR is fast and sensitive. Just like the recurrent genomic aberra-tions of chromosome 3 and 8, hotspot mutaaberra-tions inGNAQandGNA11are effectively de-tected in heterogeneous samples. Increased sensitivity contributes to the number of mutations and chromosomal aberrations detected. Moreover, quantification of copy number
OPEN ACCESS
Citation:Versluis M, de Lange MJ, van Pelt SI, Ruivenkamp CAL, Kroes WGM, Cao J, et al. (2015) Digital PCR Validates 8q Dosage as Prognostic Tool in Uveal Melanoma. PLoS ONE 10(3): e0116371. doi:10.1371/journal.pone.0116371
Academic Editor:Reiner Albert Veitia, Institut Jacques Monod, FRANCE
Received:September 9, 2014
Accepted:December 8, 2014
Published:March 12, 2015
Copyright:© 2015 Versluis et al. This is an open access article distributed under the terms of the
Creative Commons Attribution License, which permits unrestricted use, distribution, and reproduction in any medium, provided the original author and source are credited.
Data Availability Statement:All relevant data are within the paper and its Supporting Information files.
Funding:The work was supported by Dutch cancer society, grant no. UL2011-4991, received by PAvdV.
with dPCR validated 8q dosage as a sensitive prognostic tool in UM, of which implementa-tion in disease predicimplementa-tion models will further improve prognosticaimplementa-tion.
Introduction
Uveal Melanoma (UM) is a rare intraocular tumour occurring in the European population with a frequency of 7 cases per million [1]. The primary event in UM is either a mutation in theGNAQor theGNA11gene, located respectively on chromosome 9q21.2 and 19p13.3. Since the vast majority of UM displays one of these hotspot mutations, UM can be regarded geneti-cally homogeneous [2,3]. The same holds true for UM progression that is characterized by re-current genetic aberrations. With classical karyotyping, monosomy of chromosome 3 and gain of chromosome 8q have been discovered and shown to be correlated with UM progression [4,5]. Cytogenetic analysis and fluorescent in situ hybridisation furthermore revealed a dosage effect for additional copies of 8q on survival [4,6]. In this model an increased risk of metastases is observed with increasing 8q copy numbers. Monosomy 3 and an aberrant chromosome 8 often occur together and this combination is correlated with a bad prognosis [7]. Based on the frequency of monosomy 3 and chromosome 8 abnormalities, it has been proposed that chro-mosome 8 abnormalities are secondary to monosomy 3 [8,9]. Monosomy 3 and 8q gain can be applied in the clinic to set an accurate prognosis but classical karyotyping is devious and may fail because it requiresin vitroculture of UM cells. Hence alternative methods that do not re-quirein vitroculture for molecular characterisation have been developed, such as microsatellite analysis (MSA), multiplex ligation-dependent probe amplification (MLPA), single-nucleotide polymorphisms (SNP) and array CGH [8,10–12]. Chromosome 8 aberrations are also incorpo-rated in these assays, although information on 8q copy number dosage is not routinely ac-quired to stratify patient risk [4,6].
The concept of dPCR was first put forward in the nineties [13]. Using limiting dilutions of DNA template in hundreds to thousands of parallel PCR reactions, PCR was digitalized. Rather than analysing the cumulative signal, as done in quantitative PCR, the number of individual PCR reactions with the desired amplicon provides an absolute quantification of a DNA sample in digital PCR. When the parallel PCRs are analyzed for amplification at different wavelengths, reference gene and target gene can be measured in the same reaction to calculate copy num-bers. Alternatively, using WT and mutation specific probes, mutant and WT alleles can be quantified in one test [14,15]. We evaluated the use of the dPCR forGNAQ/GNA11mutation analysis as well as for monosomy 3 and chromosome 8 aberrations in a series of 66 UM derived from enucleation. For validation, the results are compared with SNP array analysis, karyotyp-ing, and Sanger sequencing of theGNAQandGNA11genes.
Material and Methods
Tumour material
Histopathology
Histologic sections were prepared from tissues fixed in 4% neutral-buffered formalin for 48 hours and embedded in paraffin. Hematoxylin-eosin–stained 4-μm sections were reviewed
by one ocular pathologist for confirmation of the diagnosis and evaluated for histologic param-eters, which included largest basal diameter (in millimeters), prominence (apical height, in mil-limeters), cell type according to the modified Callender classification, ciliary body involvement, and intrascleral in-growth [16].
Karyotyping
Following enucleation, a small part of each tumor was sent out for cell culture. Following me-chanical dissection of the tumor biopsy, cells were washed and placed into one flask with RPMI 1640 (15% fetal bovine serum [Invitrogen, Breda, The Netherlands]) medium and another flask with Amniochrome II (Cambrix Bio Science, Verviers, Belgium). The flasks were cultured at 37°C with 5% CO2for up to 4 weeks and harvested when at least 75% of the surface was
cov-ered with cells (after a mean of 18 days; SD, 9.4 days). When cell culturing was successful, con-ventional karyotyping was performed, to determine the presence of chromosomal changes.
Two independent observers assessed all evaluations and scores, each without knowledge of the results obtained by the other investigator, to ensure accuracy of quantification of the slides. In case of a difference, consensus was reached during a simultaneous session.
Cytogenetic analysis was performed on GTG-banded (G-banding with trypsin and Giemsa) metaphases. In the case of a normal karyotype, at least 20 metaphases were analyzed. When an abnormal clone was detected in the first ten karyotyped cells, no further analysis was per-formed; when three cells with loss of 1 copy of chromosome 3 were observed, monosomy 3 was identified.
Table 1. Tumour characteristics and survival data of 66 uveal melanoma patients.
Variable Mean, median (range) No. of patients (%) Missing data (%)
Age at diagnosis (years) 60, 61 (12.8–88.5)
Male gender 33 (50)
Largest tumor diameter (mm) 13.5, 13 (8–30)
Tumor height (mm) 7.7, 8 (1.5–12)
Cell type
-Spindle 21 (32)
-Epithelioid 10 (15)
-Mixed 35 (53)
Ciliary body involvement 26 (41) 1 (1.6)
Survival (months) 59, 54 (2–157)
Survival status
-Alive 28 (42)
-Deaths due to metastasis 34 (52)
-Deaths due to other cause 4 (6)
TNM 7 stage
-I-IIB 43 (65)
-IIIA-IIIC 23 (35)
Digital PCR (dPCR)
GNAQ/11 mutation detection. Presence of a mutation in either theGNAQorGNA11
gene was analysed using hydrolysis probes in a multiplex dPCR. Of each tumour sample 10ng of DNA was used in a 20ul reaction volume. The reaction mixture consisted of 2x droplet PCR supermix (Bio-Rad Laboratories, Inc.), 20x target probe (FAM), 20x wildtype probe (HEX). Proprietary probes and primers (Bio-Rad Laboratories, Inc.) were used and the sequence con-text is provided inS1 Table. Using a QX100 droplet generator and DG8 cartridges (Bio-Rad Laboratories, Inc.), each sample of 20ul was converted to an emulsion of 20.000 droplets. Emul-sified samples were transferred to a 96-well PCR plate and the following protocol was used for PCR to end point using a T100 thermal cycler: 95°C, 10min; (94°C, 30sec; 55°C, 1min) 40x; 98°C, 10min; 4°C, till end. After PCR the plate was loaded into the QX100 droplet reader (Bio-Rad Laboratories, Inc.), each well was read serially. Digital PCR (dPCR) software (QuantaSoft) reads the positive and negative droplets in each sample and plots the fluorescence droplet by droplet. The positive droplets represent the concentration of the target allele in the samples. Digital PCR software allowed visualization of the data.
Copy Number Variation. Copy numbers of chromosome 3 and 8q were analysed using probes forPPARGandPTK2respectively. Because gain of 8q is often correlated with isochro-mosome formation, also a probe at 8p was analysed (TUSC3). In order to calculate normalized copy numbers,TERT(situated at chromosome 5) was used as reference. Thresholds for copy number analysis are: loss,<1.9: normal, 1.9–2.1: gain,>2.1–<3.1: amplification,>3.1.
Of each tumour sample 50–60ng of DNA was used in a 20ul reaction volume. The reaction mixture consisted of 2x droplet PCR supermix (Bio-Rad Laboratories, Inc.), 20x target probe (FAM), 20x reference probe (HEX). Sequence context is provided inS1 Table. Droplet genera-tion, droplet reading and analysis were similar as in the mutation detection assay. The follow-ing end point PCR protocol was used: 95°C, 10min; (94°C, 30sec; 60°C, 1min) 40x; 98°C, 10min; 4°C, till end.
Sanger Sequencing. For validation of theGNAQandGNA11mutation status, as acquired by dPCR, Sanger sequencing was performed on all 66 UM DNA samples by PCR using a Sybr green premixture from Bio-Rad Laboratories, Inc. Primers used are summarized inS2 Table, and the following PCR protocol was used for amplification of exon 4 and exon 5 ofGNAQand
GNA11genes: 94°C, 3min; (96°C, 15sec; 63°C, 15sec; 72°C, 1min) 7x; (96°C, 15sec; 61°C, 15sec; 71°C, 1min) 8x; (96°C, 15sec; 60°C, 15sec; 72°C, 1min) 36x;72°C, 1min; till end. Follow-ing amplification DNA clean-up was performed usFollow-ing Nucleospin Extract II columns (Mach-ery-Nagel, Düren, Germany) according to the manufacturer’s instruction. For Sanger sequencing analysis 10 pmol of the forward or reverse primer was added to the purified DNA amplicon. Sequencing for mutations was outsourced (Baseclear, Leiden, Netherlands). In UM samples showing no mutation in exon 5 ofGNAQorGNA11the exon 4 mutation status of both genes was determined (method identical to exon 5), primers are summarized inS2 Table. We used Mutation Surveyor software (Softgenetics, State College, USA) to assist
mutation analysis.
Single Nucleotide Polymorphism (SNP) analysis
The analysis of the Affymetrix 250K_NSP chips was performed with the‘Genotyping Con-sole’to determine the copy number values and the‘GCT Browser’to visualize the data (both from Affymetrix). The Affymetrix Cytoscan HD chips were analysed with‘ChAS’(Affymetrix). The chromosomal aberrations that were found for both chip versions were put in a database for further analysis.
Statistical analysis
To compare survival between UM patients with chromosome 3 aberrations and chromosome 8q abnormalities we plotted Kaplan-Meier functions. Survival analysis was performed using the log-rank test. To compare individual groups we calculated Hazard ratio’s (HR) using Cox regression model. Pearson’s correlation test was used for correlation analysis of monosomy 3 and 8q copy number of SNP, dPCR and karyotype data. For statistical analysis we used SPSS V.20.0.1 (IBM SPSS Statistics, IBM Corporation, Armonk, New York, USA).
Results
GNAQ
and
GNA11
mutation analysis
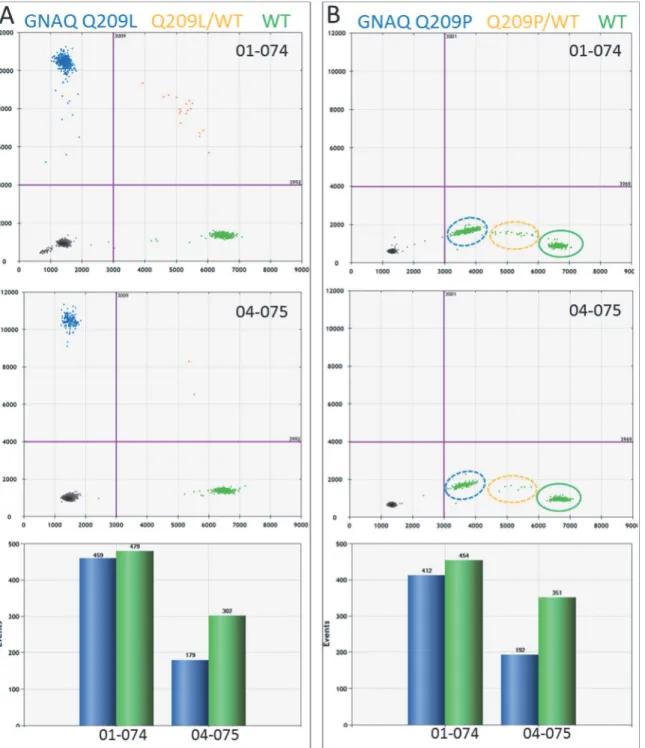
Using dPCR and mutation-specific probes, we analysedGNAQandGNA11mutations in UM samples. Mutations were detected in both homogenous and heterogeneous samples. Assuming each UM cell contains a mutated and a wildtype allele of eitherGNAQorGNA11, samples pre-senting equal numbers of mutant and wildtype alleles are considered homogenous. Hence, tu-mour samples that present an excess of wildtype alleles are considered heterogeneous.Fig. 1 shows two UM samples sharing theGNAQQ209L mutation, caused by a substitution of an ad-enine for a thymine (c.626 A>T). Both samples tested positive for this mutation but the
abun-dance of the mutation differs between these two samples. The allele distribution in UM 01–074 approaches a balanced mutant/wild type ratio (459/479) that fits a homogenous tumour (Fig. 1A). UM 04–075, on the other hand, clearly presents a mixed tumour with an excess of normal alleles (179 mutant/302 WT) (Fig. 1A). Both these tumours, UM 01–074 and UM 04–
075, tested negative for theGNAQQ209P mutation (Fig. 1B). However, in the absence of the
GNAQQ209L probe, theGNAQwild type probe reacted with theGNAQQ209L amplicon and thereby produced aberrant signals (Fig. 1B). The aberrant fractions with theGNAQQ209P assay and the positive fractions with theGNAQQ209L assay are similar in size and this sup-ports the idea that the Q209L mutant allele in UM 01–074 and 04–075 gave rise to the aberrant fraction in the Q209P assay (Fig. 1A and 1B). This indicates that mutations can be detected in the absence of the specific probe for that mutation.
Mutations in the GNAQ were observed in 27 UM, with 17 presenting the Q209P mutation and ten the Q209L mutation. Mutations inGNA11were more common as 33 UM tested posi-tive for theGNA11Q209L mutation (Table 2). Only six out of 66 UM displayed a wildtype
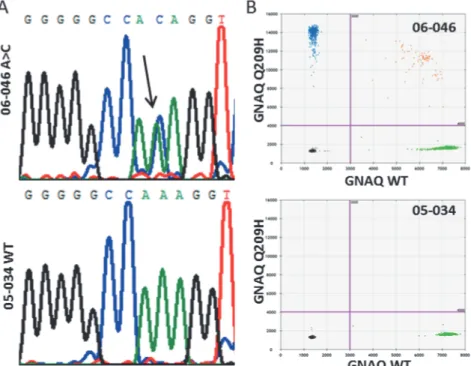
GNAQandGNA11initially. However, rare mutations were detected inGNAQandGNA11due to a minor cross reactivity of the probes, similar to what we observed in theGNAQQ209P assay withGNAQQ209L mutant alleles (Fig. 1B). UM 06–046 showed no positive signals with either of theGNAQmutant probes but an aberrant fraction in bothGNAQassays indicated the presence of another mutation. Sanger sequencing revealed the c.627 A>C mutation that
en-codes for theGNAQQ209H mutant (Fig. 2A). A newly developed dPCR probe for this muta-tion confirmed the presence of this mutamuta-tion in UM 06–046 (Fig. 2B). Validation of an aberrant amplicon inGNA11of UM 02–167 revealed a double mutation (c.626_627 AG>TC).
Fig 1. GNAQ mutation detection in UM by dPCR.Two color digital PCR is presented as a 2D plot. On the x-axis, the number of WT amplicons (green) is indicated and on the y-axis the mutant amplicons (blue) are counted. Empty PCRs and negative amplicons (black) end up in the bottom left quadrant. (A) PCRs containing WT and mutant (orange) will end up in the upper right quadrant. Based on Poisson distribution, the number of WT and mutant amplicons can be calculated (bar graph). This shows that 01–074 represent a homogeneous and 04–075 a heterogeneous UM sample. (B) Digital PCR analysis of
these samples with the GNAQ Q209P assay did not result in mutant signals but aberrant signals on the x-axis. Manual selection of the aberrant signals in the WT quadrant of the plot learned that the clusters matched the positive clusters in the GNAQ Q209L assay. This indicates that the WT probe hybridized with low efficiency to the GNAQ Q209L allele in UM 01–074 and UM 04–075 in the absence of specific probe.
accumulation of a positive signal in dPCR. Direct detection with dPCR and indirect detection of mutants combined, we detected exon 5GNAQandGNA11mutations in 94% of the UM. All mutations have been confirmed by sequence analysis, though mutant sequence signals in het-erogeneous samples with an excess of wildtype DNA could be very low. In 4 out of the 62 cases with mutations detected with dPCR, sequence analysis only showed a minor mutant signal that on itself would be insufficient to call a tumour mutant. The remaining 4 UM that do not pres-ent mutations in exon 5 were analysed for exon 4 mutations ofGNAQandGNA11. This re-vealed a mutation at codon 183 (c.548G>A) of GNAQ in UM 08–004. In a total of 66 UM, 63
carried mutations inGNAQandGNA11.
Monosomy 3 and 8q gain
With dPCR we studied chromosome 3 and chromosome 8 status in UM. Using probes for
PPARGat chromosome 3p,PTK2at chromosome 8q, andTUSC3at 8p, monosomy 3 and chromosome 8 abnormalities were analysed in UM (Table 3). Genomic aberrations detected
Table 2. Summary of GNAQ and GNA11 mutations detected in 66 UM samples.
GNAQ GNA11 Wildtype
R183Q Q209P Q209L Q209H Q209L
-No. of tumours 1 17 10 1 33+1* 3
%of tumours 1.5 25.8 15.1 1.5 51.5 4.6
*GNA11Q209L (c.626_627 AG>TC)
doi:10.1371/journal.pone.0116371.t002
Fig 2. GNAQ A209H mutation in UM 06–046.(A) GNAQ mutation in 06–046 involves the c.627 A>C that
encodes for the Q209H substitution. (B) For comparison, the WT sequence analysis of 05–034 is provided.
Digital PCR with a newly designed GNAQ Q209H probe validates the mutation in 06–046.
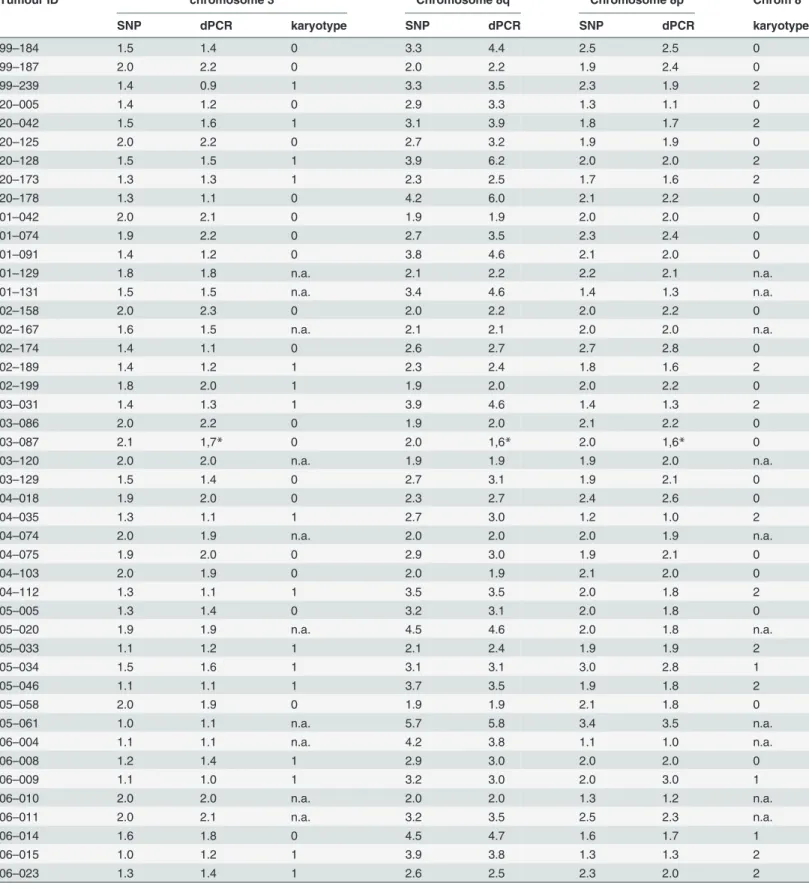
Table 3. Monosomy 3 and chromosome 8 copy number variation: SNP array versus dPCR analysis.
Tumour ID chromosome 3 Chromosome 8q Chromosome 8p Chrom 8
SNP dPCR karyotype SNP dPCR SNP dPCR karyotype
99–184 1.5 1.4 0 3.3 4.4 2.5 2.5 0
99–187 2.0 2.2 0 2.0 2.2 1.9 2.4 0
99–239 1.4 0.9 1 3.3 3.5 2.3 1.9 2
20–005 1.4 1.2 0 2.9 3.3 1.3 1.1 0
20–042 1.5 1.6 1 3.1 3.9 1.8 1.7 2
20–125 2.0 2.2 0 2.7 3.2 1.9 1.9 0
20–128 1.5 1.5 1 3.9 6.2 2.0 2.0 2
20–173 1.3 1.3 1 2.3 2.5 1.7 1.6 2
20–178 1.3 1.1 0 4.2 6.0 2.1 2.2 0
01–042 2.0 2.1 0 1.9 1.9 2.0 2.0 0
01–074 1.9 2.2 0 2.7 3.5 2.3 2.4 0
01–091 1.4 1.2 0 3.8 4.6 2.1 2.0 0
01–129 1.8 1.8 n.a. 2.1 2.2 2.2 2.1 n.a.
01–131 1.5 1.5 n.a. 3.4 4.6 1.4 1.3 n.a.
02–158 2.0 2.3 0 2.0 2.2 2.0 2.2 0
02–167 1.6 1.5 n.a. 2.1 2.1 2.0 2.0 n.a.
02–174 1.4 1.1 0 2.6 2.7 2.7 2.8 0
02–189 1.4 1.2 1 2.3 2.4 1.8 1.6 2
02–199 1.8 2.0 1 1.9 2.0 2.0 2.2 0
03–031 1.4 1.3 1 3.9 4.6 1.4 1.3 2
03–086 2.0 2.2 0 1.9 2.0 2.1 2.2 0
03–087 2.1 1,7* 0 2.0 1,6* 2.0 1,6* 0
03–120 2.0 2.0 n.a. 1.9 1.9 1.9 2.0 n.a.
03–129 1.5 1.4 0 2.7 3.1 1.9 2.1 0
04–018 1.9 2.0 0 2.3 2.7 2.4 2.6 0
04–035 1.3 1.1 1 2.7 3.0 1.2 1.0 2
04–074 2.0 1.9 n.a. 2.0 2.0 2.0 1.9 n.a.
04–075 1.9 2.0 0 2.9 3.0 1.9 2.1 0
04–103 2.0 1.9 0 2.0 1.9 2.1 2.0 0
04–112 1.3 1.1 1 3.5 3.5 2.0 1.8 2
05–005 1.3 1.4 0 3.2 3.1 2.0 1.8 0
05–020 1.9 1.9 n.a. 4.5 4.6 2.0 1.8 n.a.
05–033 1.1 1.2 1 2.1 2.4 1.9 1.9 2
05–034 1.5 1.6 1 3.1 3.1 3.0 2.8 1
05–046 1.1 1.1 1 3.7 3.5 1.9 1.8 2
05–058 2.0 1.9 0 1.9 1.9 2.1 1.8 0
05–061 1.0 1.1 n.a. 5.7 5.8 3.4 3.5 n.a.
06–004 1.1 1.1 n.a. 4.2 3.8 1.1 1.0 n.a.
06–008 1.2 1.4 1 2.9 3.0 2.0 2.0 0
06–009 1.1 1.0 1 3.2 3.0 2.0 3.0 1
06–010 2.0 2.0 n.a. 2.0 2.0 1.3 1.2 n.a.
06–011 2.0 2.1 n.a. 3.2 3.5 2.5 2.3 n.a.
06–014 1.6 1.8 0 4.5 4.7 1.6 1.7 1
06–015 1.0 1.2 1 3.9 3.8 1.3 1.3 2
06–023 1.3 1.4 1 2.6 2.5 2.3 2.0 2
with dPCR were validated by SNP array analysis and significant correlations (p0.01) between SNP array and dPCR analysis for monosomy 3 (r = 0.921) and 8q gain (r = 0.922) were ob-served (Fig. 3). Comparison with karyotyping revealed that in almost a quarter of the cases (n = 15), karyotyping was not successfully applied. Monosomy 3 or 8q aberrations were not de-tected in 13 and 17 of the cases, respectively, where SNP array and dPCR did detect them. In
Table 3. (Continued)
Tumour ID chromosome 3 Chromosome 8q Chromosome 8p Chrom 8
SNP dPCR karyotype SNP dPCR SNP dPCR karyotype
06–033 2.1 2.1 0 3.2 3.0 2.8 2.8 1
06–036 2.0 2.2 0 3.1 2.9 2.9 2.9 1
06–038 1.1 1.1 0 3.4 3.3 1.2 1.1 0
06–041 1.2 1.3 1 4.7 4.6 1.3 1.1 2
06–042 1.1 1.3 1 3.0 2.9 1.0 1.1 2
06–045 1.5 1.6 n.a. 3.8 4.1 1.5 1.4 n.a.
06–046 1.9 1,7* n.a. 2.7 2,3* 2.0 1,6* n.a.
06–047 1.2 1.4 0 2.8 2.7 1.3 1.2 0
07–003 2.0 2.2 n.a. 1.9 2.2 2.1 2.1 n.a.
07–004 2.1 2.1 0 2.0 2.0 2.0 2.0 0
07–005 1.3 1.3 1 3.9 4.2 1.2 1.2 2
07–007 1.0 1.1 0 1.9 1.9 2.0 2.1 0
07–012 1.5 1.7 n.a. 3.7 3.8 2.0 1.9 n.a.
07–030 1.1 1.2 1 3.2 3.5 1.3 1.3 2
07–034 1.9 2.0 0 2.0 2.1 2.1 2.1 0
07–047 1.0 1.1 1 2.0 2.0 2.1 1.9 0
07–050 1.1 1.2 1 4.9 4.9 2.9 3.1 2
08–004 1.2 1.2 n.a. 2.8 2.8 2.1 1.9 n.a.
08–005 1.3 1.2 1 5.7 7.0 1.8 1.8 2
08–008 1.1 1.2 0 2.7 2.9 2.0 2.1 0
08–029 1.2 1.3 0 3.2 3.5 2.1 2.1 0
SNP and dPCR thresholds: loss,<1.9: normal, 1.9–2.1: gain,>2.1-<3.2: amplification,>3.1
*Aberration at chromosome 5, location of TERT, no proper correction possible with TERT dPCR Karyotype chromosome 3: 0; Disomy, 1; MonosomyKaryotype chromosome 8: 0; Disomy, 1; gain, 2; isochromosomen.a.: not analyzed
doi:10.1371/journal.pone.0116371.t003
Fig 3. Correlation between dPCR and SNP with regard to chromosome 3 and 8q copy numbers.Copy numbers of chromosome 3 and 8q in UM calculated with SNP and dPCR display a strong correlation (r = 0.921 and r = 0.922, p<0.0001), indicating that these methods cross validate each other.
one case (02–199) monosomy 3 was detected by karyotyping but was not detected by SNP array and dPCR (Table 3). However, still significant correlations were observed for both chro-mosome 3 and 8 (r = 0.528, p = 0.0002; r = 0.455, p = 0.001) when comparing dPCR
and karyotyping.
In 66 UM, 52 displayed a gain of 8q (79%) while 43 UM showed monosomy 3 (65%). Based on chromosome 3 analysis, UM can be divided in 2 groups, while UM is divided into 3 classes based on 8q copy number. Fourteen tumours displayed a normal 8q copy number
(1.8<n<2.2), 24 UM displayed a 8q gain of one copy (2.1<n<3.2), while 28 UM presented a
8q gain of more than 1 copy which we categorised as amplification of 8q (n>3.1). A balanced
increase of 8q and 8p copy number (Table 3) furthermore indicated that 8q gain is in 8/24 cases (99–187, 02–158, 02–174, 04–018, 05–034, 06–009, 06–033, 06–036) due to trisomy 8. In the remainder (16/24) of the UM with 8q gain, an excess gain of 8q compared to 8p indicated 8q isochromosome formation. Amplification of 8q coincided with 8q/8p imbalance and iso-chromosome formation. However, in six cases with 8q/8p imbalance a gain of 8p was also ob-served (99–184, 20–178, 01–074, 05–061, 06–011 and 07–050), suggesting trisomy 8 in combination with 8q isochromosome formation. With cytogenetic analysis, gain of chromo-some 8 in combination with 8q isochromochromo-some was confirmed in UM 07–050 (Fig. 4).
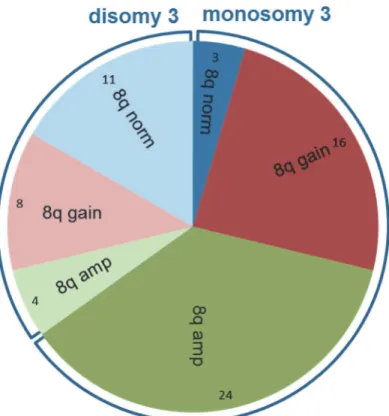
Monosomy 3 and 8q aberrations mostly occurred together (n = 40) (p<0.01) (Fig. 5). In
total, 3 UM with monosomy 3 and a normal chromosome 8 karyotype were detected while 12 UM with chromosome 8 aberrations were detected (8 gains and 4 amplifications) in the dis-omy 3 group.
Monosomy 3 is highly prognostic for death due to metastasis, and 5-year survival is 37% in this group compared to 90% 5-year survival in the UM expressing disomy 3 (Fig. 6A). Survival analysis showed that amplification of 8q (n = 28) is associated with a bad prognosis and only 29% of these patients survive past 5 years (Fig. 6B). UM with normal copy numbers of 8q (n = 14) displayed a good prognosis with a 5-year survival of 93%. UM with 8q gain (n = 24) pre-sented an intermediate prognosis and a 5-year survival of 67% (Fig. 6B). To investigate whether monosomy 3 and 8q risk are additive, we evaluated survival in UM presenting monosomy 3 in combination with gain or amplification of 8q. The survival of UM patients is significantly (p 0.011) worse if monosomy 3 is combined with 8q amplification (Fig. 6C). The 5-year survival drops from 44% to 25% in patients with a UM that present monosomy 3 in combination with 8q amplification compared to UM presenting monosomy 3 in combination with 8q gain. Monosomy 3 without chromosome 8 aberration was observed in only 3 patients and metastasis was not detected in these patients (Figs.5and6C).
Discussion
With six digital PCR runs, we were able to reconstitute the genomic profile of 66 UM. Using three validated assays, we analysedGNAQ/GNA11recurrent hotspot mutations. Two samples presented rare mutations inGNAQ(c.627A>C) andGNA11(c.626_627 AG>TC) which
re-sulted in false-negative results in dPCR. However, both variants presented aberrant signals in theGNAQandGNA11assays that indicated the presence of rare variants. Whether all possible rare variants inGNAQandGNA11will result in aberrant signals when analysed with the stan-dard assays is not certain but in this panel of 66 UM, no additional variants were detected with sequence analysis. Direct and indirect mutation detection with dPCR revealedGNAQ/GNA11
Overall, a good correlation existed between dPCR analysis and copy number analysis with SNP arrays (Fig. 3). However, in two UM, genomic profiling with dPCR turned out to be incor-rect because SNP analysis revealed a gain in the genomic region containing the reference gene
Fig 4. Chromosome 8 heterogeneity in UM 07–050.One clone presents trisomy 8 (left) while the other clone presents trisomy 8 (triangle) in combination
with isochromosome 8q (right). Besides chromosome 8, chromosome 1, 3, 10 and 22 showed clonal abnormalities. Two markers (A) on the bottom indicate the shared origin of these clones.
doi:10.1371/journal.pone.0116371.g004
Fig 5. Non-random distribution of monosomy 3 and chromosome 8 aberrations.In 40 (61%) of the 66 UM monosomy 3 and 8q aberrations occur together. Non-random distribution is even stronger for 8q amplification and monosomy 3, as monosomy 3 is present in 24 (86%) of 28 UM with 8q amplification.
(TERT). Using multiple reference genes from stable regions in dPCR in a multi-colour ap-proach would solve the problem withTERTnormalisation. UM are relatively stable and nor-malisation of 3 or 4 reference genes will be sufficient to identify aberrant reference genes that should be excluded from analysis. These findings indicate that dPCR and SNP arrays are both valid means to quantify gene copy number. Since dPCR is time and cost effective, it would make it the method of choice. Application of quantitative copy number analysis furthermore improves diagnosis and prognosis. Quantitative analysis of 8q copy number validated the dos-age effect of 8q on prognosis that was previously shown but which has not yet been widely im-plemented in UM prognostication [4,6]. Gain of one copy of 8q (2.1<n<3.2) is correlated with
a moderate risk of metastasis while higher gains (amplification, n>3.1) are correlated with an
even worse prognosis. Amplifications are correlated with isochromosome 8q formation which we validated with imbalance of 8q/8p copy numbers in dPCR. Isochromosome formation also occurred in combination with trisomy 8 in 6 UM. Coexistence of clones with isochromosome 8q and trisomy 8 has been interpreted as the consequence of independent events [17]. In an ex-perimental model however, isochromosome formation was shown to be secondary to gain of a chromosome [18]. We therefore propose that isochromosome 8q formation could be second-ary to trisomy 8 and frequent detection of heterogeneous UM that present both trisomy 8 and isochromosome 8q support this progression model (Table 3,Fig. 4) [9]. Recently, chromosome 8p loss was identified as independent risk predictor of poor outcome [11]. As isochromosome 8q formation in UM is often associated with 8p loss, we propose that isochromosome forma-tion may be an underlying cause. Superimposing monosomy 3 in this progression model fur-thermore suggests that increasing 8q copy numbers due to isochromosome 8q formation is accompanied by monosomy 3 formation. Just like the underrepresentation of monosomy 3 UM with normal chromosome 8, UM with 8q amplification and a normal chromosome 3 are virtually lacking (Fig. 5). Chromosome 8 aberrations are also most common in other stud-ies and this supports that chromosome 8 aberrations proceed monosomy 3 [7,11,19–21].
Regardless of the order of events, a combination of monosomy 3 and chromosome 8 gain is correlated with a worse prognosis than monosomy 3 on itself [7]. Moreover, an increased risk
Fig 6. Worst survival for patients with amplification of chromosome 8q.The presence of monosomy 3 (n = 43) in UM is highly prognostic for death due to metastases compared to the presence of disomy 3 (n = 23) (p<0.0001). (A) Significant differences in survival between classes of tumours with normal (n = 14), gain (n = 24), or amplification (n = 28) of chromosome 8q. A significant difference in survival was observed between the three categories (p<0.0001), and between the different individual classes: normal vs. amplification (p<0.0001), and gain vs. amplification (p = 0.00125). Between normal and gain of 8q a trend towards significance was observed (p = 0.07). (B) On the background of monosomy 3, 8q amplification (n = 24) increased the risk significantly (p = 0.011) compared to monosomy 3 with 8q gain (n = 16). Three UM presented monosomy 3 without aberration on 8q: none died due to UM metastasis. (C)
of metastasis formation in the presence of 8q amplification in combination with monosomy 3 compared to monosomy 3 in combination with gain of 8q supports a dominant role for 8q dos-age in UM metastases (Fig. 6C) [4]. We therefore propose that molecular prognostication of UM should include 8q quantification. With quantitative SNP analysis, 8q copy number can be adequately determined while dPCR provides a cost and time effective alternative. Moreover, the sensitivity of dPCR specifically facilitates the analysis of mutations and copy number aber-rations in small and highly diluted samples such as circulating tumour cells and free circulating tumour DNA. Future implementation of quantification of 8q in prediction models will im-prove prognostication in UM.
Supporting Information
S1 Table. dPCR sequences context.
(XLSX)
S2 Table. GNAQ and GNA11 primers used for sanger sequencing.
(XLSX)
S3 Table. Hazard ratio's chromosome 8q.
(XLSX)
Acknowledgments
The authors thank Ronald van Eijk from the Department of Pathology of the LUMC for helpful discussion. Eddy van Collenburg and Roy Wigger (BioRad Laboratories) for providing probes and primers. Guido J.E.J. Hooiveld (WU Agrotechnology & Food Sciences) for use of the digi-tal PCR facility. This study was supported by grant UL 2011-4991 from the Dutch Cancer Soci-ety (KWF). None of the authors has a commercial interest related to the results presented in this manuscript.
Author Contributions
Conceived and designed the experiments: PAvdV MV. Performed the experiments: MV CALR WGMK JC. Analyzed the data: SIvP MJdL. Contributed reagents/materials/analysis tools: GPML MJJ. Wrote the paper: MV PAvdV MJdL.
References
1. Egan KM, Seddon JM, Glynn RJ, Gragoudas ES, Albert DM (1988) Epidemiologic aspects of uveal melanoma. Surv Ophthalmol 32: 239–51. PMID:3279559
2. Van Raamsdonk CD, Bezrookove V, Green G, Bauer J, Gaugler L, et al. (2008) Frequent somatic muta-tions of GNAQ in uveal melanoma and blue naevi. Nature.
3. Van Raamsdonk CD, Griewank KG, Crosby MB, Garrido MC, Vemula S, et al. (2010) Mutations in GNA11 in uveal melanoma. N Engl J Med 363: 2191–2199. doi:10.1056/NEJMoa1000584PMID:
21083380
4. Sisley K, Rennie IG, Parsons MA, Jacques R, Hammond DW, et al. (1997) Abnormalities of chromo-somes 3 and 8 in posterior uveal melanoma correlate with prognosis. Genes Chromochromo-somes Cancer 19: 22–8. PMID:9135991
5. Prescher G, Bornfeld N, Hirche H, Horsthemke B, Jockel KH, et al. (1996) Prognostic implications of monosomy 3 in uveal melanoma. Lancet 347: 1222–5. PMID:8622452
6. Parrella P, Caballero OL, Sidransky D, Merbs SL (2001) Detection of c-myc amplification in uveal mela-noma by fluorescent in situ hybridization. Invest Ophthalmol Vis Sci 42: 1679–1684. PMID:11431428 7. Cassoux N, Rodrigues MJ, Plancher C, Asselain B, Levy-Gabriel C,et al. (2014) Genome-wide profiling
8. Parrella P, Sidransky D, Merbs SL (1999) Allelotype of posterior uveal melanoma: implications for a bi-furcated tumor progression pathway. Cancer Res 59: 3032–3037. PMID:10397238
9. Hoglund M, Gisselsson D, Hansen GB, White VA, Sall T, et al. (2004) Dissecting karyotypic patterns in malignant melanomas: temporal clustering of losses and gains in melanoma karyotypic evolution. Int J Cancer 108: 57–65. PMID:14618616
10. Damato B, Dopierala J, Klaasen A, van DM, Sibbring J, et al. (2009) Multiplex ligation-dependent probe amplification of uveal melanoma: correlation with metastatic death. Invest Ophthalmol Vis Sci 50: 3048–3055. doi:10.1167/iovs.08-3165PMID:19182252
11. Ewens KG, Kanetsky PA, Richards-Yutz J, Al-Dahmash S, De Luca MC, et al. (2013) Genomic profile of 320 uveal melanoma cases: chromosome 8p-loss and metastatic outcome. Invest Ophthalmol Vis Sci 54: 5721–5729. doi:10.1167/iovs.13-12195PMID:23821189
12. Trolet J, Hupe P, Huon I, Lebigot I, Decraene C, et al. (2009) Genomic profiling and identification of high-risk uveal melanoma by array CGH analysis of primary tumors and liver metastases. Invest Ophthalmol Vis Sci 50: 2572–2580. doi:10.1167/iovs.08-2296PMID:19151381
13. Vogelstein B, Kinzler KW (1999) Digital PCR. Proc Natl Acad Sci U S A 96: 9236–9241. PMID:
10430926
14. Lo YM, Lun FM, Chan KC, Tsui NB, Chong KC, et al. (2007) Digital PCR for the molecular detection of fetal chromosomal aneuploidy. Proc Natl Acad Sci U S A 104: 13116–13121. PMID:17664418 15. Wang J, Ramakrishnan R, Tang Z, Fan W, Kluge A, et al. (2010) Quantifying EGFR alterations in the
lung cancer genome with nanofluidic digital PCR arrays. Clin Chem 56: 623–632. doi:10.1373/
clinchem.2009.134973PMID:20207772
16. McLean IW, Foster WD, Zimmerman LE, Gamel JW (1983) Modifications of Callender's classification of uveal melanoma at the Armed Forces Institute of Pathology. Am J Ophthalmol 96: 502–509. PMID:
6624832
17. Prescher G, Bornfeld N, Becher R (1994) Two subclones in a case of uveal melanoma. Relevance of monosomy 3 and multiplication of chromosome 8q. Cancer Genet Cytogenet 77: 144–146. PMID:
7954325
18. de la Chapelle A (1982) How do human isochromosomes arise? Cancer Genet Cytogenet 5: 173–179.
PMID:7066878
19. Prescher G, Bornfeld N, Becher R (1990) Nonrandom chromosomal abnormalities in primary uveal mel-anoma. J Natl Cancer Inst 82: 1765–1769. PMID:2231772
20. Singh AD, Boghosian-Sell L, Wary KK, Shields CL, De PP, et al. (1994) Cytogenetic findings in primary uveal melanoma. Cancer Genet Cytogenet 72: 109–115. PMID:8143268
21. Damato B, Dopierala JA, Coupland SE (2010) Genotypic profiling of 452 choroidal melanomas with multiplex ligation-dependent probe amplification. Clin Cancer Res 16: 6083–6092. doi: