D I A B E T E S & M E T A B O L I S M J O U R N A L
his is an Open Access article distributed under the terms of the Creative Commons At-tribution Non-Commercial License (http://creativecommons.org/licenses/by-nc/3.0/) which permits unrestricted non-commercial use, distribution, and reproduction in any medium, provided the original work is properly cited.
GDF15 Is a Novel Biomarker for Impaired Fasting
Glucose
Jun Hwa Hong1,2
, Hyo Kyun Chung1
, Hye Yoon Park2
, Kyong-Hye Joung1,3
, Ju Hee Lee1,3
, Jin Gyu Jung4
, Koon Soon Kim1,3
, Hyun Jin Kim1,3
, Bon Jeong Ku1,3
, Minho Shong1,3
1Research Center for Endocrine and Metabolic Diseases, Chungnam National University Hospital, Daejeon, 2Department of Internal Medicine, Kyungpook National University Hospital, Daegu,
Departments of 3Internal Medicine, 4Family Medicine, Chungnam National University School of Medicine, Daejeon, Korea
Background: Growth diferentiation factor-15 (GDF15) is a protein that belongs to the transforming growth factor β superfami-ly. An elevated serum level of GDF15 was found to be associated with type 2 diabetes mellitus (T2DM). T2DM is an inlammato-ry disease that progresses from normal glucose tolerance (NGT) to impaired fasting glucose (IFG). Hence, we aimed to validate the relationship between GDF15 and IFG.
Methods: he participants were divided into the following three groups: NGT (n=137), IFG (n=29), and T2DM (n=75). he controls and T2DM outpatients visited the hospital for routine health check-ups. We used fasting blood glucose to detect IFG in nondiabetic patients. We checked the body mass index (BMI), C-reactive protein level, metabolic parameters, and fasting serum GDF15 level.
Results: Age, BMI, triglyceride, insulin, glucose, homeostatic model assessment-insulin resistance (HOMA-IR), and GDF15 lev-els were elevated in the IFG and T2DM groups compared to the NGT group. In the correlation analysis between metabolic pa-rameters and GDF15, age and HOMA-IR had a signiicant positive correlation with GDF15 levels. GDF15 signiicantly discrimi-nated between IFG and NGT, independent of age, BMI, and HOMA-IR. he serum levels of GDF15 were more elevated in men than in women. As a biomarker for IFG based on the receiver operating characteristic curve analysis, the cutof value of GDF15 was 510 pg/mL in males and 400 pg/mL in females.
Conclusion: GDF15 had a positive correlation with IR independent of age and BMI, and the serum level of GDF15 was in-creased in the IFG and T2DM groups. GDF15 may be a novel biomarker for detecting IFG in nondiabetic patients.
Keywords: Biological markers; Diabetes mellitus, type 2; Growth diferentiation factor 15; Prediabetic state
Corresponding authors: Minho Shong
Department of Internal Medicine, Chungnam National University School of Medicine, 282 Munhwa-ro, Jung-gu, Daejeon 301-721, Korea
E-mail: [email protected]
Bon Jeong Ku
Department of Internal Medicine, Chungnam National University School of Medicine, 282 Munhwa-ro, Jung-gu, Daejeon 301-721, Korea
INTRODUCTION
According to the 2011 National Diabetes Fact Sheet of the Amer-ican Diabetes Association (ADA), 25.6 million people (11.3%) in the United States aged 20 years or older had diabetes in 2010, and 35% of United States adults had prediabetes (50% of adults aged 65 years or older) [1]. In Korea, approximately 4 million Korean
people (12.4%) aged 30 years or older had diabetes in 2011, and 20% of Korean adults had prediabetes impaired fasting glucose (IFG) [2]. Recently, there has been a striking increase in the prevalence of type 2 diabetes mellitus (T2DM) as well as that of prediabetes. In the prediabetic stage, lifestyle modiications and the use of some drugs such as metformin and α-glucosidase inhibitor can modify insulin resistance (IR) and hence delay or http://dx.doi.org/10.4093/dmj.2014.38.6.472
reduce the progression to T2DM [3-6]. To achieve this out-come, it is necessary to identify prediabetic patients earlier with the use of a biomarker. Several markers for predicting predia-betes have been proposed. Acute phase proteins (C-reactive protein [CRP], plasminogen activator inhibitor-1) and coagu-lation factors (fibrinogen, D-dimer) are considered markers that can predict prediabetes [7,8]. However, these parameters are more correlated with cardiovascular risk than IR. There-fore, a novel marker that is based on the pathogenesis of predi-abetes and T2DM is necessary.
IR is already present in the prediabetic stage. T2DM develops when the IR becomes more severe and the pancreatic β-cells fail to compensate for IR [9]. he sequential progression from normal glucose tolerance (NGT) to T2DM through prediabetes is associated with multifactorial components. Chronic inlam-mation may be a contributing factor for the development of T2DM in a nondiabetic population. In a large cohort study, pa-tients with prediabetes who had high levels of acute phase pro-teins (e.g., CRP, plasminogen activator inhibitor-1) converted to T2DM more frequently than those who had lower levels of acute phase proteins [7,10]. Because T2DM is an inlammatory disease, treatment with salicylates and interleukin-1 (IL-1) an-tagonists lowered blood glucose levels and attenuated the T2DM-associated complications [11]. Inlammation was asso-ciated with increased IR rather than decreased insulin secre-tion. Inlammation in the prediabetic stage accentuated the car-diovascular risk by more than 1.56 times that in the NGT group [12-14].
Growth differentiation factor-15 (GDF15) is a divergent member of the transforming growth factor-β (TGF-β) super-family [15]. he role and the downstream mechanism of GDF15 have not yet been clearly elucidated. According to many studies, GDF15 is associated with cancers, cardiovascular diseases, and inlammatory diseases. he putative role of GDF15 is that of a stress- or inlammation-responsive cytokine. As one of the as-pects of the inlammatory disease of T2DM, elevated levels of GDF15 were found to be associated with the presence of T2DM and the future development of T2DM [16-18]. However, the re-lationship between GDF15 and prediabetes has not yet been in-vestigated.
In the prediabetic stage, patients with IFG had less severe IR and lower cardiovascular risk than patients with impaired glu-cose tolerance (IGT) [19]. Therefore, we aimed to evaluate GDF15 as a biomarker for discriminating patients with IFG from a nondiabetic population.
METHODS
Study design
We recruited 241 participants from the Chungnam National University Hospital from June 2012 to May 2013. he partici-pants were divided into three groups: NGT, IFG, and T2DM. he patients with T2DM were outpatients of the Department of Endocrinology. he classiication of hyperglycemia was based on ADA criteria, with IFG deined as a fasting plasma glucose level from 100 to 125 mg/dL [20]. In the routine health check-up population, ive patients were found to be newly diagnosed with T2DM and were included in the T2DM group. We exclud-ed ive patients with a known malignancy (three cases of thyroid cancers, one case of stomach cancer, and one case of breast can-cer). We also excluded three patients with an elevated aspartate transaminase (AST)/alanine transaminase (ALT) (above 100 IU/L). We then compared the clinical characteristics, biochemi-cal data, and serum GDF15 levels among the three groups.
Biochemical data
Statistical analysis
All of the parameter values were calculated as the mean± stan-dard deviation. Statistical significance was defined as P<0.05 (two-tailed analysis). One-way analysis of variance was used to compare the clinical characteristics, biochemical data, and GDF15 levels among the three groups. To analyze the strength of the relationship between GDF15 and the studied variables, pear-son correlation coeicients were used. Logistic regression analy-sis was performed to evaluate the contribution of GDF15 in pre-dicting IFG in nondiabetic participants. For determining the predictive value of GDF15 for IFG, we quantified GDF15 by constructing receiver operating characteristic curves and mea-sured the area under the curve (AUC). Statistical analysis was performed using SPSS version 20 (IBM Co., Armonk, NY, USA).
Ethics
he study protocol was reviewed and approved by the Institu-tional Review Board of Chungnam NaInstitu-tional University Hos-pital. Written and oral informed consent was obtained from all of the participants enrolled in this study.
RESULTS
Clinical characteristics of the study population
he clinical characteristics of the study population are shown in Table 1. he patients in the T2DM group (55.41±12.8 years) were signiicantly older than the patients in the IFG (50.14± 9.86 years) and NGT (45.48±9.50 years) groups. Body mass index (BMI) was the highest in the T2DM group (26.42±4.9 kg/m2), while BMI in the IFG group (25.44±2.80 kg/m2) was
significantly higher than that in the NGT group (24.34±3.10 kg/m2). With respect to the lipid proile, total cholesterol, and
LDL levels were lower in the T2DM group than in the IFG and NGT groups. Fasting serum glucose and insulin levels increased stage by stage from NGT to T2DM through IFG. he calculated HOMA-IR level was elevated in the IFG group (2.51±1.60), and it was the highest in the T2DM group (4.37±4.20). HOMA-IR levels in the T2DM group and IFG group showed the presence of IR.
he acute phase protein CRP, which is a marker of inlam-mation, was elevated only in the T2DM group (1.32±2.0 mg/ L). here was no diference in the CRP level (P=1.00) between the NGT group (0.51±0.8 mg/L) and the IFG group (0.30±0.3 mg/L). he calculated HOMA-β, which measures the insulin
secretion function of pancreatic β-cells, signiicantly declined from the NGT to T2DM groups through the IFG group.
GDF15 measurement by ELISA
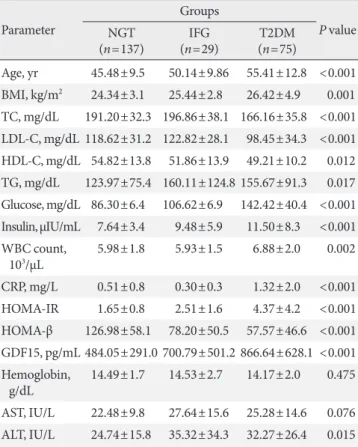
The fasting serum GDF15 level was the lowest in the NGT group (484.05±291.0 pg/mL) and the highest in the T2DM group (866.64±628.10 pg/mL). he IFG group showed an in-termediate value of fasting serum GDF15 (700.79±501.20 pg/ mL), and all of the GDF15 values were signiicantly diferent among the three groups (Fig. 1).
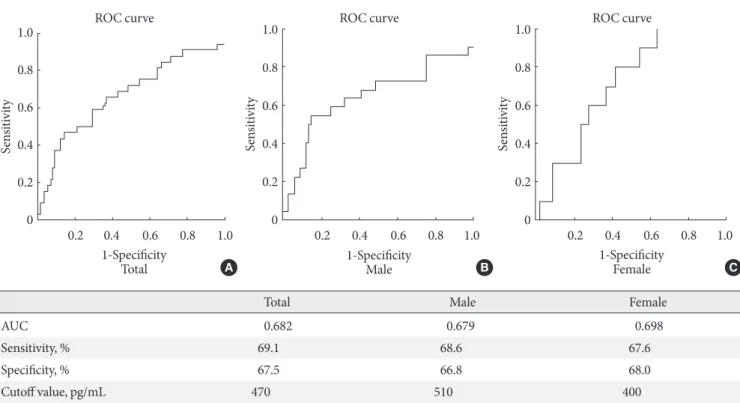
Table 1. Clinical characteristics and comparison between metabolic parameters and GDF15 among the NGT, IFG, and T2DM groups
Parameter
Groups
P value
NGT (n=137)
IFG (n=29)
T2DM (n=75)
Age, yr 45.48±9.5 50.14±9.86 55.41±12.8 <0.001 BMI, kg/m2 24.34±3.1 25.44±2.8 26.42±4.9 0.001 TC, mg/dL 191.20±32.3 196.86±38.1 166.16±35.8 <0.001 LDL-C, mg/dL 118.62±31.2 122.82±28.1 98.45±34.3 <0.001 HDL-C, mg/dL 54.82±13.8 51.86±13.9 49.21±10.2 0.012 TG, mg/dL 123.97±75.4 160.11±124.8 155.67±91.3 0.017 Glucose, mg/dL 86.30±6.4 106.62±6.9 142.42±40.4 <0.001 Insulin, μIU/mL 7.64±3.4 9.48±5.9 11.50±8.3 <0.001 WBC count,
103/μL
5.98±1.8 5.93±1.5 6.88±2.0 0.002
CRP, mg/L 0.51±0.8 0.30±0.3 1.32±2.0 <0.001
HOMA-IR 1.65±0.8 2.51±1.6 4.37±4.2 <0.001
HOMA-β 126.98±58.1 78.20±50.5 57.57±46.6 <0.001 GDF15, pg/mL 484.05±291.0 700.79±501.2 866.64±628.1 <0.001 Hemoglobin,
g/dL
14.49±1.7 14.53±2.7 14.17±2.0 0.475
AST, IU/L 22.48±9.8 27.64±15.6 25.28±14.6 0.076 ALT, IU/L 24.74±15.8 35.32±34.3 32.27±26.4 0.015
Values are presented as mean±standard deviation.
Correlation analysis between GDF15 and metabolic parameters
By Pearson coeicient correlation analysis, GDF15 was strong-ly associated with age (r=0.367, P<0.001), glucose (r=0.249, P<0.001), and HOMA-IR (r=0.311, P<0.001) (Table 2). GDF15 was negatively correlated with total cholesterol (r= –0.224, P=0.001), LDL-C (r=–0.200, P=0.004), and HDL-C (r=–0.175, P=0.011). here was no signiicant correlation be-tween GDF15 and CRP (r=0.040, P=0.616).
Contribution of GDF15 in discriminating patients with IFG from a nondiabetic population
In logistic regression analysis, HOMA-IR signiicantly contrib-uted to our ability to discriminate IFG from NGT (odds ratio [OR], 2.114; P=0.014). GDF15 also signiicantly discriminated IFG from NGT (OR, 1.532; P=0.005) after adjusting for age and BMI (Table 3).
GDF15 as a marker for discriminating IFG from NGT
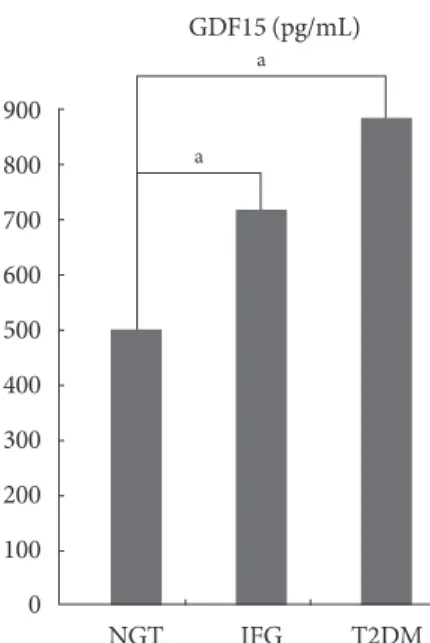
We evaluated GDF15 as a marker for discriminating patients with IFG from nondiabetic patients after the exclusion of known T2DM patients. he mean values of GDF15 difered be-tween men and women. Fasting serum GDF15 levels were high-er in men than in women (717.61±520.20 and 503.99±396.10 pg/mL, respectively; P=0.002). he total AUC of GDF15 was
0.682, sensitivity was 69.1%, speciicity was 67.5%, and the cut-of value was 470 pg/mL. In men, the AUC cut-of GDF15 was 0.679, sensitivity was 68.6%, speciicity was 66.8%, and the cutof value was 510 pg/mL. In women, the AUC of GDF15 was 0.698, sen-sitivity was 67.6%, specificity was 68.0%, and the cutoff value was 400 pg/mL (Fig. 2).
DISCUSSION
Prediabetes is usually unrecognized and therefore constitutes a major public health concern that needs earlier intervention because the majority of cases in the prediabetic stage proceed to T2DM [21]. he 75 g oral glucose tolerance test (OGTT) is
Table 2. Correlation analysis between GDF15 and metabolic parameters
Parameter Pearson`s coeicient (r) P value
Age 0.367 <0.001
Body mass index 0.099 0.150
Total cholesterol –0.224 0.001
LDL-C –0.200 0.004
HDL-C –0.175 0.011
Triglyceride 0.120 0.080
C-reactive protein 0.040 0.616
Glucose 0.249 <0.001
Insulin 0.253 0.001
HOMA-IR 0.311 <0.001
White blood cell count 0.120 0.084
AST 0.111 0.112
ALT 0.052 0.456
GDF15, growth diferentiation factor-15; LDL-C, low density lipo-protein cholesterol; HDL-C, high density lipolipo-protein cholesterol; HOMA-IR, homeostatic model assessment-insulin resistance; AST, aspartate transaminase; ALT, alanine transaminase.
Table 3. Logistic regression analysis for impaired fasting glu-cose in comparison with normal gluglu-cose tolerance
Variable Odd ratio 95% CI P value
Age 1.053 0.990–1.120 0.099
Body mass index 1.023 0.837–1.250 0.824
HOMA-IR 2.114 1.162–3.846 0.014
GDF15 1.534 1.094–1.902 0.005
CI, conidence interval; HOMA-IR, homeostatic model assessment-insulin resistance; GDF15, growth diferentiation factor-15.
900
800
700
600
500
400
300
200
100
0
NGT IFG T2DM
a a
GDF15 (pg/mL)
the gold standard to identify prediabetic patients, including patients with IFG and IGT [22]. However, it takes more than 2 hours to perform the 75 g OGTT, and the consumption of 75 g of glucose occasionally causes gastrointestinal symptoms; hence, there is a limitation to performing the 75 g OGTT as a screening test for detecting prediabetes. he other representa-tive markers for identifying prediabetes are fasting blood glu-cose and hemoglobin A1c (HbA1c). However, these parame-ters have usage limitations. Speciically, the fasting blood glu-cose level is afected by many factors. Diurnal variation, hor-monal inluence, consumption of drugs and medications, al-cohol intake, and accompanying disease state may be associat-ed with the variation of blood glucose levels [23]. Other than the stage of prediabetes or diabetes, a recent meal may also af-fect the fasting blood glucose level. In the animal experiments performed by Raher et al. [24], a short-duration intervention of a high-fat diet (9 days) provoked IR and elevated the fasting glucose level in C57BL/6 mice. HbA1c is also afected by many factors; however, it is convenient to measure this parameter as the patients do not need to fast, thereby enabling random blood sampling and making it a more comprehensive measure of mean glycemia than fasting plasma glucose [25]. Factors that inluence HbA1c are anemia, hemoglobinopathies, liver
disease, and the ingestion of alcohol, vitamin C and vitamin E, etc. Furthermore, the diferences between days, between sub-jects and the standardization of HbA1c measurement assays lead to diiculty in maintaining consistency [26]. In spite of the lack of consistency, fasting blood glucose and HbA1c are efective for predicting T2DM [27]. However, as markers for identifying prediabetes, HbA1c and fasting blood glucose were found to be less sensitive than plasma glucose at 2-hour ater glucose loading [28]. Fasting blood glucose and HbA1c are glucose-dependent biochemical data that are continuously changing due to many factors. Therefore, it is necessary to identify a biomarker to detect prediabetes by a method that is not based on plasma glucose to maintain the consistency and ease of preparation. GDF15 is a nonglucose protein, and only one fasting blood sample is needed for its measurement. Fur-thermore, serum GDF15 levels were found to be stable at room temperature for 48 hours and showed a consistent value despite four freeze/thaw cycles (20 hours at –70°C followed by 4 hours at room temperature). In addition to these advantages, the anticoagulant used for sampling does not affect the mea-surements [29]. However, further prospective studies on GDF15 measurement are required for analyzing the efects of meals, ac-companying diseases, and drugs.
Total Male Female
AUC 0.682 0.679 0.698
Sensitivity, % 69.1 68.6 67.6
Speciicity, % 67.5 66.8 68.0
Cutof value, pg/mL 470 510 400
Fig. 2. Prediction of impaired fasting glucose (IFG) based on the receiver operating characteristic (ROC) curve of growth difer-entiation factor-15 (A, total; B, male; C, female).
ROC curve
Se
n
sit
iv
it
y
1-Speciicity Total 1.0
0.8
0.6
0.4
0.2
0
0.2 0.4 0.6 0.8 1.0
ROC curve
Se
n
sit
iv
it
y
1-Speciicity Male 1.0
0.8
0.6
0.4
0.2
0
0.2 0.4 0.6 0.8 1.0
ROC curve
Se
n
sit
iv
it
y
1-Speciicity Female 1.0
0.8
0.6
0.4
0.2
0
0.2 0.4 0.6 0.8 1.0
GDF15 is a divergent member of the TGF-β superfamily. It was initially named macrophage inhibitory cytokine-1 (MIC-1) [15] and is sometimes also known as placental bone morpho-genetic protein (PLAB) [30], placental transforming growth factor-β (PTGF-β) [31], prostate derived factor (PDF) [32], and nonsteroidal anti-inflammatory drug-activated protein-1 (NAG-1) [33]. Initially, GDF15 was regarded as an anti-inlam-matory protein that inhibits macrophage activation; therefore, the induction of GDF15 reduces tumor necrosis factor-α (TNF-α) secretion in macrophages [15]. he diverse roles of GDF15 were further elucidated in additional studies; however, the exact mechanism and downstream signal are not known. he GDF15 levels were elevated more in T2DM patients than in the non-T2DM population. Insulin resistance is induced by macrophage iniltration and inlammation in the liver, adipose tissues, and muscles. Elevated levels of proinlammatory cyto-kines, for example, TNF-α and IL-6, have been found in adi-pose tissues and blood samples from IR patients with diabetes [34]. Weight reduction to reduce TNF-α in obese and insulin-resistant patients improved the IR in an animal model [16]. GDF15 was also identiied in adipose tissues where it is secret-ed as an adipokine [17].
herefore, GDF15 may be a biomarker for predicting IR and diabetes. In the Xenical in the Prevention of Diabetes in Obese Subjects (XENDOS) trial, obese people with high levels of GDF15 progressed to T2DM during the 4-year follow-up peri-od [18]. Dostalova et al. [35] also reported that patients with obesity and T2DM showed increased serum concentrations of GDF15. In a clinical experiment, Karczewska-Kupczewska et al. [36] reported that there was an inverse correlation between insulin sensitivity and GDF15 values during the clamp exami-nation. However, the relationship between GDF15 and predia-betes has not yet been investigated. Prediapredia-betes can also devel-op due to IR, and it is associated with an increased risk of dia-betes and cardiovascular diseases in the future [10]. In the XENDOS trial, the IFG group showed no signiicant change compared with the NGT group. In addition, the mean GDF15 level in the NGT group was 869 pg/mL and that in the T2DM group was 1,136 pg/mL because all of the participants were obese patients with a mean BMI of 37.6 kg/m2. In a study by
Dostalova et al. [35], the GDF15 level in the NGT group was 330 pg/mL and that in the T2DM group was 1,100 pg/mL. In the NGT group, the mean GDF15 level in the nondiabetic obese people with a mean BMI of 43.2 kg/m2 was
approxi-mately 530 pg/mL. he GDF15 levels of the aforementioned
two studies were more elevated than in our study, possibly be-cause the high BMI of participants might afect the values. In our study, the total mean GDF15 level in the NGT group was 484.05 pg/mL (445.02 pg/mL in men and 378.68 pg/mL in women). hese data are similar to those in nonobese people in the NGT group (GDF15, 380 pg/mL) in the study by Dostalo-va et al. [35]. he total GDF15 level in the T2DM group was 866.64 pg/mL (919.0 pg/mL in men and 722.88 pg/mL in women). Our values in the T2DM group were slightly lower than those in the other studies because the BMI of our partici-pants was 24 to 26 kg/m2. According to previous data, GDF15
levels are correlated with BMI and T2DM. In our study, al-though BMI was signiicantly diferent among the NGT, IFG, and T2DM groups (P<0.001), most of the participants’ BMIs were below 30 kg/m2. When comparing the GDF15 levels by
BMI, there was no signiicant diference between groups (data not shown). herefore, we could postulate the relationship be-tween GDF15 and IR without the effect of obesity and dis-criminate IFG from NGT using the GDF15 measurement. In our study, GDF15 showed a signiicant correlation with age and also showed a diference by sex. Similar patterns were observed in the XENDOS trial. Because aging is also a chronic inlammatory process, older patients showed higher levels of GDF15 [37]. GDF15 levels were more elevated in males than in females (717.61±520.20, 503.99±396.10 pg/mL, P=0.002). However, the reference values according to the age group and sex have not been elucidated, and therefore, a large-scale study is needed. In addition, GDF15 showed a signiicant correlation with lipid proiles. Total cholesterol and LDL-C were lower in the T2DM group. We did not check whether any of the partic-ipants were take lipid-lowering agents, which might afect the correlation with GDF15.
on the response to chronic inlammation and its compensatory secretion in IFG and T2DM. GDF15 is highly associated with IR, and the levels were signiicantly diferent between the NGT and IFG groups. Hence, GDF15 might be a novel biomarker for detecting IFG.
CONFLICTS OF INTEREST
No potential conlict of interest relevant to this article was re-ported.
ACKNOWLEDGMENTS
his study was supported by inancial support from the Basic Science Research Program through the National Research Foundation of Korea (NRF) funded by the Ministry of Educa-tion, Science and Technology (2012R1A2A1A03002833), MOE, and the Korean Healthcare Technology R&D project (A100588), MHW, Korea.
REFERENCES
1. Centers for Disease Control and Prevention. National diabetes fact sheet: national estimates and general information on dia-betes and prediadia-betes in the United States, 2011. Atlanta: U.S. Department of Health and Human Services, Centers for Dis-ease Control and Prevention; 2011.
2. Korea Centers for Disease Control and Prevention (KCDC) and the Korean Ministry of Health and Welfare: Diabetes fact sheet in Korea 2012. Available from: http://www.diabetes.or.kr/ temp/diabetes_factsheet_2013111.pdf (updated 2014 Oct 8). 3. Knowler WC, Barrett-Connor E, Fowler SE, Hamman RF,
La-chin JM, Walker EA, Nathan DM; Diabetes Prevention Pro-gram Research Group. Reduction in the incidence of type 2 di-abetes with lifestyle intervention or metformin. N Engl J Med 2002;346:393-403.
4. Hanefeld M. Cardiovascular beneits and safety proile of acar-bose therapy in prediabetes and established type 2 diabetes. Cardiovasc Diabetol 2007;6:20.
5. Tuomilehto J, Lindstrom J, Eriksson JG, Valle TT, Hamalainen H, Ilanne-Parikka P, Keinanen-Kiukaanniemi S, Laakso M, Louheranta A, Rastas M, Salminen V, Uusitupa M; Finnish Di-abetes Prevention Study Group. Prevention of type 2 diDi-abetes mellitus by changes in lifestyle among subjects with impaired glucose tolerance. N Engl J Med 2001;344:1343-50.
6. Goldberg R, Temprosa M, Otvos J, Brunzell J, Marcovina S, Mather K, Arakaki R, Watson K, Horton E, Barrett-Connor E. Lifestyle and metformin treatment favorably inluence lipopro-tein subfraction distribution in the Diabetes Prevention Pro-gram. J Clin Endocrinol Metab 2013;98:3989-98.
7. Schmidt MI, Duncan BB, Sharrett AR, Lindberg G, Savage PJ, Ofenbacher S, Azambuja MI, Tracy RP, Heiss G. Markers of inflammation and prediction of diabetes mellitus in adults (Atherosclerosis Risk in Communities study): a cohort study. Lancet 1999;353:1649-52.
8. Coban E, Sari R, Ozdogan M, Akcit F. Levels of plasma ibrino-gen and d-dimer in patients with impaired fasting glucose. Exp Clin Endocrinol Diabetes 2005;113:35-7.
9. Kahn BB. Type 2 diabetes: when insulin secretion fails to com-pensate for insulin resistance. Cell 1998;92:593-6.
10. Festa A, D’Agostino R Jr, Tracy RP, Hafner SM; Insulin Resis-tance Atherosclerosis Study. Elevated levels of acute-phase pro-teins and plasminogen activator inhibitor-1 predict the devel-opment of type 2 diabetes: the insulin resistance atherosclerosis study. Diabetes 2002;51:1131-7.
11. Donath MY, Shoelson SE. Type 2 diabetes as an inlammatory disease. Nat Rev Immunol 2011;11:98-107.
12. Coutinho M, Gerstein HC, Wang Y, Yusuf S. he relationship between glucose and incident cardiovascular events. A metare-gression analysis of published data from 20 studies of 95,783 in-dividuals followed for 12.4 years. Diabetes Care 1999;22:233-40. 13. Levitan EB, Song Y, Ford ES, Liu S. Is nondiabetic hyperglyce-mia a risk factor for cardiovascular disease? A meta-analysis of prospective studies. Arch Intern Med 2004;164:2147-55. 14. Deedwania PC, Fonseca VA. Diabetes, prediabetes, and
cardio-vascular risk: shiting the paradigm. Am J Med 2005;118:939-47. 15. Bootcov MR, Bauskin AR, Valenzuela SM, Moore AG, Bansal
M, He XY, Zhang HP, Donnellan M, Mahler S, Pryor K, Walsh BJ, Nicholson RC, Fairlie WD, Por SB, Robbins JM, Breit SN. MIC-1, a novel macrophage inhibitory cytokine, is a divergent member of the TGF-beta superfamily. Proc Natl Acad Sci U S A 1997;94:11514-9.
16. Hotamisligil GS, Arner P, Caro JF, Atkinson RL, Spiegelman BM. Increased adipose tissue expression of tumor necrosis factor-alpha in human obesity and insulin resistance. J Clin In-vest 1995;95:2409-15.
18. Kempf T, Guba-Quint A, Torgerson J, Magnone MC, Haeliger C, Bobadilla M, Wollert KC. Growth diferentiation factor 15 predicts future insulin resistance and impaired glucose control in obese nondiabetic individuals: results from the XENDOS trial. Eur J Endocrinol 2012;167:671-8.
19. Tominaga M, Eguchi H, Manaka H, Igarashi K, Kato T, Seki-kawa A. Impaired glucose tolerance is a risk factor for cardio-vascular disease, but not impaired fasting glucose. he Funa-gata Diabetes Study. Diabetes Care 1999;22:920-4.
20. American Diabetes Association. Diagnosis and classiication of diabetes mellitus. Diabetes Care 2014;37 Suppl 1:S81-90. 21. Bergman M. Inadequacies of absolute threshold levels for
di-agnosing prediabetes. Diabetes Metab Res Rev 2010;26:3-6. 22. Alberti KG, Zimmet PZ. Deinition, diagnosis and
classiica-tion of diabetes mellitus and its complicaclassiica-tions. Part 1: diagno-sis and classiication of diabetes mellitus provisional report of a WHO consultation. Diabet Med 1998;15:539-53.
23. Siegelaar SE, Holleman F, Hoekstra JB, DeVries JH. Glucose vari-ability: does it matter? Endocr Rev 2010;31:171-82.
24. Raher MJ, Thibault HB, Buys ES, Kuruppu D, Shimizu N, Brownell AL, Blake SL, Rieusset J, Kaneki M, Derumeaux G, Picard MH, Bloch KD, Scherrer-Crosbie M. A short duration of high-fat diet induces insulin resistance and predisposes to adverse let ventricular remodeling ater pressure overload. Am J Physiol Heart Circ Physiol 2008;295:H2495-502.
25. Rohlfing C, Wiedmeyer HM, Little R, Grotz VL, Tennill A, England J, Madsen R, Goldstein D. Biological variation of gly-cohemoglobin. Clin Chem 2002;48:1116-8.
26. Gallagher EJ, Le Roith D, Bloomgarden Z. Review of hemoglo-bin A(1c) in the management of diabetes. J Diabetes 2009;1:9-17. 27. Sato KK, Hayashi T, Harita N, Yoneda T, Nakamura Y, Endo G,
Kambe H. Combined measurement of fasting plasma glucose and A1C is efective for the prediction of type 2 diabetes: the Kansai Healthcare Study. Diabetes Care 2009;32:644-6. 28. Lorenzo C, Wagenknecht LE, Hanley AJ, Rewers MJ, Karter AJ,
Hafner SM. A1C between 5.7 and 6.4% as a marker for identi-fying pre-diabetes, insulin sensitivity and secretion, and cardio-vascular risk factors: the Insulin Resistance Atherosclerosis Study (IRAS). Diabetes Care 2010;33:2104-9.
29. Kempf T, Horn-Wichmann R, Brabant G, Peter T, Allhoff T,
Klein G, Drexler H, Johnston N, Wallentin L, Wollert KC. Cir-culating concentrations of growth-diferentiation factor 15 in apparently healthy elderly individuals and patients with chronic heart failure as assessed by a new immunoradiometric sand-wich assay. Clin Chem 2007;53:284-91.
30. Hromas R, Huford M, Sutton J, Xu D, Li Y, Lu L. PLAB, a novel placental bone morphogenetic protein. Biochim Biophys Acta 1997;1354:40-4.
31. Lawton LN, Bonaldo MF, Jelenc PC, Qiu L, Baumes SA, Mar-celino RA, de Jesus GM, Wellington S, Knowles JA, Warburton D, Brown S, Soares MB. Identiication of a novel member of the TGF-beta superfamily highly expressed in human placenta. Gene 1997;203:17-26.
32. Paralkar VM, Vail AL, Grasser WA, Brown TA, Xu H, Vukicev-ic S, Ke HZ, Qi H, Owen TA, Thompson DD. Cloning and characterization of a novel member of the transforming growth factor-beta/bone morphogenetic protein family. J Biol Chem 1998;273:13760-7.
33. Baek SJ, Kim JS, Moore SM, Lee SH, Martinez J, Eling TE. Cy-clooxygenase inhibitors induce the expression of the tumor suppressor gene EGR-1, which results in the up-regulation of NAG-1, an antitumorigenic protein. Mol Pharmacol 2005;67: 356-64.
34. Tajiri Y, Mimura K, Umeda F. High-sensitivity C-reactive pro-tein in Japanese patients with type 2 diabetes. Obes Res 2005; 13:1810-6.
35. Dostalova I, Roubicek T, Bartlova M, Mraz M, Lacinova Z, Haluzikova D, Kavalkova P, Matoulek M, Kasalicky M, Haluzik M. Increased serum concentrations of macrophage inhibitory cytokine-1 in patients with obesity and type 2 diabetes mellitus: the inluence of very low calorie diet. Eur J Endocrinol 2009; 161:397-404.
36. Karczewska-Kupczewska M, Kowalska I, Nikolajuk A, Adams-ka A, Otziomek E, GorsAdams-ka M, Straczkowski M. Hyperinsu-linemia acutely increases serum macrophage inhibitory cyto-kine-1 concentration in anorexia nervosa and obesity. Clin En-docrinol (Oxf) 2012;76:46-50.