Effective Network Intrusion Detection using
Classifiers Decision Trees and Decision rules
G.MeeraGandhi
Department of Computer Science and Engineering, Sathyabama University, Chennai, India Email: [email protected]
Kumaravel Appavoo
Professor, Higher Colleges of Technology, Faculty of Business and Info tech, U.A.E. Email:[email protected]
S.K. Srivatsa
Professor, St.Joseph College of Engineering, Chennai, India Email: [email protected]
---ABSTRACT---In the era of information society, computer networks and their related applications are the emerging technologies. Network Intrusion Detection aims at distinguishing the behavior of the network. As the network attacks have increased in huge numbers over the past few years, Intrusion Detection System (IDS) is increasingly becoming a critical component to secure the network. Owing to large volumes of security audit data in a network in addition to intricate and vibrant properties of intrusion behaviors, optimizing performance of IDS becomes an important open problem which receives more and more attention from the research community. In this work, the field of machine learning attempts to characterize how such changes can occur by designing, implementing, running, and analyzing algorithms that can be run on computers. The discipline draws on ideas, with the goal of understanding the computational character of learning. Learning always occurs in the context of some performance task, and that a learning method should always be coupled with a performance element that uses the knowledge acquired during learning. In this research, machine learning is being investigated as a technique for making the selection, using as training data and their outcome. In this paper, we evaluate the performance of a set of classifier algorithms of rules (JRIP, Decision Tabel, PART, and OneR) and trees (J48, RandomForest, REPTree, NBTree). Based on the evaluation results, best algorithms for each attack category is chosen and two classifier algorithm selection models are proposed. The empirical simulation result shows the comparison between the noticeable performance improvements. The classification models were trained using the data collected from Knowledge Discovery Databases (KDD) for Intrusion Detection. The trained models were then used for predicting the risk of the attacks in a web server environment or by any network administrator or any Security Experts. The Prediction Accuracy of the Classifiers was evaluated using 10-fold Cross Validation and the results have been compared to obtain the accuracy.
Keywords: Classifier, Data mining, Decision Trees, Decision rules, Intrusion detection, KDD dataset, Machine learning,
Network security
---Date of Submission: July 05, 2010 Date of Acceptance: October 14, 2010
---1. INTRODUCTION
To defend against various cyber attacks and computer viruses, lots of computer security techniques have been intensively studied in the last decade, namely firewalls, anomaly and intrusion detection. Among them, Network Intrusion Detection (NID) has been considered to be one of the most promising methods for defending vibrant intrusion behaviors. Machine learning [1, 3] is a burgeoning new technology for mining knowledge from data. In data mining, the data is stored electronically and the search is automated—by computer. Economists, statisticians,
forecasters, and communication engineers have long worked with the idea that patterns in data can be sought automatically, identified, validated, and used for prediction. An IDS is a device that is placed inside a protected network to monitor what occurs within the network. The major objective of intrusion detection systems is :
To accurately detect anomalous network behaviour or misuse of resources
To Sort out the true attacks from false alarms
Many organizations now use intrusion detection systems to help them determine if their systems have been compromised (Carnegie Mellon University, 2001). Intrusion detection techniques using data mining as an important application area to analyze the huge volumes of audit data and realizing performance the optimization of detection rules. Different researchers propose different algorithms in different categories, from rules [8] to decision trees [6.7], from rule based models [8] to functions studying. The detection efficiencies therefore are becoming better and better than ever before.
However, to the best of our knowledge, a considerable comparison among these classification methods to pick out the best ones that suite the job of intrusion detection. A literature survey that was done by us also indicates a fact that, for intrusion detection, most researchers employed a single algorithm to detect multiple attack categories with depressing performance. Identifying attack category specific algorithms offers a promising research direction for improving intrusion detection performance.
In this paper, a comprehensive set of classifier algorithms will be evaluated on the KDD dataset [2, 7]. The attacks will be detected on the four attack categories: Probe (information gathering), DoS (deny of service), U2R (user to root), R2L (remote to local. The model for classifier algorithm for the best performing algorithms for each attack category is proposed.
The remainder of this paper is organized as follows. A quick and up-to-date literature survey on attempts for designing Intrusion Detection Systems using the KDD dataset in Section 2. Section 3 will explain in detail about our simulation study (classifiers, evaluation setup and performance comparison).
Two models will be proposed in Section 4, to prove the effectiveness of our models; implementing issues will also be discussed here. Finally, Section 5 will conclude our study and discuss the future works. Section 6 concludes with the References.
2. RELATED WORK
This novelty detection approach was employed to detect attack categories in the KDD dataset. The technique has achieved the detection rate of 96.71% of DoS, 99.17% of Probe, 93.57% of U2R and 31.17% of R2L respectively. However, due to the fact that no FP was reported by the research scientists a nearly impossible detection rate [5] of 93.57% of U2R category.
In 2006, Xin Xu et al. [4] presented a framework for adaptive intrusion detection based on machine learning. Multi-class Support Vector Machines (SVMs) is applied to classifier construction in IDSs and the performance of
SVMs is evaluated on the KDD99 dataset. Promising results were given: 76.7%, 81.2%, 21.4% and 11.2% detection rate for DoS, Probe, U2R, and R2L respectively while FP is maintained at the relatively low level of average 0.6% for the four categories.
However, our proposed study can only use a very small set of data (10,000 randomly sampled records) comparing to the huge original dataset (5 million audit records). Yang Li and Li Guo [7] though realized the deficiencies of KDD dataset, developed a supervised network intrusion detection method based on Transductive Confidence Machines for K-Nearest Neighbors (TCM-KNN) machine learning algorithm and active learning based training data selection method. The new method is evaluated on a subset of KDD dataset by random sampling 49,402 audit records for the training phase and 12,350 records for the testing phase. An average TP of 99.6% and FP of 0.1% was reported but no further information about the exact detection rate of each attack categories was presented by the authors.
Literature survey showed that, for all practical purposes, most of the researchers applied a single algorithm to address all four major attack categories. This motivated us to our assumption that different algorithms would perform with different predictions on different attack categories may yield a good performance and high prediction, comparatively.
3. EMPIRICAL STUDY
In order to verify the effectiveness of different classifiers algorithms for the field of intrusion detection, Nsl-KDD [7] dataset has been used to make relevant experiments step-by-step.
1) Initially, in order to build the experiment evaluation environment with major steps:
a) Environment setup
b) Data preprocessing c) Choosing the data mining Software.
2) Secondly, a comprehensive set of
most popular classifier algorithms were selected to represent a wide variety of categories like Decision rules and Decision trees..
3) An overview of how specific values of the these algorithms were identified as well as their Detection performance will be Studied. 4) Finally, the performance Comparison between ten selected Classifiers will be achieved..
3.1 Evaluation Setup
2 GB RAM, and the operation system platform is Microsoft Windows 7. An open source machine learning package – Weka (the latest Windows version: Weka 3.7.1). Weka is a collection of machine learning algorithms for data mining tasks that contains tools for data preprocessing, classification, regression, clustering, association rules, and visualization. This empirical study, however, only deals with a subset of classifier algorithms.
All the machine learning technique [4] that will be used in this paper are implemented inWeka so that they will be easily and fairly compared to each other. The dataset to be used in our experiments in Nsl-KDD labeled dataset. The main reason to use this dataset is that the relevant data that can easily be shared with other researchers, allowing all kinds of techniques to be easily compared in the same baseline.
The Nsl-KDD data-set might have been criticized for its potential problems [7], but the fact is that it is the most widespread dataset that is used by many researchers and it is among the few comprehensive datasets that can be shared in intrusion detection nowadays. Like the test dataset, the Nsl-KDD dataset contains one type of normal data and 22 different types of attacks that are broadly categorized in four groups of DoS, Probes, U2R and R2L. Table 1 shows the Distribution of Classes in the actual training data for classifiers evaluation and the percentage of attacks is displayed using Pie chart in the Fig. 1.
Table 1. Distribution of Classes in the actual training Category of
attacks (Class)
Number of records
Percentage of Class Occurrences
Normal 34821 53.14%
DOS 24029 36.66%
R2L 548 0.84%
Probe 6108 9.32%
U2R 28 0.04%
Total 65534 100%
Figure 1. Percentage of attack occurrences
The packet information in the original TCP dump files were summarized into connections. This process resulting in 41 features for each connection, and one final feature for classifying as a category. Therefore, each instance of data consists of 41 features and each instance of them can be directly mapped and discussed in classifiers algorithms. Due to the huge number of audit data records in the original Nsl-KDD dataset, 65534 instances have been extracted as datasets for our experiments.
3.2 Classifier Algorithms
3.2.1 J48 (C4.5 Decision Tree Revision 8)
Perhaps C4.5 algorithm which was developed by Quinlan [5] is the most popular tree classifier. Weka classifier package has its own version of C4.5 known as J48. J48 is an optimized implementation of C4.5 rev. 8. J48 is experimented is this study with the Parameters: confidenceFactor = 0.25; numFolds = 3; seed = 1; unpruned = False.
3.2.2 NBTree
NBTree [9] is a hybrid between decision trees and NaïveBayes. It creates trees whose leaves are NaïveBayes classifiers for the instances that reach the leaf. It is quite reasonable to expect that NBTree can outperform NaïveBayes; but instead, we may have to scarify some speed.
3.2.3 Decision Table
Decision Table [3] builds a decision table majority classifier. It evaluates feature subsets using best-first search and can use cross-validation for evaluation. There is a set of methods that can be used in the search phase (E.g.: Best First, RankSearch, GeneticSearch) and we may also use LBk to assist the result. In this experiment, we choose the crossVal = 1; searchMethod = BestFirst and useIBk = False 3.2.4 JRip (RIPPER)
rules for the class is generated using incremental reduced-error pruning. We evaluate RIPPER through JRip, an implementation of RIPPER in Weka with the parameters: folds = 3; minNo = 2; optimizations = 2; seed = 1; usePruning = true.
3.2.5 OneR
OneR [3] is another basic algorithm using Rule based model. It generates a one-level decision tree expressed in the form of a set of rules that all test one attribute. OneR is a simple, cheap method that often comes up with quite good rules for characterizing the structure in data.
3.3 Performance Comparison
Best performing instances of all the five classifiers selected in Section 3.2 were evaluated on the KDD dataset. Simulation results are given in the Table 4. To compare the classifiers, TP (True positive) and FP (False Positive), Prediction Accuracy and learning time to build the model in seconds for each algorithm are considered. These parameters will be the most important criteria for the classifier to be considered as the best algorithm for the given attack category. Table 2 shows the Evaluation criteria for Decision rules.
Table 2. Evaluation criteria for Decision Rules
Evalua tion criteria
Classifiers Rules JRip Decision
table
PART One R
TTBM (Secs)
285.98 48.31 79.67 1.88
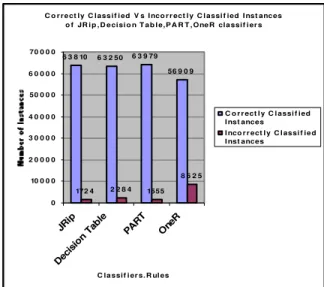
CCI 63810 63250 63979 56909
ICCI 1724 2284 1555 8625
PA 97.36 %
96.51 %
97.62 %
86.83 %
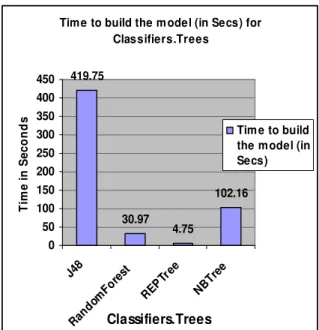
As shown in Fig. 3 and Table 1, it has depicted that JRip has taken 285.98 seconds to build the model for decision rules. From Fig. 2, it has depicted that J48 has taken 419.75 seconds to build the model for Decision Trees than Decision Rules.
Time to build the m odel (in Secs) for Classifiers.Trees
419.75
30.97 4.75
102.16
0 50 100 150 200 250 300 350 400 450
J48
Rando mFor
est
REP Tree
NBT ree
Classifiers.Trees
Ti
m
e
i
n
S
e
c
ond
s
Tim e to build the model (in Secs)
Figure 2. Time to build the Model (in Sec) for trees
Tim e to build the m odel (in Secs) for Classifiers.Rules
285.98
48.31
79.67
1.88 0
50 100 150 200 250 300 350
JRip Decision table
PART OneR
Classifiers.Rules
Ti
m
e
( i
n
S
e
c
s
)
Tim e to build the m odel (in Secs)
Figure 3. Time to build the Model (in Sec) for rules
Besides, it is very important to record Prediction (PA Accuracy = Total correctly classified instances/Total instances) * 100 and Training Time (TT) of each algorithm. In the selection process, one algorithm will be disqualified if its PA is too low, despite its outstanding performance in one specific attack category. TT on the other hand, will give us the idea about which algorithm can be implemented in a real-time Network Intrusion Detection System.
others. The Prediction Accuracy of JRip has 97.36% and PART has the very high yield of Prediction Accuracy of 97.62% than other Decision Rules. OneR Classifiers has very less predictive performance of 86.83%. A Decision table classifier has a comparable performance of 96.54%. Table 3 shows the Evaluation criteria for Decision Trees. Table 3. Evaluation criteria for Decision Trees
Evaluat ion criteria
Classifiers Trees
J48 RF REP Tree
NB Tree
TTBM( Secs)
419.75 30.97 4.75 102.16
CCI 65341 64038 63808 63901
ICCI 193 1496 1726 1633
PA 99.70 %
97.71 %
97.36 %
97.50 %
The J48 Classifier achieved the highest Prediction Accuracy of 99.70% in 419.75 Seconds with 11 features and 65534 instances with 65341 Correctly Classified Instances (CCI).
Random Forest (RF) is the next highest accuracy result achieved among the other Decision trees. REPTree has achieved 97.36% and NBTree has achieved 97.50% accuracy.
As shown in Fig. 4, J48 a Decision Tree Classifier predicts better than other algorithms. Among the four classifiers used for the experiment, the decision tree induction algorithm (J48) show the Correctly Classified Instances (CCI) of 65341 from the total of 65534 instances and others makes a little difference in the Prediction Accuracy (PA). Random Forest shows the next higher Correctly Classified Instances. The accuracy rate of REPTree classifier is the lowest among the four Tree Classifiers.
Best performing instances of all the 2 classifiers selected in Section 3.2 were evaluated on the KDD dataset. To compare the classifiers, TP and FP, Prediction Accuracy (PA) and Correctly Classified (CC) and Incorrectly Classified (IC), Time to build the model in seconds (TTBM) of each algorithm is obtained. These parameters will be the most important criteria for the classifier to consider as the best algorithm for the given attack category. The predictions of Tree and Rules Classifier category are shown in the Table 2 and in Table 3.
100 * tan
tan )
( Pr
ces ins
of number Total
ces ins
Classified Correctly
Total PA
Accuracy
ediction =
Correctly Classified Instances Vs Incorrectly Classified Instances in J48,Random Forest,REPTree,NBtree
Classifiers 65341 64038 63808 63901
193 1496 1726 1633 0
10000 20000 30000 40000 50000 60000 70000
Tree Tree
J48 Random Forest
REP NB
Classifiers.Trees
N
u
m
b
er
o
f I
n
st
an
ce
s Correctlyclsssified
Instances
Incorrectly Classified Instances
Figure 4. Correctly Classified vs. Incorrectly classified Instances of classifiers. Trees
Table 4. Attack categories with low FPR Classifier
Category
Classification algorithms
Attack Category
Low FPR
Trees J48 DOS 0.001
J48 R2L 0
J48 Probe 0
J48,RF, REPTree,
NBTree
U2R 0
Rules JRip, Decision
Table
DOS 0.001
OneR R2L 0
JRip, DT, PART
Probe 0.002 JRip, DT,
PART,OneR
C o r r e ct ly C lass if i ed V s I nco r r ect l y C l assi f ied I nst anc es o f JR i p , D e cisi o n T a b l e,P A R T , One R cla ssif i er s
6 3 8 10 6 3 2 50 6 3 9 79 56 9 0 9
172 4 2 2 8 4 1555 8 6 2 5
0 10 0 0 0 2 0 0 0 0 3 0 0 0 0 4 0 0 0 0 50 0 0 0 6 0 0 0 0 70 0 0 0
JRi p Deci sion Ta ble PAR T One R
C la ssif i er s. R ul es
C o r r ect l y C l assi f ied I nst ances
I nco r r ect l y C l assi f ie d I nst ances
Figure 5. Correctly Classified vs Incorrectly Classified Table 4 depicts the Tree Classifier Category of J48 has shown the Low False Positive Rate (FPR) of 0.001 compared with Random forest, REP Tree, NB Tree and JRip, decision Table has the low FPR of 0.001 for DOSattacks. OneR from Rules category and J48 of Trees category has achieved 0% of FPR for R2L attacks. JRip, Decision Table, PART classifiers has shown the Low FPR from Rules Category has achieved 0.002 for probe attacks; J48 from Rules Category has achieved 0% for R2L attacks.
Prediction Accuracy of JRip, Decision Table,PART,OneR Classifiers.Rules 97.37% 96.51% 97.63% 86.84% 80.00% 82.00% 84.00% 86.00% 88.00% 90.00% 92.00% 94.00% 96.00% 98.00% 100.00% JRip Decision Table PART OneR Classifiers.Rules A ccu rac y o f P red ic ti o n (% ) Prediction Accuracy
Figure 6. Prediction accuracy for classifiers. Rules And also, it has depicted that the JRip, Decision Table, PART, OneR has shown the Low FPR from Rules Category and J48, RandomForest, REPTree, NBTree from Rules Category has achieved 0% for U2R attacks. Fig. 5 Correctly Classified vs. Incorrectly classified instances of decision Rules. Fig. 6 illustrates the prediction accuracy of the four schemes under consideration. Fig. 7 depicts the prediction accuracy of
decision trees. Fig. 8 depicts the Prediction accuracy for Decision Trees vs. Decision Rules.
Prediction Accuracy of J48,RandomForest,REPTree,NBTree 99.71% 97.72% 97.37% 97.51% 96.00% 96.50% 97.00% 97.50% 98.00% 98.50% 99.00% 99.50% 100.00% J48 Ran dom Fore st REPT ree NBT ree Classifiers.Trees Acc u ra cy o f P red ict io n ( % ) Prediction Accuracy
Figure 7. Prediction accuracy for classifiers.Rules
Pre diction Accuracy of trees.J48 and Rules .PART
99.71% 97.63% 96.50% 97.00% 97.50% 98.00% 98.50% 99.00% 99.50% 100.00%
trees .J48 Rule s.PART
Clas sifiers(TREES vs RULES)
P e rcen ta g e o f Accu racy( % ) prediction accuacy
Figure 8. Trees.J48 Vs Rules. PART (Prediction Accuracy)
4
CONCLUSION
Professional or the Administrators to assess the risk of the attacks.
5. REFERENCES
[1]. Witten, I.H., Frank, E.: Data Mining: Practical Machine Learning Tools and Techniques, 2nd edn. Morgan Kaufmann, San Francisco (2005).
[2]. Tavallaee M.E, Bagheri W. Lu and Ghorbani A. (2009), “A Detailed Analysis of the KDD CUP 99 Data Set”, Proceedings of the Second IEEE Symposium on Computational Intelligence for Security and Defense Applications (CISDA), pp. 53-58.
[3]. Xu, X.: Adaptive Intrusion Detection Based on Machine Learning: Feature Extraction, Classifier Construction and Sequential Pattern Prediction. International Journal of Web Services Practices 2(1-2), 49–58 (2006).
[4]. Li, Y., Guo, L.: An Active Learning Based TCM-KNN Algorithm for Supervised Network Intrusion Detection. In: 26th Computers & Security, pp. 459–467 (October 2007)
[5]. Quinlan, J.: C4.5: Programs for Machine Learning. Morgan Kaufmann, San Mateo (1993).
[6]. “Nsl-KDD data set for network-based intrusion detection systems.” Available on: http://nsl.cs.unb.ca/NSL-KDD .
[7]. Panda M. and Patra M.R (2008), “A Comparative study of Data Mining
Algorithms for Network Intrusion Detection”, Proceedings of the 1st Conference on Emerging Trends in Engineering and Technology, pp. 504-507, IEEE Computer Society, USA.
[8]. Langley P. and Simon H. A (1995), “Applications of machine learning and rule induction”, Communications of the ACM, Vol.38, No. 11, pp. 55–64.
[9]. Amor N.B, Benferhat S. and Elouedi Z (2004), “Naïve Bayes vs. Decision Trees in Intrusion Detection Systems”, Proceedings of 2004, ACM Symposium on Applied Computing, pp. 420-424.