www.atmos-chem-phys.net/16/11107/2016/ doi:10.5194/acp-16-11107-2016
© Author(s) 2016. CC Attribution 3.0 License.
Effects of 20–100 nm particles on liquid clouds in
the clean summertime Arctic
W. Richard Leaitch1, Alexei Korolev1, Amir A. Aliabadi1,a, Julia Burkart2, Megan D. Willis2, Jonathan P. D. Abbatt2, Heiko Bozem3, Peter Hoor3, Franziska Köllner4, Johannes Schneider4, Andreas Herber5, Christian Konrad5, and Ralf Brauner6
1Environment and Climate Change Canada, Toronto, Canada 2Department of Chemistry, University of Toronto, Toronto, Canada 3Institute for Atmospheric Physics, University of Mainz, Mainz, Germany
4Particle Chemistry Department, Max Planck Institute for Chemistry, Mainz, Germany
5Alfred Wegener Institute Helmholtz Centre for Polar and Marine Research, Bremerhaven, Germany 6Department of Maritime and Logistics Studies, Jade University, Elsfleth, Germany
anow at: Environmental Engineering, University of Guelph, Guelph, Canada
Correspondence to:W. Richard Leaitch ([email protected])
Received: 10 December 2015 – Published in Atmos. Chem. Phys. Discuss.: 29 January 2016 Revised: 28 July 2016 – Accepted: 1 August 2016 – Published: 8 September 2016
Abstract. Observations addressing effects of aerosol par-ticles on summertime Arctic clouds are limited. An air-borne study, carried out during July 2014 from Resolute Bay, Nunavut, Canada, as part of the Canadian NETCARE project, provides a comprehensive in situ look into some effects of aerosol particles on liquid clouds in the clean environment of the Arctic summer. Median cloud droplet number concentrations (CDNC) from 62 cloud samples are 10 cm−3for low-altitude cloud (clouds topped below 200 m)
and 101 cm−3for higher-altitude cloud (clouds based above
200 m). The lower activation size of aerosol particles is
≤50 nm diameter in about 40 % of the cases. Particles as
small as 20 nm activated in the higher-altitude clouds consis-tent with higher supersaturations (S) for those clouds inferred
from comparison of the CDNC with cloud condensation nu-cleus (CCN) measurements. Over 60 % of the low-altitude cloud samples fall into the CCN-limited regime of Mauritsen et al. (2011), within which increases in CDNC may increase liquid water and warm the surface. These first observations of that CCN-limited regime indicate a positive association of the liquid water content (LWC) and CDNC, but no associ-ation of either the CDNC or LWC with aerosol variassoci-ations. Above the Mauritsen limit, where aerosol indirect cooling may result, changes in particles with diameters from 20 to 100 nm exert a relatively strong influence on the CDNC.
Within this exceedingly clean environment, as defined by low carbon monoxide and low concentrations of larger parti-cles, the background CDNC are estimated to range between 16 and 160 cm−3, where higher values are due to activation of particles≤50 nm that likely derive from natural sources.
These observations offer the first wide-ranging reference for the aerosol cloud albedo effect in the summertime Arctic.
1 Introduction
burn-ing (BB) particles as warmburn-ing agents for the Arctic (e.g. Law and Stohl, 2007; Quinn et al., 2008; Shindell et al., 2008; Brock et al., 2011; Jacob et al., 2010; UNEP, 2011; Stohl et al., 2013). Recent evidence indicates that the net impact of aerosol particles on the Arctic over the past century has been one of cooling rather than warming (Najafi et al., 2015).
Low-level liquid water clouds are frequent in the sunlit Arctic summer (e.g. Intrieri et al., 2001), and these clouds can have a net cooling effect (e.g. Brenner et al., 2001; ret et al., 2004; Lubin and Vogelmann, 2010; Zhao and Gar-rett, 2015; Zamora et al., 2016). Knowledge of the influ-ence of the atmospheric aerosol on climatic aspects of these clouds is complicated by the relatively large potential dif-ferences in the albedo of the underlying surface (e.g. Her-man, 1977; Lubin and Vogelmann, 2010) and the fact that the Arctic is relatively free of anthropogenic influence in summer, which means that particles from natural sources can be the most significant nuclei for cloud droplets. Those sources shift the number distribution toward particles smaller than 100 nm (e.g. Heintzenberg and Leck, 1994; Ström et al., 2003; Heintzenberg et al., 2006; Engvall et al., 2008; Tunved et al., 2013; Leaitch et al., 2013; Heintzenberg et al., 2015). Particles smaller than 100 nm are often dismissed as being too small to nucleate cloud droplets due to the as-sumption that the cooling mechanisms are too slow to gener-ate the supersaturation (S) required to activate the smaller
particles in Arctic liquid clouds (e.g. Garret et al., 2004; Lubin and Vogelmann, 2010; Browse et al., 2014; Zhao and Garrett, 2015). That assumption may lead to reduced estimates from natural feedbacks to climate and increased estimates of aerosol indirect forcing from anthropogenic sources. Lohmann and Leck (2005) hypothesized the need for highly surface-active particles to explain cloud conden-sation nucleus (CCN) activity atSless than 0.3 %. However,
cloud S is also strongly constrained by the concentrations
of particles larger than 100 nm, and, in the clean summer-time Arctic environment with relatively low concentrations of particles larger than 100 nm, there is some evidence that higherSmay be achieved and smaller particles activated (e.g.
Hudson et al., 2010; Korhonen et al., 2008; Leaitch et al., 2013). Further, the suggestion that the minima between 50 and 100 nm in Arctic particle size distributions result from cloud processing implies consistent activation sizes less than 100 nm (Heintzenberg et al., 2015). The effect of the back-ground aerosol on liquid clouds has been identified as one of the most important factors for reducing uncertainty in the aerosol cloud albedo effect (Carslaw et al., 2013). Moreover, the effectiveness of particles smaller than 100 nm for cloud droplet nucleation is a large factor in that uncertainty.
Effects of pollution on clouds may also lead to warming, but a reference to clean clouds is still required (e.g. Garrett et al., 2009). Mauritsen et al. (2011) modelled cloud radiative forcing for low clouds using CCN number concentrations derived from shipborne observations over the Arctic Ocean (Tjernström et al., 2004, 2014). They found the impact from
changes in CCN for ultra-low values (< 10 cm−3), where CCN concentrations are equivalent to model cloud droplet number concentration (CDNC), results in a net warming due to associated long-wave changes, whereas for concentrations greater than 10 cm−3 CCN increases are estimated to
pro-duce a net atmospheric cooling. This CCN concentration threshold is referred to here as the “Mauritsen limit”, al-though this value of 10 cm−3is not a universal limit (Maurit-sen et al., 2011). In the clean summertime Arctic, knowledge of the natural aerosol and its influence on cloud microphysics is critical to the assessment of aerosol effects on Arctic cli-mate.
Past studies of Arctic aerosols and clouds have empha-sized the areas of the Beaufort and Chukchi seas (e.g. Hobbs and Rango, 1998; Curry, 2001, and references therein; Lohmann et al., 2001; Yum and Hudson, 2001; Peng et al., 2002; Wylie and Hudson, 2002; Earle et al., 2011; Lance et al., 2011; Jouan et al., 2014; Klingebiel et al., 2015). Most of those studies have focused on springtime when the aerosol can be influenced by anthropogenic or BB sources. As well, there has been considerable interest in mixed-phase clouds in the lower Arctic troposphere (e.g. Shupe et al., 2004; Sand-vik et al., 2007; Morrison et al., 2012), but a notable lack of in situ aerosol observations in combination with liquid water clouds over the summertime Arctic. Among the studies that have considered in situ aerosol measurements and summer-time Arctic clouds, Zamora et al. (2016) examined the effi-ciency of BB plumes on indirect forcing. They estimated half of the possible maximum forcing from these plumes, mostly due to the reduction in cloud-base S by higher
concentra-tions of larger particles that control water uptake. Shupe et al. (2013) discussed some differences between clouds coupled and uncoupled to the surface. They did not con-duct in situ cloud microphysics observations, and their ver-tical aerosol characterizations were constrained to particles > 300 nm. Hobbs and Rango (1998) found that droplets in low clouds in June over the Beaufort Sea occasionally con-tained drops as large as 35 µm diameter. They also found that top CDNC correlated significantly with cloud-base “aerosols”. They suggested that cloud-top entrainment did not control CDNC, although there may be times when entrainment influences Arctic CDNC (e.g. Klingebiel et al., 2015).
are compared with droplet number concentrations from the inside of clouds. Specifically, in the indicated sections, the following questions are addressed.
1. Given the scarcity of data, what are the characteristics of clouds in the summertime Arctic, and do clouds near the surface have characteristics different from those aloft? (Sect. 3.2)
2. What are the sizes of particles that act as nuclei for cloud droplets? Will this allow a closer connection be-tween aerosol processes, particle sizes and climate ef-fects? (Sect. 3.3)
3. What is the relationship between droplet size and droplet number? In particular, what is the aerosol in-fluence on cloud below the Mauritsen limit, and is it possible to assess a background influence of the aerosol on clouds in the Arctic summer? (Sect. 3.4)
2 Methodologies
The instrument platform was the Alfred Wegener Institute (AWI) Polar 6 aircraft, a DC-3 aircraft converted to a Basler BT-67 (see Herber et al., 2008).
2.1 Instrumentation
The following measurements are relevant to this discussion: a. Particle number concentrations > 5 nm diameter were
measured with a TSI 3787 water-based ultrafine con-densation particle counter (UCPC), sampling at a flow rate of 0.6 L min−1. Hereafter, these measurements are referred to as N5.
b. Aerosol particle size distributions from 20 to 100 nm (45 s up scans and 15 s down scans) were measured us-ing a Brechtel Manufacturus-ing Incorporated (BMI) scan-ning mobility system (SMS) coupled with a TSI 3010 condensation particle counter (CPC). The sheath and sample flows were set to 6 and 1 L min−1. BMI software was used to process these distributions.
c. Aerosol particle size distributions from 70 nm to 1 µm were measured using a Droplet Measurement Technol-ogy (DMT) ultra-high sensitivity aerosol spectrome-ter (UHSAS) that detects particles using scatspectrome-tering of 1054 nm laser light (e.g. Cai et al., 2008).
d. CCNC (0.6 %) were measured using a DMT CCN model 100 counter operating behind a DMT low-pressure inlet at approximately 650 hPa. For the nomi-nal waterSof 1 %, the effectiveSat 650 hPa was found
to be 0.6 % as discussed in the Supplement. ThisSwas
held constant throughout the study for greater measure-ment stability and improved response and to examine the hygroscopicity of smaller particles.
e. Droplet size distributions from 2 to 45 µm were mea-sured with a Particle Measuring Systems (PMS) FSSP-100. This FSSP-100 had been modified with new tips to reduce shattering artifacts (Korolev et al., 2011). It was mounted in a canister under the port-side wing. The CDNC, VMD and LWC are calculated from the mea-sured droplet distributions.
f. Two-dimensional cloud particle images from about 50 to 800 µm were measured using a PMS 2D-C greyscale probe. These observations are used here only to ensure the absence of the ice phase. This 2D-C probe was also modified with new tips to reduce shattering artifacts (Korolev et al., 2011). It was mounted in a canister be-side the FSSP-100.
g. Carbon monoxide (CO) is used here as a relative indi-cator of aerosol influenced by pollution sources and as a potential tracer for aerosol particles entering cloud. CO was measured with an Aerolaser ultra-fast CO mon-itor model AL 5002 based on vacuum ultraviolet fluo-rimetry, employing the excitation of CO at 150 nm. This instrument was modified such that in situ calibrations could be conducted in flight.
Details of the instrument calibration and evaluations are given in the Supplement (Sect. S1).
2.2 State parameters and winds
State parameters and meteorological measurements were made with an AIMMS-20, manufactured by Aventech Re-search Inc. This instrument consists of three modules: (1) an air data probe that measures the three-dimensional aircraft-relative flow vector (true air speed, angle-of-attack and sideslip), temperature, and relative humidity and includes a three-axis accelerometer pack for turbulence measurement; (2) an inertial measurement unit that consists of three gy-ros and three accelerometers providing the aircraft angular rate and acceleration; (3) a global positioning system for air-craft 3-D position and inertial velocity. Horizontal and ver-tical wind speeds were measured with accuracies of 0.50 and 0.75 m s−1, respectively. However, the vertical resolu-tion was insufficient to measure gusts in the sampled clouds. The accuracy and resolution for temperature measurement are 0.30 and 0.01◦C. The accuracy and resolution for rela-tive humidity measurement are 2.0 and 0.1 %. The sampling frequency is 1 Hz.
2.3 Inlets
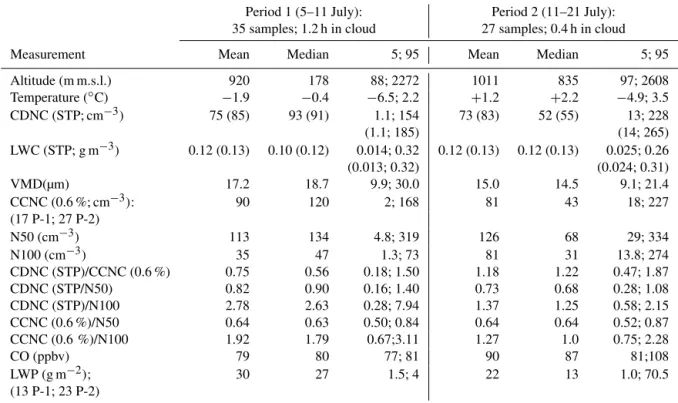
mani-Table 1.Summary of averaged cloud observations with LWC > 0.01 g m−3for study periods 1 and 2. Values without parentheses are refer-enced to ambient volumes and values in parentheses are referrefer-enced to standard atmospheric pressure and temperature (STP). 5 and 95 are the 5th and 95th percentiles.
Period 1 (5–11 July): Period 2 (11–21 July): 35 samples; 1.2 h in cloud 27 samples; 0.4 h in cloud
Measurement Mean Median 5; 95 Mean Median 5; 95
Altitude (m m.s.l.) 920 178 88; 2272 1011 835 97; 2608 Temperature (◦C) −1.9 −0.4 −6.5; 2.2 +1.2 +2.2 −4.9; 3.5 CDNC (STP; cm−3) 75 (85) 93 (91) 1.1; 154 73 (83) 52 (55) 13; 228
(1.1; 185) (14; 265)
LWC (STP; g m−3) 0.12 (0.13) 0.10 (0.12) 0.014; 0.32 0.12 (0.13) 0.12 (0.13) 0.025; 0.26 (0.013; 0.32) (0.024; 0.31)
VMD(µm) 17.2 18.7 9.9; 30.0 15.0 14.5 9.1; 21.4
CCNC (0.6 %; cm−3): 90 120 2; 168 81 43 18; 227
(17 P-1; 27 P-2)
N50 (cm−3) 113 134 4.8; 319 126 68 29; 334
N100 (cm−3) 35 47 1.3; 73 81 31 13.8; 274
CDNC (STP)/CCNC (0.6 %) 0.75 0.56 0.18; 1.50 1.18 1.22 0.47; 1.87 CDNC (STP/N50) 0.82 0.90 0.16; 1.40 0.73 0.68 0.28; 1.08 CDNC (STP)/N100 2.78 2.63 0.28; 7.94 1.37 1.25 0.58; 2.15 CCNC (0.6 %)/N50 0.64 0.63 0.50; 0.84 0.64 0.64 0.52; 0.87 CCNC (0.6 %)/N100 1.92 1.79 0.67;3.11 1.27 1.0 0.75; 2.28
CO (ppbv) 79 80 77; 81 90 87 81;108
LWP (g m−2); 30 27 1.5; 4 22 13 1.0; 70.5
(13 P-1; 23 P-2)
fold off of which sample lines were drawn to the various in-strument racks using angled inserts. Total flow at the intake point was approximately isokinetic at 55 L min−1 based on the sum of flows drawn by the instrumentation (35 L min−1) and the measured manifold exhaust flow. The manifold ex-haust flowed freely into the back of the cabin such that the intake flow varied with aircraft true airspeed and the mani-fold was not significantly overpressured.
CO was sampled through a separate inlet consisting of a 0.40 cm OD Teflon tube using aircraft forward motion to push air into the line in combination with a rear-facing 0.95 cm OD Teflon exhaust line that reduced the line pres-sure. The continuously measured sample flow was approxi-mately 12 L min−1.
2.4 Data analysis approach
Eleven research flights were conducted from Resolute Bay, Nunavut (74◦40′48′′N, 94◦52′12′′W), from 4 to 21 July 2014, inclusive. These measurements were associated with two distinct weather regimes. During period 1 (4–12 July), weather conditions around Resolute Bay were affected by an upper low (Supplement Fig. S4). The wind speeds at 500 hPa were mostly light and variable. The surface (1000 hPa) was dominated by weak high pressure with generally clear skies, light winds and occasional scattered to broken stratocumu-lus. Low-cloud or fog was at times present in association with
Figure 1. Compilation of the flight tracks. All flights originated from Resolute Bay (74◦40′48′′N, 94◦52′12′′W).
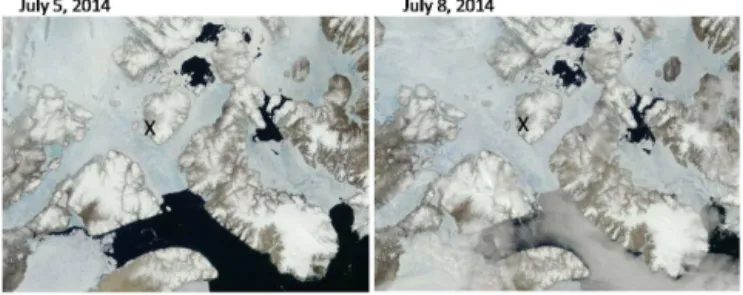
Figure 2.Satellite images from 5 July when LA clouds were sam-pled over the two polynyas to the north and from 8 July when LA clouds were sampled along Lancaster Sound. Lancaster Sound is cloud free on 5 July and mostly covered by cloud on 8 July. Resolute Bay is marked with a “X”. Images are courtesy of NASA World-view: https://earthdata.nasa.gov/labs/worldview/.
more wind and higher cloud. The air was not as clean as dur-ing period 1, based on the measured aerosol mass and CO concentrations (see Table 1). This was possibly due to trans-port of BB aerosol from the Northwest Territories; further discussion in Sect. 2.3.1. Based on the bulk Richardson num-ber and data from radiosondes, Aliabadi et al. (2016a) esti-mated boundary-layer heights at 254 m (±155 m) across the
study.
A summary of all flight tracks is shown in Fig. 1. Flights mostly consisted of vertical profiles and low-level transits over ice, water and melt ponds that contributed to the for-mation of low cloud; low cloud is defined here as cloud tops below 200 m m.s.l. Higher-level cloud was also sampled dur-ing the profiles and transits. The polynyas that were sampled are shown in the top centre of each panel of Fig. 2. Cloud was sampled on 8 of the 11 flights, more frequently during period 1 because of overall better visual contrast between clouds and surfaces. Furthermore, period 2 was marked by the presence of the Canadian Coast Guard Ship Amundsen in Lancaster
Sound (bottom centre of each Fig. 2 panel) when the flights were focused on sampling the ship’s plume (e.g. Aliabadi et al., 2016b).
All aerosol number concentrations are given in terms of standard atmospheric pressure and temperature (STP: 1 atm and 15◦C). The CDNC are also referenced to STP where comparisons are made with the aerosol number concentra-tions. Number concentrations of particles larger than 100 nm (N100) are taken from the UHSAS. All data, except the SMS, are 1 s averages that represent a sampling path length of 60– 80 m. Size distributions between 20 and 100 nm are from the SMS and are 1 min averages. Except for the Fig. S3 exam-ple, all particle number concentrations smaller than 100 nm are from the SMS. Nx-100 refers to the number concentra-tion within the interval “x-100” wherex ranges between 20
and 90. Values of Nx withx< 100 are derived from the sum
of Nx-100 (SMS)+N100 (UHSAS).
Clouds were sampled during a flight whenever possible, mostly by ascending or descending through them. It was not
possible to sample below the low-altitude (LA) cloud bases. Most clouds were liquid phase, based on the 2D-C grey im-ages of cloud particles > 50 µm, and only liquid-phase clouds are discussed here. In addition, none of the liquid clouds ex-hibited detectable precipitation, except that droplets in a cou-ple of the lowest-altitude clouds were very low in number and relatively large in size (30–40 µm); considering the settling speeds of such droplets, they may be viewed as precipitating. The higher-altitude (HA) clouds were either stratus or stra-tocumulus, whereas the low-level clouds were fog or stratus. Although still light, turbulence appeared to be the greatest in the 7 July stratocumulus. Cloud droplet sizes are represented by the VMD, which has the property that the VMD can be used with CDNC to calculate LWC.
The pre-cloud aerosol for the HA clouds is mostly de-rived from averages of values collected within about 50 m of cloud base when a cloud base was visible and achiev-able. In some cases, as discussed in Sects. 2.4.1 and 2.4.2, the pre-cloud aerosol concentrations include contributions from above cloud (19 July) or are from similar or lower altitudes in the clear air upwind of the cloud. For the aerosol measure-ments made with the 1 min averaged number concentrations from the SMS, values from further below cloud are necessary in some cases. These values are, however, consistent with the 1 s aerosol measurements closer to cloud base.
Every possible liquid cloud was sampled along a flight path, and some cloud layers were sampled more than once. That will bias the sample numbers to clouds of greater spatial extent. However, that bias is appropriate from a climate per-spective since cloud extent is a major factor for the impacts of clouds on climate. A total of 62 liquid water cloud sam-ples, or averages of individual cloud penetrations, were aver-aged with the constraint that the mean LWC is > 0.01 g m−3. The samples are integrations over periods ranging from 11 to 1000 s with a median sample time of 65 s that is equivalent to a horizontal path length of about 4 km.
0 0.1 0.2 0.3 LWC (g m-3); VMD (mm); Temperature (oC)
18:52-18:55 UT, July 7, 2014
LWC
VMD/100
ThetaE/100
Temp./10 (+0.7)
1950 2000 2050 2100 2150 2200 2250 2300 2350 2400
0 50 100 150 200 250 300
Altitu
d
e
(m
-msl)
Number concentrations (cm-3); CO (ppbv) 18:52-18:55 UT, July 7, 2014
CO CDNC N100 CCN N50-100 N5 N30-100 N20-100
0 0.1 0.2 0.3
LWC (g m-3);VMD (mm) Temperature (oC) 18:20-18:29 UT on July 17, 2014
LWC ThetaE/100
Temp./10 VMD/100
300 400 500 600 700 800
0 20 40 60 80 100
Altitu
d
e
(m
-msl)
Number concentration (cm-3); CO (ppbv) 18:20-18:29 UT on July 17, 2014
N50-100
N100
CCN
CDNC
CO
0 0.1 0.2 0.3 0.4 0.5
LWC (g m-3); VMD (mm); Temperature (oC) 18:45-18:52 UT on July 19, 2014
LWC
Temp./10
Theta E/100
VMD/100
700 800 900 1000 1100 1200 1300 1400 1500 1600
0 100 200 300 400
Altitu
d
e
(m
-msl)
Number concentation (cm-3); CO (ppbv) 18:45-18:52 UT on July 19, 2014
N5
N50-100
N100
CDNC
CO
CCN
0 0.1 0.2 0.3 0.4 0.5 0.6 0.7 LWC (g m-3); VMD (mm); Temperature (oC) 15:19-15:35 UT on July 20, 2014
LWC Temp./10 ThetaE/100 VMD/100
0 200 400 600 800 1000 1200 1400
0 20 40 60 80 100 120
Altitu
d
e
(m
-msl)
Number concentration (cm-3); CO (ppbv) 15:19-15:35 UT on July 20, 2014
CDNC (STP) N100 CCN N50-100 CO
Figure 3.Four examples of profiles through higher-altitude clouds.(a)Case from 7 July showing CO, CDNC, CCNC (0.6 %) and particle number concentrations, where Nx-100, N100 and N5 are for particles sized between “x” and 100 nm, > 100 and > 5 nm, respectively.(b)Case from 7 July showing LWC, VMD,θeand temperature, where VMD,θeand temperature have been scaled as indicated in the legend.(c)As in(a)but for the case from 17 July and without N5.(d)As in(b)but for the case from 17 July.(e)As in(a)but for the case from 19 July. (f)As in(b)but for the case from 19 July.(g)As in(a)but for the case from 20 July and without N5.(h)as in(b)for the but case from 20 July. The CDNC are all referenced to standard atmospheric pressure and temperature (STP), andθeis given in degrees Centigrade before scaling.
Christensen, 1984). The in-cloud aerosol measurements are not part of the subsequent analysis.
2.4.1 Higher-altitude cloud examples
Four examples of profiles through HA clouds are shown in Fig. 3. There are two panels for each profile: the left-hand panel shows CO, CDNC and particle number concen-trations (N5, Nx-100, N100, CCNC (0.6 %)); the right-hand panel shows temperature, equivalent potential temperature (θe), LWC and VMD. The temperatures, θe and VMD are
scaled as indicated.
7 July case (Fig. 3a, b)
One of several similar profiles through a stratocumulus layer during the transits to and from the polynyas north of Res-olute Bay. The CDNC (at STP) are relatively constant with altitude while LWC and VMD both increase steadily with altitude. These features characterize cloud formation by lift-ing of air, and they indicate that the cloud droplets were nu-cleated on particles from below cloud base. The cloud top is relatively sharply capped by a temperature inversion of about 2◦C at 2350 m, and the particle profiles along with
θe and CO are relatively constant below cloud base. There
the number concentrations of larger particles (N100) is re-duced due to nucleation scavenging, although such particles are not completely eliminated as smaller droplets can en-ter the inlet and dry in the sampling lines. Smaller particles can be artificially increased in cloud due to the shattering of larger droplets on the aerosol intake (e.g. Hudson, 1993), as indicated by the increase in the corresponding N5 higher in cloud. Thus, in-cloud aerosol measurements are shown here only for completeness, but they are not used in the subse-quent analysis. CDNC range up to 265 cm−3 and the mean value is 199 cm−3. Below cloud base, the N5, N20-100, N30-100, N50-N30-100, N100 and CCNC (0.6 %) are approximately 235, 167, 145, 94, 67 and 117 cm−3, respectively. The below-cloud N20 of 234 cm−3 approximately equals the N5, of-fering confidence in terms of number concentration closure. The N30 (N30-100+N100) compares most closely with the
mean CDNC, leading to the conclusion that on average cloud droplets nucleated on particles down to about 30 nm. Based on the maximum CDNC, it is possible that particles as small as 20 nm contributed to the CDNC in this cloud; for 20 nm particles of ammonium sulfate to activate, Köhler equilib-rium theory indicates that Sin the cloud bases would have
had to reach above 1.5 %.
17 July case (Fig. 3c, d)
The maximum and mean CDNC (STP) of about 75 and 55 cm−3, respectively, are lower while the VMD peak of 20 µm is higher compared with the 7 July profile. The LWC are generally similar between 7 and 17 July except that there are more breaks in the 17 July profile. Many of those breaks are due to the aircraft passing through the edges of cloud during this profile. The inversion topping the cloud is weaker and the LWC peak occurs further from cloud top in the 17 July case than the 7 July case. That LWC feature in com-bination with the general CO increase, beginning at about 660 m, suggests that the erosion of cloud top by entrainment went deeper into the 17 July cloud. Above 660 m, the CDNC also decrease, suggesting the higher concentrations of N50-100, N100 and CCN above cloud relative to below cloud did not enhance the CDNC. Continuity from at least 100 m be-low cloud base is indicated by the CO andθeprofiles, and the
N50 approximates the mean CDNC and possibly maximum CDNC. The CCNC (0.6 %) are 30–40 cm−3below cloud, in-dicating aShigher than 0.6 %. The comparison between the
7 and 17 July cases is a specific example of the potential im-portance of smaller particles for the cloud albedo effect.
19 July case (Fig. 3e, f)
The July 19 profile includes two cloud layers, one from 1200 to 1400 m and a second from 1400 to 1500 m. The layer sep-aration appears in the CO concentrations, which are approx-imately uniform through the lower layer and increasing in the upper layer. The CO levels of 100+ppbv in this case
are among the highest observed during this study. Transport patterns suggest that BB contributed to this aerosol (Köll-ner et al., 2015). The mean CDNC (STP) in the lower and upper layers are 239 and 276 cm−3, respectively. The VMD
reached 15 µm in the lower layer. The VMDs are overall smaller and decrease with altitude in the upper layer, corre-sponding to the lower LWC and higher CDNC. In the upper layer, the CDNC increase from cloud bottom to near cloud top consistent with the increase in aerosol from below the layer to above the layer. The N50 and N100 estimated for the lower (upper) layer are 269 (334) and 197 (221) cm−3, re-spectively, where the upper layer values are an average of the aerosol at 1400 m and just above cloud top. Thus, on average the CDNC in both layers are approximated by activation of particles sized between 50 and 100 nm, and the maximum CDNC are approximated by activation of 50 nm particles. The CCNC (0.6 %) are slightly below the N100, which would be consistent with the lower hygroscopicity of BB particles. Comparison of below-cloud CCNC (0.6 %) with CDNC sug-gests cloudSabove 0.6 %.
20 July case (Fig. 3g and h)
This is a more complex cloud with substantial LWC vari-ations that suggest three cloud layers. The values of mean CDNC at STP are 45, 49 and 65 cm−3in the upper, middle and lower layers, respectively. The VMDs reach about 20 µm in the lower layer and 26 µm in the upper layer with the lower CDNC. These layers are relatively stable with CO andθe
in-creasing slightly from below the cloud to above the top cloud layer. N50 just below the lower layer approximately equals CDNC in that layer. It is more difficult to estimate the pre-cloud aerosol for the middle and upper layers, but particles at least as small as 50 nm were apparently activated. For the summary statistics, the respective pre-cloud N100, N50 and CCNC (0.6 %) are estimated at 24, 44 and 24 cm−3 for the
upper cloud layer, 32, 52 and 32 cm−3 for the middle layer
and 34, and 66 and 35 cm−3for the lower layer. Comparison
of the CCNC (0.6 %), which are in approximately the same concentration as the N100, and CDNC suggestsSnear or in
excess of 0.6 %.
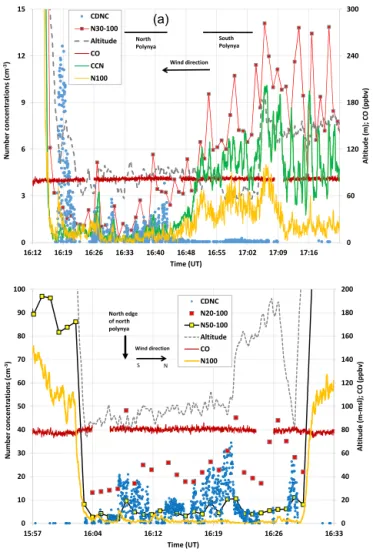
2.4.2 Low-altitude examples 5 and 7 July cases
0 60 120 180 240 300 0 3 6 9 12 15
16:12 16:19 16:26 16:33 16:40 16:48 16:55 17:02 17:09 17:16
A lt it u d e ( m ); C O ( p p b v ) N u m b e r con ce n tr a ti on s (c m -3) Time (UT) CDNC N30-100 Altitude CO CCN N100 North Polynya South Polynya Wind direction 0 20 40 60 80 100 120 140 160 180 200 0 10 20 30 40 50 60 70 80 90 100
15:57 16:04 16:12 16:19 16:26 16:33
A lt it u d e ( m -m sl ); C O ( p p b v ) N u m b e r con ce n tr a ti on s (c m -3) Time (UT) CDNC N20-100 N50-100 Altitude CO N100 Wind direction North edge of north polynya S N
Figure 4. Time series during the sampling of low-altitude (LA) cloud or fog over the polynyas north of Resolute Bay.(a)5 July time series showing CO, CDNC, CCNC (0.6 %) and particle num-ber concentrations, where N30-100 is for particles sized between 30 and 100 nm and N100 is for particles sized > 100 nm.(b)7 July time series showing CO, CDNC and particle number concentra-tions, where N20-100, N50-100 and N100 are for particles sized between 20 and 100 nm, between 50 and 100 and > 100 nm, respec-tively. CCNC (0.6 %) measurements are unavailable for this period on 7 July. Wind direction and relative position of polynyas are indi-cated in both panels. CDNC are referenced to STP.
the N100 and S less than 0.6 %. The maximum CDNC of
12 cm−3at 130 m suggests the activation of smaller particles, possibly as small as 30 nm, andS exceeding 0.6 % perhaps
due to some uplift influenced by orographic features north of the north polynya. At 88 m, the mean VMD (not shown) was 29 µm and ranged up to 35 µm giving those droplets po-tential to deposit over an hour or more, thereby popo-tentially transferring water from the polynya to the downwind ice. On 7 July, cloud or fog was present below 120 m and thicker to-wards the north edge of the north polynya and again to the north over the ice. Seven samples were identified over the period 16:06–16:29 based on the LWC above 0.01 g m−3.
Figure 5.Time series of altitude, CO, N80-100, N90-100, N100, CCNC (0.6 %) and CDNC from low-altitude (LA) cloud sampling over Lancaster Sound on 8 July. The cloud was deeper over the open water of the Sound (see satellite picture in Fig. 2b). Over the ice to the west, the cloud was not as deep and could not be sampled. Segments over water and ice are indicated at the top of the figure.
The CDNC are overall higher than on 5 July with sample averages ranging from 4 to 13 cm−3; the 1 s CDNC are as
high as 34 cm−3 and the mean VMDs (not shown) range
from 19.6 to 22.8 µm. The CO mixing ratio is slightly higher within the cloud (81 ppbv) than above (79 ppbv), although this difference may not be significant. In the air nearly free of cloud and below 120 m, the N100 is 4–5 cm−3, the N50 is 8– 11 cm−3and the N20 is variable between 17 and 130 cm−3; CCN are unavailable for this part of the flight. Mean values of CDNC/N100 and CDNC/N50 for seven cloud samples are 4.8 and 1.0, respectively, indicating that on average particles of about 50 nm were activated in this LA cloud. Based on the overall relationship between CCNC (0.6 %) and N50, which is discussed in Sect. 3.3, the meanS in the LA cloud of 7
July is estimated at 0.6 %. Comparison with the maximum CDNC suggests that particles as small as 20 nm may have participated in the nucleation of droplets.
8 July case
0 100 200 300
Number conc. (cm-3); CO (ppbv)
CDNC N100 CO CCN
0 100 200 300
Number conc. (cm-3); CO (ppbv)
CDNC N100 CO CCN
0 100 200 300
Number conc. (cm-3); CO (ppbv)
CDNC N100 CO CCN
0 100 200 300
Number conc. (cm-3); CO (ppbv)
CDNC N100 CO CCN
0 10 20 30
VMD ( m)
1727–1729
1738–1739
0 0.2 0.4 0.6
LWC (g m-3)
1727–1729
1738–1739
100 150 200 250
275 277 279 281 283 285
A
lt
it
u
d
e
(
m
-m
sl
)
Theta E (K)
1727–1729
1738–1739
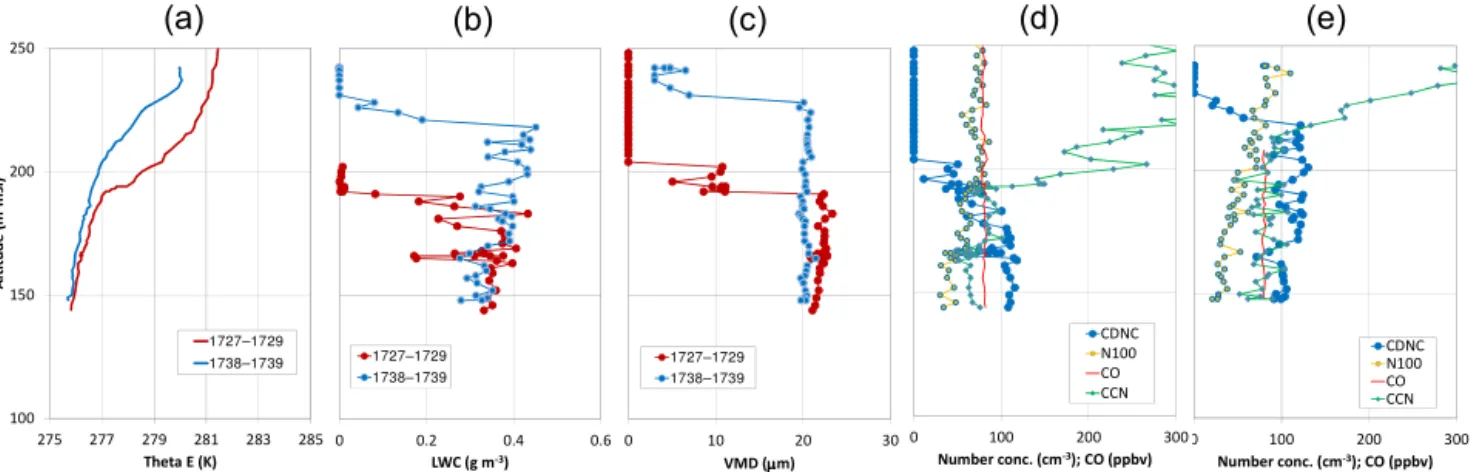
Figure 6.Profiles down into cloud showing(a)θe,(b)LWC and(c)VMD data for periods 17:27–17:29 and 17:38–17:39 UT on 8 July. (d)CDNC, N100, CO and CCNC (0.6 %) for the 17:27–17:29 UT profile.(e)CDNC, N100, CO and CCNC (0.6 %) for the 17:38–17:39 UT profile.
with tops below 150 m, as shown in Fig. 5 (time 17:47 UT). The thicker cloud was associated with a shift in wind direc-tion to more southerly suggesting an influence of the Prince Regent Inlet and surrounding terrain on the flow as well as possibly circulations influenced by the water–ice transition. The cloud layer was relatively stable and theθeprofiles
sug-gest a surface heat sink (Fig. 6a). Profiles of LWC and VMD in Fig. 6b and c do not show increases with altitude charac-teristic of vertical mixing, such as for some of the HA clouds (Fig. 3); the change in the VMD per 50 m increase in height is about 1.7 µm for the well-mixed cloud of 7 July (Fig. 3a, b), whereas it is about 0.2 µm per 50 m for the LA cloud of flight 8 in Fig. 6. The CO mixing ratio shows little varia-tion with time and altitude. The pre-cloud aerosol concen-trations are more difficult to assess. Based on concenconcen-trations just above the cloud, particles > 90 nm explain the CDNC. Based on concentrations downwind at 150 m (approximately 17:47 UT), activation of particles > 80 nm is needed to ex-plain the CDNC. The CCNC (0.6 %) are about 129 cm−3 downwind and between 157 and 234 cm−3just above cloud. It is concluded that in this case the droplets likely nucleated on particles mostly larger than 80–95 nm and the S in the
clouds was less than 0.6 %. For the purposes of summary statistics discussed next, the N100, N50 and CCNC (0.6 %) have been selected as an average of the downwind and imme-diately above-cloud concentrations: 73, 319 and 168 cm−3, respectively.
3 Summary observations and discussion
Summary statistics for the cloud and aerosol samples are discussed in Sect. 3.1, the microphysics of low-altitude and higher-altitude clouds are contrasted in Sect. 3.2, particle ac-tivation is summarized in Sect. 3.3 and in Sect. 3.4 the re-lationship between VMD and CDNC is used to consider the transition of aerosol indirect effects from potential warming
to potential cooling. All analyses are based on the 62 cloud samples discussed in Sect. 2.4. The LA cloud subset is com-prised of 24 samples and the HA cloud subset consists of 38 samples.
3.1 Summary of mean observations
The mean and median values of the microphysical proper-ties of the cloud and pre-cloud aerosols as well as the alti-tudes and temperatures derived from the 62 cloud samples are given in Table 1, separated between periods 1 and 2. Val-ues of the CDNC and the LWC are given relative to in situ volumes as well as STP. As discussed above, the pre-cloud CCNC (0.6 %), N50 and N100 are averages of those values collected within about 50 m of cloud base where a cloud base was clear and achievable. In other cases the pre-cloud CCNC (0.6 %), N50 and N100 are the values at the similar or lower altitudes in the clear air upwind of the cloud, except in the case of 8 July when the pre-cloud aerosol is based on the measurements in the area downwind plus those immediately above cloud. The CCNC (0.6 %) samples in Table 1 are lim-ited to 44 due to instrument problems, all of which occurred during the early part of 7 July.
Cloud liquid water paths (LWPs) are estimated for 36 of the samples when a complete profile between cloud base and cloud top was possible. The LWPs are shown at the bottom of Table 1. Of the 36 LWP estimates, 34 are above 200 m, and the mean and median altitudes are 1044 and 862 m, respec-tively. Not included in the summary statistics are the samples from 8 July shown in Figs. 5 and 6. For the minimum altitude reached in that cloud, the LWP ranged from 12 to 25 and thus the total LWP for that cloud exceeded 25.
dur-Table 2.Summary of averaged observations for low-altitude (LA) and higher-altitude (HA) clouds. Values without parentheses are referenced to ambient volumes and values in parentheses are referenced to STP. 5 and 95 are the 5th and 95th percentiles.
LA (< 200 m): HA (> 200 m): 24 samples; 0.89 h in cloud 38 samples; 0.72 h in cloud
Measurement Mean Median 5; 95 Mean Median 5; 95
Altitude (m m.s.l.) 129 127 79; 178 1485 1481 457; 2391 Temperature (◦C) +0.6 +0.2 −2.5; 2.9 −1.2 +0.9 −6.5; 2.7 CDNC (STP; cm−3) 31 (30) 11 (10) 1;106 (1; 102) 101 (118) 91 (101) 28;211 (31; 245) LWC (STP; g m−3) 0.10 (0.10) 0.05 (0.05) 0.01; 0.34 0.13 (0.15) 0.13 (0.15) 0.04; 0.25
(0.01; 0.33) (0.04; 0.30)
VMD (µm) 20.7 20.1 14.6; 31 13.4 12.5 9.1; 19.4
CCNC (0.6 %) (cm−3); 74 24 2; 184 90 58 21; 217
(16 LA; 28 HA)
N50 (cm−3) 91 11 4.2; 319 136 133 41; 334
N100 (cm−3) 26 4 1.3; 73 73 47 20; 232
CDNC (STP)/CCNC (0.6 %) 0.61 0.57 0.18; 1.3 1.2 1.2 0.6; 1.9
CDNC (STP/N50) 0.61 0.44 0.14; 1.5 0.91 0.93 0.5; 1.3
CDNC (STP)/N100 2.3 1.4 0.35; 9.0 2.1 1.9 0.7; 3.7
CCNC (0.6 %)/N50 0.66 0.71 0.52; 0.7 0.68 0.64 0.5; 0.9
CCNC (0.6 %)/N100 1.8 1.6 0.96; 2.6 1.5 1.1 0.8; 3.4
CO (ppbv) 81 80 78; 82 86 83 77; 107
0 20 40
VMD ( m)
LA samples (R^2=0.04) HA samples (R^2=0.26)
0 0.05 0.1 0.15 0.2 0.25 0.3 0.35
0 100 200 300
LW
C
(
g
m
-3)
CDNC (cm-3)
LA samples (R^2=0.57) HA samples (R^2=0.12)
Figure 7. The LWC plotted as a function of the CDNC(a)and VMD(b)for the LA (orange) and HA (blue) samples. Linear re-gressions for each of the LA and HA samples are also plotted, and the coefficients of determination are given in the legends.
ing period 1. The median CDNC are higher during period 1 than period 2, but the mean values are similar. The CDNC compare more closely with the N50 during period 1, while during period 2 the CDNC are about equally between the N50 and N100. The CCNC (0.6 %) equated with particles between 50 and 100 nm during period 1, whereas during pe-riod 2 they were closer to the N100 values. The reduction in particle hygroscopicity during period 2 may be due to an in-creased presence of organics in the aerosol during that time (Willis et al., 2016).
3.2 Comparison of LA and HA cloud
The LA clouds were close to the surface, and all were asso-ciated with open water; some or all may be technically fogs. They may be formed by advection of warmer moist air over a cooler surface (the 8 July LA cloud that moved from Baf-fin Bay westward along Lancaster Sound was likely domi-nated by that process), by radiation cooling or by the pas-sage of very cold air over a warm moist surface. The latter, also known as sea smoke, is the likely explanation for the clouds over the polynyas; also, it is possible that there was an advection component associated with the sea smoke mov-ing from the polynyas over the ice surfaces. In general, the LA clouds are associated with low-level horizontal advection and heat and water exchange with the underlying ice or wa-ter surface. In contrast, vertical motions are responsible for some of the HA clouds, and none of the HA clouds interact so closely with the underlying surface. Due to those differences, the characteristics of the LA and HA clouds are considered separately. Table 2 shows the mean and median values for the samples separated between LA and HA clouds; vertical profiles of CDNC, LWC and VMD samples are shown in Fig. S7. On average, the LA samples have lower CDNC and higher VMD compared with the HA cases, and the LA clouds are activating on larger particles relative to the HA clouds (e.g. CDNC/N50). The values of the CDNC/CCNC (0.6 %) indicate that theSis < 0.6 % for the LA clouds and close to
0.6 % for the HA clouds.
0 0.05 0.1 0.15 0.2 0.25 0.3 0.35 0.4
0 50 100 150
LW
C
(
g
m
-3)
CDNC (cm-3)
5 July LA (R^2=0.24)
7 July LA (R^2=0.69)
8 July LA (R^2=0.99)
17 July LA (R^2=0.58)
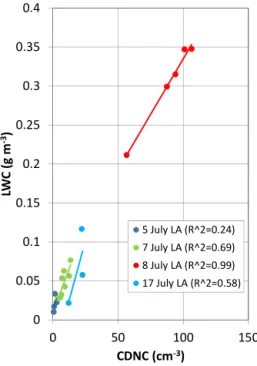
Figure 8.As in Fig. 7a, but identifying the specific LA cases of 5, 7, 8 and 17 July. Linear regressions for each set of samples are also plotted, and the coefficients of determination are given in the legends. The slopes are significant at a 95 % confidence level within
±30 % for 7 July and within 60 % for 8 July. The slopes in the 5 and
17 July cases are not significant at a 95 % confidence level.
(137, 0.032) is removed. In contrast, the correlation of the LWC with the CDNC for the HA samples is low (R2=0.12).
There is no correlation of the LWC with the VMD for the LA points (R2=0.04), and for the HA clouds there is a
modest correlation of LWC with MVD (R2=0.26).
Varia-tions in LWC with VMD within a cloud system are consis-tent with lifting of air from below, i.e. nucleation of droplets at cloud base followed by their growth with increasing al-titude, such as the case shown in Fig. 3a and b. Variations of LWC with VMD can also result from homogeneous mix-ing (i.e. entrainment of dry air that reduces LWC by par-tial evaporation of droplets without reducing CDNC). The strong dependence of the variations in LWC with those of the CDNC in the LA clouds may reflect changes in rate of cooling, collision–coalescence or inhomogeneous mixing along the cloud transport pathway. For example, increases in the rate of cooling within or between clouds will increase condensation rates, and potentiallyS, resulting in increased
LWC and CDNC. Changes in collision–coalescence will af-fect the CDNC and LWC in similar ways: more collision– coalescence, lower CDNC and lower LWC due to precip-itation. Inhomogeneous mixing, the entrainment of dry air parcels into a cloud without mixing with the cloud droplets, will reduce the CDNC averaged across the cloud and at the same time reduce the mean LWC. Changes in the aerosol that are interactive with some of the cloud processes may
con-tribute to the CDNC and potentially the LWC through their influence on collision–coalescence.
The LWC–CDNC correlation is identifiable for individ-ual flights with sufficient LA samples: four flights, compris-ing 20 of the 24 LA samples, had three or more points as shown in Fig. 8. The regressions for each of the 7, 8 and 17 July cases are approximately linear, and the respective mean VMDs are 20.8, 18.8 and 18.2 µm. The mean LWCs are 0.05, 0.3 and 0.07 g m−3. The VMDs are relatively close together confirming similarities in the relationships, even if not purely linear. For comparison, the mean VMD for the 5 July sam-ples is 29.2 µm and the LWC is 0.02 g m−3, which indicates that the 5 July case does not fit the linear relationship shown in Fig. 8. The reasons behind the similarity of the VMD for the 7, 8 and 17 July are unknown, but it occurs despite the varied pre-cloud N50 and N100: N50 ranges from 5 to 272 cm−3; N100 ranges from 1.1 to 73 cm−3. The consisten-cies among the three flights for greatly differing aerosol and CDNC imply a much smaller role for the aerosol in terms of the LWC. The distributions of droplets extend above 20 µm in these cases, but few are of sufficient size to initiate collision– coalescence (about 30 µm; e.g. Rosenfeld et al., 2001) un-less some fall out already had occurred. Greater temporal and spatial coverage is needed to assess the microphysical processes in these clouds.
3.3 Particle activation sizes
0 50 100 150 200 250 300 350
0 100 200 300 400 500
C
D
N
C
(
cm
-3)
N100 (cm-3)
LA samples
HA samples 1:1
0 50 100 150 200 250 300 350
0 100 200 300 400 500 600 700
C
D
N
C
(
cm
-3)
N50 (cm-3)
LA samples HA samples
1:1
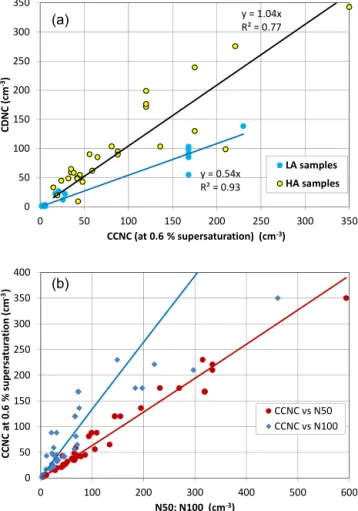
Figure 9.Plots of CDNC vs.(a)N100 and(b)N50. Points are iden-tified between LA (yellow) and HA (black asterisk) samples, and the 1:1 lines are for reference.
showing that the mean activation size of the HA clouds was often close to 50 nm. The median value of CDNC/N50 is 0.78 for all samples indicating that, based on the averaged CDNC, cloud droplets nucleated on particles near or smaller than 50 nm about 40 % of the time. That percentage will in-crease if particle activation is considered relative to the max-imum CDNC.
The mean and median values of the CCNC (0.6 %) as-sociated with all cloud samples (84 and 47 cm−3) are generally consistent with previous Arctic CCNC measure-ments. For example, during the summer above 85◦N, Mar-tin et al. (2011) measured a mean CCNC at 0.73 % S of
47 cm−3 with a standard deviation of 35 cm−3, Yum and Hudson (2001) measured CCNC at 0.8 % S below 1700 m
over the Beaufort Sea during May 1998 that ranged from 41 to 290 cm−3, and Radke et al. (1976) measured a mean
CCNC at 1 % S of 90 cm−3 in June near Barrow, Alaska.
Considering the median values of CDNC/CCNC (0.6 %) for the LA and HA samples (Table 2) and the slopes of linear re-gressions of CDNC vs. CCNC (0.6 %; Fig. 10a), the average
y = 0.54x R² = 0.93
y = 1.04x R² = 0.77
0 50 100 150 200 250 300 350
0 50 100 150 200 250 300 350
C
DN
C
(
cm
-3)
CCNC (at 0.6 % supersaturation) (cm )-3
LA samples
HA samples
0 50 100 150 200 250 300 350 400
0 100 200 300 400 500 600
C
C
N
C
a
t
0
.6
%
s
u
p
e
rs
a
tu
ra
ti
o
n
(
cm
)
-3
N50; N100 (cm-3)
CCNC vs N50 CCNC vs N100
Figure 10. (a)CDNC plotted vs. the CCNC measured at 0.6 % su-persaturation; points are identified between LA (yellow) and HA (blue) samples, and linear regressions through the origin are shown; the CCNC (0.6 %) points are limited to 44 of the 62 total due to problems with the CCN measurement; the 44 are split 16 and 28 between LA and HA.(b)CCNC (0.6 %; 44 points) plotted vs. N50 and N100; power-law fits to each are provided for reference.
inferredSfor the HA clouds is about 0.6 %, consistent with
the overall activation of smaller particles in those clouds. The meanSinferred for the LA clouds is significantly lower
than 0.6 %. Based on the activation of a 90 nm particle (8 July case; CCNC (0.6 %) of 168 cm−3 in Fig. 10a) of low-moderate hygroscopicity, a reasonable estimate is 0.3 % for the mean of the LA clouds with some higher values indicated by the points near a CCNC (0.6 %) of 25 cm−3in Fig. 10a. TheSfor these clean clouds is in contrast to polluted marine
environments for which estimates for these types of clouds are 0.2 % or less (e.g. Modini et al., 2015). Consistent with the present results, Hudson et al. (2010) found that effective
Sin marine stratus tended to increase with a decrease in the
CCNC, and for CCNC smaller than about 200 cm−3their ef-fectiveSranged between 0.3 and 1.2 %.
parti-cles as shown in Fig. 10b. The slopes of the power-law fits, for which the exponents are both close to unity, indicate that the CCNC (0.6 %) at 0.6 %Son average fall between 50 and
100 nm.
3.4 Aerosol influences on warming to cooling
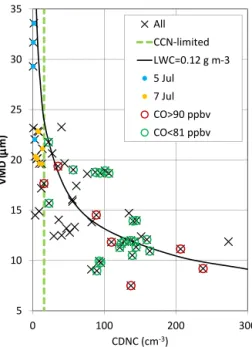
The relationship between the VMD and CDNC shown in Fig. 11 exhibits a scattered but clear tendency for smaller VMD with increasing CDNC. The solid black curve is a ref-erence line based on the study-mean LWC of 0.12 g m−3 (Ta-ble 1); points falling above or below the black curve have higher or lower LWC, respectively. The vertical dashed green line represents our best estimate of the Mauritsen limit below which Mauritsen et al. (2011) showed the cloud may produce a net warming for an increase in the CDNC. The net warm-ing is a consequence of an increase in long-wave absorption due to an increase in the LWC, where the latter results from a reduction in deposition for the smaller droplets associated with increased CDNC. A value of 16 cm−3is our best
esti-mate of the Mauritsen limit for this data set because all points with CDNC below that value fall well below the mean LWC, therefore offering greater potential for changes in the CDNC to increase the LWC. Above the estimated Mauritsen limit, an increase in CDNC may produce a net cooling due to the cloud albedo effect, since at that point the long-wave forcing does not change significantly as the effects of deposition are minimized and the cloud effectively behaves as a black body. The aerosol influence on clouds with CDNC below the Mauritsen limit is considered in Sect. 3.5 In Sect. 3.5, the potential background influence of the aerosol on clouds with CDNC above the Mauritsen limit is examined.
3.5 Below the Mauritsen limit
Seventeen of the 62 samples fall at or below our best estimate of the Mauritsen limit. Fifteen of those 17 samples are from LA clouds with median pre-cloud N50 and N100 estimates of 8.2 and 3.0 cm−3, respectively. The lower number concen-trations contribute to overall larger VMDs, although some of the points below the estimated Mauritsen limit have VMD values much less than 20 µm. Increases in small particles, potentially from particle nucleation or fragmentation (e.g. Leck and Bigg, 1999, 2010), are hypothesized to increase the CDNC, thereby enhancing long-wave warming by these clouds, at least until the CDNC exceed the estimated Mau-ritsen limit. The LA points from the 5 July and 7 July cases, identified in Fig. 11, offer one insight. The median CDNC for 5 July is 6 times lower than the 7 July CDNC: 1.3 and 7.8 cm−3for 5 and 7 July, respectively. The median N50 are
6 and 8.3 cm−3for 5 and 7 July, respectively, and the median
N100 is 3 and 2.2 cm−3 for 5 and 7 July, respectively. The CDNC are similar to N50 in the 7 July case, but lower than both the N50 and N100 in the 5 July case, indicating that the aerosol was not a limiting factor in the 5 July case.
Consis-5 10 15 20 25 30 35
0 100 200 300
V
M
D
(
m
)
CDNC (cm-3) All
CCN-limited
LWC=0.12 g m-3
5 Jul
7 Jul
CO>90 ppbv
CO<81 ppbv
Figure 11.The mean VMD of all cloud samples plotted vs. the CDNC. All CDNC are referenced to the ambient pressure. The dashed vertical green line represents the “CCN-limited” division discussed by Mauritsen et al. (2011) and estimated here as 16 cm−3.
The solid black line is another reference showing the relationship between VMD and CDNC for a constant LWC: the study mean LWC of 0.12 g m−3(Table 1). Samples with higher CO (> 90 ppbv) are identified by the open red circles, and samples with lower CO (<81 ppbv) are identified by open green circles. Also highlighted for the discussion are LA samples from 5 July (blue dots) and 7 July (orange dots).
tent with the discussion in Sect. 3.2, all 15 LA points show a correlation of LWC with the CDNC (R2=0.57), but
correla-tions of CDNC with N50 and N100 are weak:R2=0.19 and
0.06, respectively. The CCN are not used here because only seven points with CCNC (0.6 %) are available; the seven do, however, correlate well with the N50. If the limit of 10 cm−3 of Mauritsen et al. (2011) is applied, reducing the number of points to 12, the assessment does not change: the LWC– CDNC correlation improves slightly and the correlations of the CDNC with the N100 and the N50 weaken.
3.6 Background aerosol influence on clouds
Above the estimated Mauritsen limit, the general reduction in the VMD with the CCNC-associated (0.6 %) increase in CDNC reflects the impact of increases in aerosol on clouds. In Fig. 11, samples are identified between those associated with lower CO (green circles; < 81 ppbv, the median CO value of all samples) and those with highest CO (red circles; > 90 ppbv); six samples have no CO measurement and the remaining points have CO falling within 81–90 ppbv. Five of the seven higher-CO samples are from the 19 July case (e.g. Fig. 3e, f) that has been linked with BB (Köllner et al., 2015), and the highest CDNC point (273 cm−3; no CO measure-ment) is also from 19 July and likely influenced by BB. The higher-CO samples cover a range of CDNC from 16 cm−3
to at least 238 cm−3, with CO reaching up to 113 ppbv.
The higher-CO samples are associated with larger particles (N50/N100=1.5), consistent with a BB influence, compared
with the lower-CO samples (N50/N100=3.2). These values
for BB fall at the low end of the observations from Zamora et al. (2016), but their CO concentrations are much higher than those measured in this study. The lower-CO samples may be dominated by regional biogenic emissions (Willis et al., 2016). The lower- and higher-CO points overlap over a CDNC range of 16 to 160 cm−3, consistent with the range of pre-industrial CDNC from global models of 30 to 140 cm−3 (Penner et al., 2006; Korhonen et al., 2008). In this clean environment, the contributions from 20 to 100 nm particles have a broad impact on the range of CDNC, affirming the large uncertainty associated with estimating a baseline for the cloud albedo effect discussed by Carslaw et al. (2013).
4 Summary and conclusions
Aerosol particle size distributions, CCNC at 0.6 % waterS,
CO and cloud microphysics were measured from an airborne platform based out of Resolute Bay, Nunavut, from 4 to 21 July 2014 as one part of the Canadian NETCARE project. The flights were conducted over ice and water surfaces from about 60 m above the surface to about 6000 m. Sixty-two (62) cloud-averaged samples were derived, each constrained for the mean LWC > 0.01 g m−3or the cloud threshold used here. The analysis separates the cloud samples between 24 low-altitude (< 200 m) samples and 38 higher-low-altitude (> 200 m) samples as well as situations of lower and higher CO and observations above and below the Mauritsen et al. (2011) CCNC (or CDNC) limit.
The median pre-cloud N100 of 33 cm−3 and the median
CO mixing ratio of 81 ppbv indicate that the aerosols sup-porting the sampled clouds were relatively clean, and particu-larly during the first part of the study many of the aerosol par-ticles may have been derived from regional natural sources. The median CDNC at STP is 10 cm−3 for the LA clouds (24 samples) and 101 cm−3for the HA clouds (38 samples),
which correspond with the median pre-cloud N50 of 11 cm−3 for the LA samples and 133 cm−3for the HA samples. The lower sizes of particles activated in cloud varied from about 20 to above 100 nm. In 40 % of cases, the average lower size of activation was 50 nm or smaller. Overall, smaller particles were activated more often in the HA clouds. Variations in particle chemistry will induce some variance in these results; however, because activation diameters are estimated starting with larger particles and moving to smaller sizes, changes in chemistry only offer the possibility of activation of particles still smaller than estimated here, which would have to occur at the expense of larger particles.
From the median values of CDNC/CCNC (0.6 %; 1.2 for the HA clouds and 0.6 for the LA clouds) and the linear re-gression of CDNC and CCNC (0.6 %), it is inferred that the averageS was approximately 0.6 % for the HA clouds and
0.3 % for the LA clouds. Higher estimates will be obtained if the maximum CDNC are taken into consideration rather than the mean CDNC. The relatively highSfor these clean Arctic
stratus and stratocumulus has similarities with the observa-tions of Hudson et al. (2010) for relatively clean stratus off the coast of California.
In 17 cases, 15 of which are LA clouds, the CDNC fell at or below the CCN limit discussed by Mauritsen et al. (2011), which is estimated here as 16 cm−3. These are the first col-lection of simultaneous observations of the microphysics of aerosols and clouds in this unique regime in which the net radiative impact of increases in the CDNC is hypothesized to be warming due to changes in the LWC. The LWCs of the points below the Mauritsen limit all fall below the study-mean LWC, and the LWC increases with the CDNC. Neither the CDNC nor the LWC are positively correlated with the pre-cloud aerosol (N50 or N100). In this environment of low cloud or fog and ultra-low CDNC, variations in cloud pro-cesses such as mixing or the rate of cooling may be respon-sible for the correlation of CDNC and LWC. These observa-tions show no association of changes in either the CDNC or LWC with changes in the aerosol within the Mauritsen limit. Forty-five cloud samples with CDNC above the Maurit-sen limit exhibit a clear influence of changing aerosol. The cloud microphysics for the clouds formed in cleaner air (smaller particles and lower CO: < 81 ppbv) overlap with clouds formed in what was likely more polluted air (larger particles and higher CO: > 90 ppbv) covering a CDNC range of 16–160 cm−3. It is concluded that 20–100 nm particles from natural sources can have a broad impact on the range of CDNC in clean environments, affirming a large uncertainty in estimating a baseline for the cloud albedo effect.
5 Data availability
([email protected]). A table containing the details of the 62 samples discussed here is included with the Sup-plement.
The Supplement related to this article is available online at doi:10.5194/acp-16-11107-2016-supplement.
Acknowledgements. The authors acknowledge a large
num-ber of people for their contributions to this work. We thank Kenn Borek Air, in particular Kevin Elke and John Bayes, for their skillful piloting that facilitated these cloud observations. We are grateful to John Ford, David Heath and the U of Toronto machine shop, Jim Hodgson and Lake Central Air Services in Muskoka, Jim Watson (Scale Modelbuilders, Inc.), Julia Binder and Martin Gerhmann (AWI), Mike Harwood and Andrew Elford (EC) for their support of the integration of the instrumentation and aircraft. We thank Mohammed Wasey for his support of the instru-mentation during the integration and in the field. We are grateful to Carrie Taylor (EC), Bob Christensen (U of T), Kevin Riehl (Kenn Borek Air), Lukas Kandora, Manuel Sellmann and Jens Herrmann (AWI), Desiree Toom, Sangeeta Sharma, Dan Veber, Andrew Platt, Anne Mari Macdonald, Ralf Staebler and Maurice Watt (EC), Kathy Law and Jennie Thomas (LATMOS) for their support of the study. We thank the biogeochemistry department of MPIC for providing the CO instrument and Dieter Scharffe for his support during the preparation phase of the campaign. We thank the Nunavut Research Institute and the Nunavut Impact Review Board for licensing the study. Logistical support in Resolute Bay was provided by the Polar Continental Shelf Project (PCSP) of Natural Resources Canada under PCSP Field Project no. 218-14, and we are particularly grateful to Tim McCagherty and Jodi MacGregor of the PCSP. Funding for this work was provided by the Natural Sciences and Engineering Research Council of Canada through the NETCARE project of the Climate Change and Atmospheric Research Program, the Alfred Wegener Institute and Environment and Climate Change Canada.
Edited by: V.-M. Kerminen
Reviewed by: J. Hudson and two anonymous referees
References
Aliabadi, A. A., Staebler, R. M., Liu, M., and Herber, A.: Char-acterization and Parametrization of Reynolds Stress and Tur-bulent Heat Flux in the Stably-Stratified Lower Arctic Tropo-sphere Using Aircraft Measurements, Bound.-Lay. Meteorol., doi:10.1007/s10546-016-0164-7, 2016a.
Aliabadi, A. A., Thomas, J. L., Herber, A. B., Staebler, R. M., Leaitch, W. R., Schulz, H., Law, K. S., Marelle, L., Burkart, J., Willis, M. D., Bozem, H., Hoor, P. M., Köllner, F., Schneider, J., Levasseur, M., and Abbatt, J. P. D.: Ship emissions measure-ment in the Arctic by plume intercepts of the Canadian Coast Guard icebreaker Amundsen from the Polar 6 aircraft platform, Atmos. Chem. Phys., 16, 7899–7916, doi:10.5194/acp-16-7899-2016, 2016b.
Barrie, L. A.: Arctic air pollution: An overview of current knowledge, Atmos. Environ., 20, 643–663, doi:10.1016/0004-6981(86)90180-0, 1986.
Barrie, L. A., Bottenheim, J. W., Schnell, R. C., Crutzen, P. J., and Rasmussen, R. A.: Ozone depletion and photochemical reactions at polar sunrise in the lower Arctic atmosphere, Nature, 334, 138–141, 1988.
Brenner, T. C., Curry, J. A., and Pinto, J. O.: Radiative transfer in the summertime Arctic, J. Geophys. Res., 106, 15173–15183, 2001. Brock, C. A., Cozic, J., Bahreini, R., Froyd, K. D., Middlebrook, A. M., McComiskey, A., Brioude, J., Cooper, O. R., Stohl, A., Aikin, K. C., de Gouw, J. A., Fahey, D. W., Ferrare, R. A., Gao, R.-S., Gore, W., Holloway, J. S., Hübler, G., Jefferson, A., Lack, D. A., Lance, S., Moore, R. H., Murphy, D. M., Nenes, A., Novelli, P. C., Nowak, J. B., Ogren, J. A., Peischl, J., Pierce, R. B., Pilewskie, P., Quinn, P. K., Ryerson, T. B., Schmidt, K. S., Schwarz, J. P., Sodemann, H., Spackman, J. R., Stark, H., Thomson, D. S., Thornberry, T., Veres, P., Watts, L. A., Warneke, C., and Wollny, A. G.: Characteristics, sources, and transport of aerosols measured in spring 2008 during the aerosol, radiation, and cloud processes affecting Arctic Climate (ARCPAC) Project, Atmos. Chem. Phys., 11, 2423–2453, doi:10.5194/acp-11-2423-2011, 2011.
Browse, J., Carslaw, K. S., Mann, G. W., Birch, C. E., Arnold, S. R., and Leck, C.: The complex response of Arctic aerosol to sea-ice retreat, Atmos. Chem. Phys., 14, 7543–7557, doi:10.5194/acp-14-7543-2014, 2014.
Cai, Y., Montague, D. C., Mooiweer-Bryan, W., and Deshler, T.: Performance characteristics of the ultra-high sensitivity aerosol spectrometer for particles between 55 and 800 nm: Laboratory and field studies, J. Aerosol Sci., 39, 759–769, 2008.
Carslaw, K. S., Lee, L. A., Reddington, C. L., Pringle, K. J., Rap, A., Forster, P. M., Mann, G. W., Spracklen, D. V., Woodhouse, M. T., Regayre, L. A., and Pierce, J. R.: Large contribution of natural aerosols to uncertainty in indirect forcing, Nature, 503, 67–71, doi:10.1038/nature12674, 2013.
Christensen, J. H., Kanikicharla, K. K., Marshall, G., and Turner, J.: Chapter 14, in Climate Change, 2013, The Physical Basis, editted by: Stocker, T. F., Qin, D., Plattner, G.-K., Tignor, M. M. B., Allen, S. K., Boschung, J., Nauels, A., Xia, Y., Bex, V., and Midgley, P. M., Intergovernmental Panel on Climate Change, Cambridge University Press, Cambridge, UK, 1217–1308, 2013. Curry, J. A.: Introduction to special section: FIRE Arctic clouds
experiment, J. Geophys. Res., 106, 14985–14987, 2001. Earle, M. E., Liu, P. S. K., Strapp, J. W., Zelenyuk, A., Imre, D.,
McFarquhar, D. M., Shantz, N. C., and Leaitch, W. R.: Fac-tors influencing the microphysics and radiative properties of liquid-dominated Arctic clouds: Insight from observations of aerosol and clouds during ISDAC (2008), J. Geophys. Res., 116, D00T09, doi:10.1029/2011JD015887, 2011.
Engvall, A.-C., Krejci, R., Ström, J., Treffeisen, R., Scheele, R., Hermansen, O., and Paatero, J.: Changes in aerosol properties during spring-summer period in the Arctic troposphere, Atmos. Chem. Phys., 8, 445–462, doi:10.5194/acp-8-445-2008, 2008. Garrett, T. J., Zhao, C., Dong, X., Mace, G. G., and Hobbs, P. V.: