INSTALLED BASE REGISTRATION OF DECENTRALISED SOLAR PANELS
WITH APPLICATIONS IN CRISIS MANAGEMENT
Rosann Aarsen1, Milo Janssen1, Myron Ramkisoen1, Filip Biljecki2, Wilko Quak3, Edward Verbree3*
1 Delft University of Technology,
Faculty of Architecture and the Built Environment, MSc Geomatics
Julianalaan 134, 2628 BL, Delft, The Netherlands – {R.M.Aarsen; M.L.Janssen-1; M.G.W.Ramkisoen}@student.tudelft.nl 2 Delft University of Technology,
Faculty of Architecture and the Built Environment, Department of Urbanism, 3D Geoinformation Julianalaan 134, 2628 BL, Delft, The Netherlands – [email protected]
3 Delft University of Technology,
Faculty of Architecture and the Built Environment, OTB Research Institute for the Built Environment, GIS Technology Julianalaan 134, 2628 BL, Delft, The Netherlands – {C.W.Quak; E.Verbree}@tudelft.nl
Gi4DM and ISPRS, WG IV/7
KEY WORDS: Smart Grid, Crisis Management, Photovoltaic (PV) Panels, Registration, Linked Data
ABSTRACT:
In case of a calamity in the Netherlands - e.g. a dike breach - parts of the nationwide electric network can fall out. In these occasions it would be useful if decentralised energy sources of the Smart Grid would contribute to balance out the fluctuations of the energy network. Decentralised energy sources include: solar energy, wind energy, combined heat and power, and biogas. In this manner, parts of the built environment - e.g. hospitals - that are in need of a continuous power flow, could be secured of this power. When a calamity happens, information about the Smart Grid is necessary to control the crisis and to ensure a shared view on the energy networks for both the crisis managers and network operators. The current situation of publishing, storing and sharing data of solar energy has been shown a lack of reliability about the current number, physical location, and capacity of installed decentralised photovoltaic (PV) panels in the Netherlands. This study focuses on decentralised solar energy in the form of electricity via PV panels in the Netherlands and addresses this challenge by proposing a new, reliable and up-to-date database. The study reveals the requirements for a registration of the installed base of PV panels in the Netherlands. This new database should serve as a replenishment for the current national voluntary registration, called Production Installation Register of Energy Data Services Netherland (EDSN-PIR), of installed decentralised PV panel installations in the Smart Grid, and provide important information in case of a calamity.
* Corresponding author
1. INTRODUCTION
In case of a calamity in the Netherlands - e.g. a dike breach - a failure in the electricity network may occur. Both decentralised energy suppliers as the regular central energy suppliers are connected to the entire nationwide energy network. Current decentralised energy sources can be part of a Smart Grid; an advanced electrical grid that is controlled via information technologies to accurately regulate the energy demand and supply. Information about the Smart Grid is necessary to control the crisis caused by a calamity. Important buildings – such as hospitals - can be provided with energy via the Smart Grid if the location of decentral PV panels is known.
This study (performed for the course Synthesis Project, for the MSc Geomatics at TU Delft) is a subproject of the CERISE-SG
project (Dutch: Combineren van Energie- en Ruimtelijke Informatie Standaarden als Enabler – Smart Grids). Its goal is to: “create future proof and efficient information exchange between the energy sector, eGovernment and geo-world” (Cerise, 2015) to make crisis management more effective and efficient. This study will answer the following research question:
How to create a database which can be used to validate and improve the current registration of installed decentralised PV panels in the Smart Grid usable for an application in Crisis Management?
This study focuses on photovoltaic (PV) panels as a recent development of renewable decentralised energy sources, applied by private owners in the Netherlands, and the network operator Alliander. The contribution of this study is to create a database - which currently not exists in the Netherlands - to provide important information (e.g. locations of PV panels) in case of a calamity. This database can be used to validate and improve the current registration of installed decentralised PV panels in the Smart Grid, which is not up-to-date and not usable for an application in Crisis Management. Building this database covers a new methodology in locating and combining the necessary input data from multiple sources. Furthermore, the applications that may arise from the data in this database may evoke new perspectives and interest in the accurate knowledge about PV panel locations in the Netherlands.
In 2013 the distribution of produced solar energy was 0.4% in the Netherlands (CBS, 2015). Through the recent boom in PV industries and its global deployment the risk of PV panels (e.g. fire safety, correct instalment and electric circuits) will increase (Verhees, et al., 2013). These risks will be important for safety regions, crisis managers, network operators and energy suppliers. The only way to support such cases is to know exactly (10 cm accuracy) where PV panels are installed. The following paper includes eight sections. Section 2 presents related work. Section 3 describes the methodology of finding the required data. Section 4 provides an elaboration on our The International Archives of the Photogrammetry, Remote Sensing and Spatial Information Sciences, Volume XL-3/W3, 2015
newly defined database serving as replenishment for the current national voluntary registration. Section 5 provides a statistical analysis on the case study. Section 6 includes the application of our database in Crisis Management. Section 7 discusses the conclusions of this study and future work.
2. RELATED WORK
GIS has a longstanding underpinning in energy applications. For instance, in estimating the energy demand of households (Kaden and Kolbe, 2014; Strzalka et al., 2011), estimating the energy efficiency of buildings (Carrión et al., 2010), and in the consequent planning of their energy-efficient retrofit (Previtali et al., 2014). In solar energy applications, there are several approaches to estimate and map the PV energy potential (Biljecki et al., 2015; Catita et al., 2014; Hofierka and Zlocha, 2012). Such information is available through different atlases (Zonatlas, 2015; Zonnekaart, 2015). However, these studies are intended to aid in planning new energy installations, rather than to identify and/or to assess existing ones.
There is no reliable information available about the current number, physical location, and capacity of installed PV panels in the Netherlands. The same holds true for the other energy sources of the Smart Grid, like: wind turbines, biogas installations, and combined heat and power installations.
An innovative and complete way to connect, share and exchange data is via the Linked Data principle. Linked Data uses the Semantic web – where web content is incorporated into semantics via URI and RDF – to generate new links between data that has not been linked before.
Since the course of a crisis is often unpredictable, data requirements and the constellation of involved stakeholders might suddenly change. This might lead to an overload of the central crisis management system as it has to integrate constantly changing datasets (Zlatanova et al., 2014).
According to Ramona Roller (2015) Linked Data is supposed to improve Crisis Management because if all stakeholders base the data sharing on the same conceptual model (i.e. using the same terms for concepts and their relationships) then fewer interoperability problems will occur;
- Additional datasets can easily be added by generating new triples ;
- The data is available to all stakeholders ;
- Implicit relationships between data concepts can be made visible and in this way dependencies will become apparent.
According to Battle & Kolas (2011) Linked Data can aid in combining spatial data with other datasets, providing more content to users, helping solve cross knowledge domain issues and helping in aiding location based services. This method combines datasets more easily, and it is an innovative way for sharing information between different stakeholders and experts. In the future, when Link Data will become more common, this way of sharing information will be promising.
3. DATA RETRIEVAL FOR DATABASE CONTENT
In this section the methodology will be introduced of finding the required data regarding the location, maximum capacity at any time (kiloWattpiek (kWp)), and amount of power (kiloWatthour (kWh)) produced by installed decentralised PV
panels in the Netherlands. In general, three data sources were used, namely the:
1. Production Installation Register (PIR)
2. Website of klimaatmonitor on which solar energy data is published (Existence9)
3. Aerial imagery
These three data sources were used to analyse the reliability of the existing data sources (PIR and klimaatmonitor) versus the reliability of retrieving this data via aerial imagery.
3.1 Production Installation Register (PIR)
The current registration of installed decentralised PV panels is set in the Production Installation Register of Energy Data Services Nederland (EDSN-PIR). The PIR is a national registry where consumers can register (voluntarily) their sustainable decentralised production installation. The registration and cancellation of production installations by the customer (or the installation company on his behalf) can be done via a number of ways, such as via the Internet (Energieleveren, 2015). Approximately 28.000 installations are currently registered in the PIR. With the PIR network operators want to get an overview of the development of PV panels, wind turbines, combined heat and power, and other renewable installations in the Netherlands.
The following information will be registered of the production installations:
(1) address-data (street, house number, postcode, living area); (2) connecting-data (EAN code connection, net manager); (3) installation-data (building year, type of installation, power, date in use).
It was decided to keep the registration of the production installations for customers easily accessible. Thereon the number of input and controls is minimised. The PIR is online since about the year 2011. Therefore many old, mostly smaller installations will never be included in the PIR, because they could not be registered, since the PIR was non-existent.
The PIR data is not publicly available. Only network operators and energy suppliers have full access to the PIR database. Furthermore, the consumer registration of the PIR is voluntarily and not obliged by any law. Hence, the PIR can be regarded as an incomplete database, because many active installations might not be registered in the PIR.
3.2 Solar energy data on the website of klimaatmonitor
(Existence9)
A part of the (anonymised) PIR data can be found in databases on the web (klimaatmonitor, 2015). This data comprises on one hand sections of PIR data, on the other hand data of the PIR supplemented with nine other sources (e.g. Novem-projects). The fact that the klimaatbank is using other sources to rectify the amount of PV panels of the PIR emphasize that it is known that the PIR is not up-to-date and reliable.
3.3 Aerial imagery
The aerial images were obtained via the company Aerodata International Surveys. We have investigated whether aerial imagery can be used to detect PV panels by their specific physical appearance. Images with an accuracy of 10 cm can be The International Archives of the Photogrammetry, Remote Sensing and Spatial Information Sciences, Volume XL-3/W3, 2015
processed by a detection algorithm, based on Template Matching, which outputs a geometry point in the centroid of a PV panel. Therefore, specific PV panel locations with XY coordinates can be made available.
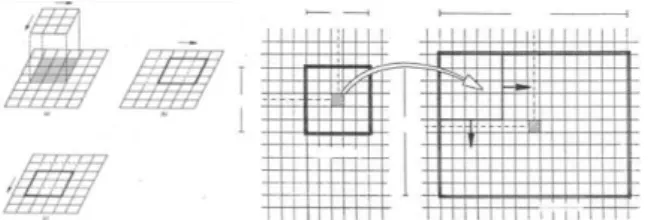
The main principle of Template Matching is that a template of pixels – e.g. a square of 3 by 3 pixels, also called kernel, filter, operator or convolution matrix – with certain intensity values, ‘moves’ over the entire original aerial image while multiplying the pixel intensity values of the template, with the pixel values of the original image. This multiplying, ‘moving’ template results in a new raster file, with new intensity values (Figure 1). In general, the pixel in this new raster that appears to fit the initial template values the best– depending on which kind of template is used – will portray maximum intensity values. One can state that on this specific location with maximum values, a certain feature is detected, namely the feature that represent the moving template.
This detection methodology is applied on the case study in this paper and is developed by Karto (2015). In this algorithm, a digital image is seen as raster data: each cell of the raster (pixel) represents simply a value (RGB light intensity). Furthermore, the algorithm is based on a combination of aerial imagery and multiple other data sources. The detection is done via object recognition techniques and further enhanced using multiple templates. Note: several sources of error can be explicated regarding the working principle of such an algorithm. A part of the detected markers of PV panels in our test case (district Stevenshof in the municipality Leiden, in the Netherlands) were obtained via the detection algorithm developed by Karto.
Figure 1: Principle of a moving image kernel (Lemmens, 2011)
4. DATABASE FOR INFORMATION PROVISION
This section provides an elaboration on our newly defined database, called Peer+. Before making a database (to store the data) it is necessary to create an UML diagram, to see the interrelations between all tables of the database. When the UML diagram is completed it is possible to convert this diagram to a SQL script for creating a database. First it is necessary to create a DDL schema. This DDL schema can be converted into a SQL script. For this research six tables were made (Figure 2):
Table 1: Peer+
Table 2: BAGIntermediate Table 3: Aerial
Table 4: PIR
Table 5: NeighborhoodBoundaries Table 6: Existence9
Figure 2: Database with six classes
These six tables form the database for information provision, where the location is stored of the decentralised solar panels. This Peer+ table contains combined information of the data sources (PIR, klimaatbank and aerial imagery), the neighbourhood boundaries (for clustering the location of PV panels to neighbourhood-, city-, province-, or national level) and BAGintermediate table for assigning the location of the PV panels – obtained by aerial imagery - to a neighbourhood.
In the Peer+ table, all information of PV panels in our test case is combined. Within this table the total amount of PV panels, households, capacity and power is shown. This data is retrieved automatically from the tables BAGIntermediate, Aerial, PIR, NeighborhoodBoundaries and Existence9 via a SQL script in pgAdmin (PostgreSQL/PostGIS). The Peer+ table also shows statistical information regarding the difference of what is not in the PIR and Existence9 tables, and what is stated in the Aerial table: e.g. the PIR table, the current national registration of PV panels can be compared with the Peer+ table to show the reliability of the PIR. This Peer+ table can be made publicly accessible and gives an up-to-date overview of all decentralised installed PV panels per neighbourhood in our test case. The Peer+ table will be published as open data at neighbourhood level, because it is privacy sensitive to publish the coordinates of every PV panel.
When the Peer+ table is filled with data from the other tables, it can be used to query this data. For example the slopes and azimuth degrees with the amount of PV panels can be queried. By having a central, reliable Peer+ database, where the accurate location of PV panels is stored in coordinates, more linking possibilities regarding other applications and stakeholders can be made. The Peer+ makes the PV panel registration data more usable.
5. STATISTICAL ANALYSIS OF THE ACQUIRED DATA
A statistical analysis is performed on the case study to compare the reliability of the existing data sources (PIR and
klimaatbank) versus data retrieved with aerial imagery. In order to make it possible to compare the PIR table with the Existence9 table (consisting of a part of the (anonymised) PIR data) and the Aerial table, units have to be transformed. The given data from the PIR and Existence9 consist of ‘Known addresses with PV panels’, while the data obtained via aerial imagery consist of the ‘Amount of PV panels’. A conversion of ‘Amount of households’ into ‘Amount of PV panels’ and vice versa had to be performed.
From this analysis can be concluded that one of the four neighbourhoods in our test case (Kloosterhof, Dobbewijk-North, Dobbewijk-South and Schenkwijk) had the most installed PV panels (in 2014), namely Dobbewijk-South. That is why most of the power (kWh) and the highest capacity at any time (kWp) are generated in the neighbourhood Dobbewijk-South. By using the image processing method more households with PV panels are detected in comparison to the PIR (17 more addresses were found in our test case (on a total of 74)) and
klimaatbank (2 more addresses were found in our test case (on a total of 74)). The image processing method did not detect 2 addresses from the klimaatbank, but did detect all the addresses of the PIR. This shows that creating a database with the location of decentralised PV panels with aerial imagery is more accurate than the current existing sources.
By using aerial imagery of different years, the total amount of PV panels can be compared and an increase or decrease can be detected. In our test case in total 207 PV panels were detected in 2012, 422 PV panels in 2013, and 984 PV panels in 2014.
6. APPLICATION IN CRISIS MANAGEMENT
The Peer+ database is built for certain applications. A lot of parties could be interested in the exact location of PV panels, for example market- and taxation researchers. Market researchers are interested in the amount of PV panels on the roofs. The Peer+ database can help resellers and solar panel distributors to discover the solar potential of buildings. For insurance companies it would be an asset to know where PV panels are installed with the production amount, because the presence of installed PV panels may increase the risk of a fire hazard. This research focuses on one specific field of applications in crisis management: offensive indoor efforts of the fire brigade.
According to Backstrom & Dini (2011) firefighters are vulnerable to electrical and casualty hazards when mitigating a fire encompassing PV systems. In general, the fire brigade eliminates the energy power before entering the building, assuming that there are no PV panels present. PV panels deliver direct current (DC) voltage which is of a larger risk than alternating current (AC) voltage. DC voltage distributes voltage throughout the entire wiring of a building, which may become a threat. Also, when a calamity or fire has to be tackled during the evening or night time, the Fire Brigade uses bright spotlights which may influence the energy production of a PV panel installation. Even if the energy supply in a building is shut down by fire fighters, the presence of PV panels may still distribute voltage. To conclude, buildings equipped with solar power systems may introduce unfamiliar hazards that require new firefighting strategies and procedures (Grant, 2013). However, there is not much knowledge and data available to understand the risks for developing safety solutions in order to respond in a safe manner when dealing with installed PV panels on a building in case of a calamity. For more risks of the presence of PV panels during mitigating a fire one is referred to Backstrom & Dini (2011).
Fire Services the Netherlands (Dutch: Brandweer Nederland) has set some regulations in the form of an attention-infosheet (Dutch: aandachtskaart) used by firefighters in repressive situations dealing with electricity. Basically PV panels are regarded as a low-voltage system which does not obstruct the execution of their duties, albeit the regular safety measures should be taken into account. However PV panels are a risk as such, as they might obstruct access when a firefighter has to walk on the roof of the (neighbouring) premise for mitigating a fire, because they may become hot, and they may drop down from the roof. In short, the risk for firefighters caused by installed PV panels on a building is present, but the recognition of this matter is still an open issue.
7. CONCLUSIONS AND FUTURE WORK
It can be concluded that the main problem in having a reliable and up-to-date database is the cooperation between different stakeholders. A lot of data regarding PV panel registration is available, but this data is either not shared with other parties, or it is not recorded properly (for exchange and linking). In this manner, it is evident to combine multiple existing sources of data with new/other resources to get reliable data. This research
has shown that it is more accurate to retrieve the location of decentralised PV panels with aerial imagery. A notion to be aware of is the possible privacy violation, when publishing the found PV panel registration data of the concerned test area as open data, on premises level.
One of the insights which were gained during this study regarding PV panels in the Netherlands is that it is very important to set up an up-to-date and reliable database of PV panels with help of aerial imagery. During the survey in our test case it was noticed that there is a need for an algorithm (or an enhancement of the detection algorithm of Karto) which can detect for instance thin film PV panels. These Thin film PV panels are currently an error source in the detection algorithm and are hard to detect through aerial imagery. The algorithm of Karto that was adopted for this project focuses solely on standard PV panels with a frame.
By having a central, reliable Peer+ database - where the accurate location of PV panels retrieved by aerial imagery is stored in coordinates - more linking possibilities regarding other applications and stakeholders can be made. The Peer+ enables data usage of the registration of PV panels and makes various new statistical analyses possible, e.g. power estimation by PV panels aggregated on neighbourhood level. Future applications based on the Peer+ database can provide useful and up-to-date insights regarding Crisis Management.
ACKNOWLEDGEMENTS
This work is part of the CERISE Topsector Switch2SmartGrids research program (www.cerise-project.nl), which is a program that has the aim to create future proof and efficient information exchange between the energy sector, eGovernment and geo- world. The authors would like to thank in particular: Sven Briels (Karto), Leen van Doorn (Alliander), Peter Segaar (PolderPV), and Robert Voûte (CGI) for their support.
REFERENCES
Backstrom, R., & Dini, D. A., 2011. Firefighter Safety and Photovoltaic Installations Research Project, Underwriters Laboratories Inc.
Battle, R., & Kolas, D., 2011. Geosparql: enabling a geospatial semantic web. Semantic Web Journal, 3(4), 355-370.
Biljecki, F., Heuvelink, G. B. M., Ledoux, H., & Stoter, J., 2015. Propagation of positional error in 3D GIS to the estimation of the solar irradiation of building roofs.
International Journal of Geographical Information Science, in submission.
Carrión, D., Lorenz, A., & Kolbe, T. H., 2010. Estimation of the energetic rehabilitation state of buildings for the city of Berlin using a 3D city model represented in CityGML. ISPRS Archives of the Photogrammetry, Remote Sensing and Spatial Information Sciences. Proceedings of the ISPRS 5th 3D GeoInfo Conference, Berlin, Germany, Vol. XXXVIII-4/W15, 31-15.
Catita, C., Redweik, P., Pereira, J., & Brito, M. C., 2014. Extending solar potential analysis in buildings to vertical facades. Computers and Geosciences, 66, 1–12.
Cerise, 2015. www.cerise-project.nl, (accessed on June 29th, 2015).
CBS, 2015. Aandeel hernieuwbare energie stabiel. http://www.duurzaambedrijfsleven.nl/energie/2977/cbs-aandeel-hernieuwbare-energie-stabiel, (accessed on June 29th, 2015)
Energieleveren, 2015. www.energieleveren.nl (accessed on June 29th, 2015)
Grant, Casey C., 2013. Fire Fighter Safety and Emergency Response for Solar Power Systems. In The Fire Protection Research Foundation.Quincy, USA.
Hofierka, J., & Zlocha, M., 2012. A New 3-D Solar Radiation Model for 3-D City Models. Transactions in GIS, 16(5), 681– 690.
Kaden, R., & Kolbe, T. H., 2014. Simulation-Based Total Energy Demand Estimation of Buildings using Semantic 3D City Models. International Journal of 3-D Information Modeling, 3(2), 35–53.
Karto, 2015. www.burokarto.nl (accessed on June 29th, 2015)
Klimaatmonitor, 2015.
www.klimaatmonitor.databank.nl/report/bestanden.html, (accessed on June 29th, 2015).
Lemmens, M., 2011. Geo-information. Geotechnologies and the Environment. Delft, the Netherlands
PolderPV, www.polderpv.nl (accessed on June 29th, 2015)
Previtali, M., Barazzetti, L., Brumana, R., Cuca, B., Oreni, D., Roncoroni, F., & Scaioni, M., 2014. Automatic façade modelling using point cloud data for energy-efficient retrofitting. Applied Geomatics, 6(2), 95–113.
Roller, R, Roes, J, Verbree, E, 2015. Benefits of Linked Data for Interoperability during Crisis Management. Submitted to Gi4DM workshop at ISPRS GEOSPATIAL WEEK 2015.
Strzalka, A., Bogdahn, J., Coors, V., & Eicker, U., 2011. 3D City modeling for urban scale heating energy demand forecasting. HVAC&R Research, 17(4), 526–539.
Verhees, B., Raven, R., Veraart, F., Smith, A., & Kern, F. 2013. The development of solar PV in The Netherlands: A case of survival in unfriendly contexts. Renewable and Sustainable Energy Reviews, 19, 275-289.
Zlatanova, S. 2010. Formal modelling of processes and tasks to support use and search of geo-information in emergency response. 13th Annual International Conference and Exhibition on geospatial Information Technology and Applications,
Gurgaon, India, pp. 1-10.
Zonatlas, 2015, www.zonatlas.nl, (accessed on June 29th, 2015).
Zonnekaart, 2015, www.zonnekaart.nl, (accessed on June 29th, 2015).