Restriction fragment length polymorphisms of mitochondrial DNA among five
freshwater fish species of the genus
Astyanax
(Pisces, Characidae)
Cinthia Bachir Moysés and Lurdes F. de Almeida-Toledo
Departamento de Biologia, Instituto de Biociências, Universidade de São Paulo.
Abstract
Restriction fragment length polymorphism (RFLP) analysis of mitochondrial DNA (mtDNA) was employed to characterize species and populations ofAstyanax, a Neotropical freshwater fish genus. Samples of five species, A. altiparanae, A. fasciatus, A. lacustris, A. scabripinnis paranae and A. schubarti, from the Upper Paraná and São Francisco river basins were analyzed. Two out of the ten restriction enzymes employed generated species-specific mtDNA patterns for each of the five species. MtDNA exhibited considerable polymorphism within and among populations. All populations sampled showed relatively high values of haplotype diversity. Geographically localized haplotypes were detected forA. altiparanae and A. fasciatus from the Upper Paraná and São Francisco basins. The relationships between populations are discussed.
Key words:mtDNA, RFLP,Astyanax.
Received: April 15, 2002; accepted: September 24, 2002.
Introduction
The freshwater fish genusAstyanax(Pisces, Chara-ciformes) is widely distributed over the Neotropical region. It comprises more than one hundred nominal species and subspecies, many of which undescribed so far (Garutti and Britski, 1997). In view of the number of species, distribu-tion and taxonomy,Astyanaxhas been considered one of the most complex genera of characids in South America, (Zanata, 1995).
Five Astyanax species are commonly found in the Brazilian Upper Paraná and São Francisco river basins, pre-senting the following geographic distribution: Astyanax altiparanaeandA. schubartiare found in the Upper Paraná river basin; Astyanax fasciatus inhabits most of South-American rivers;A. lacustrisis restricted to the São Fran-cisco river basin, andA. scabripinnis paranaeis found in the headwaters of small rivers and streams of the Upper Paraná system (Britski, 1972; Garutti and Britski, 2000).
Previous cytogenetic studies ofAstyanaxrevealed a high karyotypic variability between and within species (Morelliet al., 1983; Daniel-Silva, 1996; Maistro et al., 2000). However, there is still very little information avail-able regarding the genetic diversity, population structure and evolutionary relationships among the species
com-prised by the genusAstyanax. Also, there is no evidence of monophyly for the genusAstyanax, believed to encompass different independent evolutionary lineages (Weitzman and Fink, 1983; Zanata, 1995; Weitzman and Malabarba, 1998).
Mitochondrial DNA (mtDNA) has proven to be a use-ful molecular marker for evolutionary studies in animal populations, because of its predominantly maternal inheri-tance, relatively rapid base substitution rate, lack of recom-bination, and easy isolation (Avise et al., 1987; Wolstenholme, 1992).
MtDNA provides efficient molecular markers for the study of population structure, geographic variation and spe-cies characterization (Agnèseet al., 1997; Graves, 1998). Hyneset al. (1989) detected diagnostic mtDNA restriction patterns which could be used as genetic markers for the dis-crimination of two different stocks of brown trout. RFLP analysis of mtDNA also proved to be effective in distin-guishing among three different species of catfish in the Arabian Gulf, two of which could hardly be differentiated based on morphological traits alone (Simseket al., 1990).
In the present study, we employed restriction frag-ment length polymorphism analysis of mitochondrial DNA to assess the genetic variability and to further characterize species and populations ofAstyanaxfrom the Upper Paraná and São Francisco river basins. This work represents a pio-neering effort to employ molecular markers on the popula-tion level in the genusAstyanax.
Send correspondence to CBM. Caixa Postal 11461, 05422-970 São Paulo, SP, Brazil. Phone: +55 11 3091-7554. Fax: +55 11 3091-7553. E-mail: cintilan@ib.usp.br.
Material and Methods
Samples from populations ofAstyanax altiparanae, A. fasciatus,A. lacustris,A. scabripinnis paranae andA. schubarti, from the Upper Paraná and São Francisco hydro-graphic basins, Brazil, were analyzed (Figure 1; Table I).
Total genomic DNA was extracted from liver tissue, using slight variations of the standard phenol:chloroform protocol (Sambrooket al., 1989), and digested with 10 re-striction endonucleases:BamHI,BclI,BglI,DraI,EcoRI,
EcoRV,HindIII,PvuII,ScaI andXbaI, all of which
recog-nized 6 nucleotide cutting sites. These enzymes were se-lected from a previous survey of 27 restriction enzymes, based on the number and sizes of the resulting fragments. Digestions were carried out as specified by the supplier (Gibco BRL).
Restriction fragments were separated by electropho-resis in 0.8% agarose gels, and transferred by Southern blot (Southern, 1975) onto a positively charged nylon mem-brane. Membranes were hybridized with a digoxigenin-labeled probe containing the total purified mitochondrial genome from Piaractus mesopotamicus (Pisces, Chara-ciformes) oocytes. Hybridization and detection procedures were performed according to the manufacturer’s protocols (DIG DNA Labeling and Detection Kit - Boehringer Mannheim). Molecular weights of the fragments were esti-mated by comparison to HindIII λ DNA digests (Gibco BRL). The average size of the mitochondrial genome was estimated by the sum of the restriction fragment sizes pro-duced by each enzyme.
To each different fragment pattern produced by a re-striction endonuclease a single capital letter was assigned in order of appearance. Thus, each composite mtDNA ha-plotype was designated by a 10-letter code. MtDNA restric-tion sites were inferred from restricrestric-tion fragment patterns, considering each enzyme separately. A presence/absence restriction site matrix was constructed for each composite haplotype.
Nucleotide (π; Nei and Tajima, 1981) and haplotype (h; Nei, 1987) diversity within populations, as well as nu-cleotide sequence divergence among pairs of haplotypes (δ; Nei and Li, 1979) and populations (δ; Nei, 1987), were esti-mated using the REAP software package (McElroyet al., 1992).
Results
The 10 enzymes used yielded three patterns forPvuII, four forBamHI andBglI, five forEcoRI, six forBclI, seven forEcoRV andHindIII, eight forScaI andXbaI, and eleven
Figure 1- Maps showing the collection sites of theAstyanaxspecimens. (a) Map of Brazil with hydrographic basins sampled. UPB = Upper Paraná basin; SFB = São Francisco basin. The insert is detailed in (b). (b) Sam-pling sites (sample designations are listed in Table I). São Francisco river (1); Mogi Guaçu river (2); Tiête river (3); Paranapanema river (4).
Table I- Sampling sites, sample sizes, and mtDNA haplotype and nucleotide diversity within populations ofAstyanax.
Species Sampling sites Sample
designation
Sample size (n)
Haplotype diversity (h)
Nucleotide diversity (π)
A. altiparanae Mogi Guaçu river (Pirassununga, SP) Pir 9 0.416 0.0009
Paranapanema river (Avaré, SP) Ava 10 0.711 0.0020
Tietê river (Penápolis, SP) Pen 11 0.472 0.0018
A. fasciatus Mogi Guaçu river (Pirassununga, SP) Pir 13 0.769 0.0023
Paranapanema river (Avaré, SP) Ava 10 0.733 0.0022
Tietê river (Penápolis, SP) Pen 5 0.900 0.0041
A. lacustris São Francisco river (Três Marias, MG) TM 6 0.733 0.0018
A. scabripinnis paranae Tietê river (Botucatu, SP) Bot 12 0.166 0.0011
for DraI (Table II). DraI and HindIII produced species-specific mtDNA fragment patterns in all five Astyanax
species studied (Figure 2). The mtDNA haplotype of each individual was derived from the combined restriction pat-terns of the 10 enzymes used in this survey.
The average size of the mitochondrial genome was estimated as being 16.0 kb forA. altiparanae, 16.4 kb forA.
fasciatus, 16.1 kb for A. lacustris, 16.4 kb for A. scabripinnis paranae, and 16.5 kb for A. schubarti. En-zymeDraI was disregarded in the size estimates, because it produced too many cuts in theAstyanaxmtDNA. The pres-ence of an unknown number of small fragments, which are difficult to detect, may account for the difference in size found among these species (Table II).
Table II- Estimated sizes (kb) of mtDNA restriction fragments in the fiveAstyanaxspecies analyzed.
Enzyme Restriction fragments Enzyme Restriction fragments
BamHI EcoRV
A/A’ 10.3, 2.5, 2.3/10.3, 2.8, 2.3 A 10.9, 4.2, 1.9
B 8.6, 7.4 B 10.2, 2.3, 2.1, 1.9
C 11.3, 5.2 C 14.6, 1.9
D 15.8 D 12.7, 3.8
BclI E 17.2
A 6.5, 5.5, 4.2, 0.5* F 6.0, 6.0, 4.5
B 6.9, 3.1, 2.6, 2.0, 1.5, 0.5* G 12.0, 4.5
C 4.5, 3.1, 2.6, 2.5, 2.0, 1.5, 0.5* HindIII
D 10.4, 3.1, 2.6, 0.5* A 7.9, 3.6, 1.7, 1.4, 0.7, 0.5, 0.2*
E 7.3, 3.1, 3.1, 2.6, 0.5* B 9.3, 3.6, 1.7, 0.7, 0.5, 0.2*
F 6.9, 3.1, 2.6, 2.5, 1.5 C 4.0, 3.6, 3.2, 1.7, 1.4, 0.7, 0.7*
BglI D 4.0, 3.6, 3.2, 1.7, 1.4, 1.1, 1.1*
A/A’ 13.7, 3.0/13.7, 3.5 E 9.4, 2.2, 1.8, 1.8, 0.7
B 8.9, 4.7, 2.4, 1.5 F 9.4, 4.3, 1.8, 0.7
C 11.4, 4.7, 1,5 G 8.2, 4.1, 1.8, 1.0, 0.7, 0.2*
D 9.7, 4.7, 1.7, 1.4, 0,1* PvuII
DraI A 5.8, 4.5, 4.5, 1.2
A 5.2, 2.7, 2.5, 1.7, 1.6, 1.1, 0.5* B 5.4, 4.5, 4.5, 1.2, 0.4*
B 5.2, 3.1, 2.7, 1.7, 1.6, 1.1 C 5.8, 4.5, 3.0, 1.5, 1.2
C 5.2, 2.6, 1.9, 1.8, 1.6, 1.1, 0.8*, 0.5* ScaI
D 7.2, 2.7, 2.0, 1.8, 1.1, 0.6*, 0.5* A 10.6, 3.9, 2.2
E 5.2, 2.7, 2.6, 1.5, 1.2, 1.2, 1.1 B 10.6, 3.0, 2.2, 0.9
F 5.2, 3.8, 2.7, 1.5, 1.2, 1.1 C 5.9, 4.2, 3.0, 2.2, 0.9
G 5.2, 2.7, 2.1, 1.5, 1.2, 1.2, 1.1, 0.5* D 14.5, 1.5, 0.8
H 5.2, 2.7, 2.6, 2.1, 1.5, 0.8, 0.4* E 10.6, 3.9, 1.5, 0.8
I 5.2, 2.7, 2.1, 1.6, 1.5, 1.1, 0.8, 0.4* F 10.1, 4.5, 1.4, 0.6
J 5.2, 3.8, 2.7, 1.5, 1.1, 0.8, 0.4* G 10.1, 4.5, 2.0
K 5.2, 3.8, 2.7, 2.7, 1.1 H 14.5, 2.0
EcoRI XbaI
A 11.9, 4.2 A/A’ 7.3, 4.3, 2.7, 1.0/7.3, 4.3, 3.2, 1.0
B 9.6, 4.2, 2.2 B 7.3, 2.7, 2.1, 1.8, 1.0, 0.6*
C 11.9, 2.8, 0.8, 0.6 C 7.3, 4.3, 3.8
D 7.1, 4.6, 2.8, 0.8, 0.6 D 7.3, 4.3, 2.0, 1.0, 0.6*
E 11.9, 3.3, 0.8 E 6.1, 5.7, 2.9, 1.1
F 5.7, 4.9, 4.3, 1.1
G 6.1, 5.7, 4.3
H 5.1, 4.3, 3.4, 1.8, 0.9
A mitochondrial DNA size variation of approxi-mately 400-500 bp, as revealed by the patterns of three re-striction enzymes,BamHI,BglI, andXbaI (patterns A and A’), was observed in specimens ofA. lacustriswhen com-pared to specimens ofA. altiparanae.
Nine different mtDNA haplotypes were detected inA. altiparanaepopulations (Figure 3). Eight out of the nine
haplotypes were population-specific. For a single haplo-type (at1) high frequencies were found in both Pirassu-nunga and Penápolis populations. Pairwise sequence divergence estimates (d) among these haplotypes ranged from 0.21% to 0.85% within populations, and from 0.42% to 1.33% among populations. Haplotype and nucleotide di-versities inA. altiparanaepopulations are presented in Ta-ble I; estimates of nucleotide divergence among populations (δ) are presented in Table III.
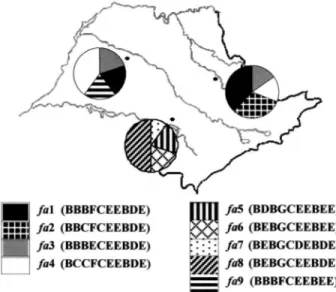
WithinA. fasciatuspopulations, nine different haplo-types were detected (Figure 4). Six (fa1,fa5,fa6,fa7,fa8,
fa9) out of the nine haplotypes were population-specific, and the remaining three haplotypes (fa2,fa3 andfa4) were shared by two sampling sites (Pirassununga and Penápolis). Pairwise sequence divergence estimates among these haplotypes ranged from 0.20% to 0.62% within tions, and from 0.42% to 1.71% among different popula-tions. Haplotype and nucleotide diversities inA. fasciatus
populations are presented in Table I, and the nucleotide di-vergence among populations is found in Table III.
A single population ofA. lacustriswas sampled in Três Marias, MG, São Francisco river basin. Pairwise se-quence divergence estimates among the three mtDNA haplotypes found in this population varied from 0.21% to 0.42% (Figure 3). Haplotype and nucleotide diversities are shown in Table I.
In the singleA. scabripinnis paranaepopulation ana-lyzed, two haplotypes (sca1 and sca2; d = 0.69%) were detected. In the A. schubarti population sampled in
Piras-Figure 2- Species-specific mtDNA fragment patterns produced by digestion with the restriction endonucleasesDraI (a) andHindIII (b).Astyanax altiparanae(at);A. lacustris(lc);A. fasciatus(fa);A. scabripinnis paranae(sca);A. schubarti(sh).λDNAHindIII was used as molecular size standard (M); *HindIII pattern found in the two specimens ofAstyanax fasciatusfrom Três Marias not included in the analysis (see Discussion).
Figure 3 - Geographical distribution of mtDNA haplotypes in A. altiparanae(at1-at9) andA. lacustris(lc1-lc3). Composite haplotypes are denoted by capital letters in the following order:BamHI,BclI,BglI,
DraI,EcoRI,EcoRV,HindIII,PvuII,ScaI, andXbaI. Haplotypes A and A’ differ from each other only in mtDNA length.
Table III- Estimates of nucleotide sequence divergence (δ) (%) among populations ofA. altiparanae(above the diagonal) andA. fasciatus(below the diagonal). Sample designations are as in Table I.
Population Pir Ava Pen
Pir - 0.6112 -0.0006
Ava 1.0026 - 0.6244
-sununga, eight mtDNA haplotypes were found (Figure 5). Di-vergence values among these haplotypes (sh1-sh8) ranged from 0.20% to 0.85%. Haplotype and nucleotide diversities forA. scabripinnisandA. schubartiare presented in Table I.
Discussion
The present data on the restriction fragment length of the mitochondrial DNA inAstyanax indicate that an
ex-pressive number of point mutations occurred in the mtDNA molecule during the evolutionary history of the five species inhabiting the two river basins here analyzed, many of them comprising populations living in sympatry. These muta-tions are reflected by the 31 haplotypes detected after di-gestion with 10 selected restriction enzymes. In fact, previous studies employing cytogenetic analysis in this group also showed differences in chromosome number and morphology, in both species and population (Morelliet al., 1983; Daniel-Silva and Almeida-Toledo, 2001).Astyanax schubarti presented 2n = 36 chromosomes; A. fasciatus
presented 2n = 46 chromosomes in populations from the Paraná basin, and 2n = 48 chromosomes in populations from the São Francisco basin (Morelliet al., 1983; Oliveira
et al., 1988; Daniel-Silva and Almeida-Toledo, 2001). Al-thoughA. altiparanaepresented a fixed number of 2n = 50 in all populations analyzed, the chromosome formula was sometimes quite distinct (Daniel-Silva, 1996). The A. scabripinnispopulations studied presented a high variabil-ity in chromosome number (2n = 46, 48 and 50) and for-mula (Moreira-Filho and Bertollo, 1991; Souzaet al., 1995; Daniel-Silva, 1996). Variable, usually species-specific, patterns of constitutive heterochromatin blocks were found in theseAstyanaxspecies. Thus, the C-banding pattern as-sociated with chromosome number and formula resulted in species-specific karyotypes for these four species (Daniel-Silva and Almeida-Toledo, 2001).
In the present study, digestion withDraI andHindIII allowed to detect species-specific mtDNA patterns for the five species of Astyanax under study. Furthermore, intraspecific variability was observed in all species herein analyzed.
InA. altiparanae, out of the nine haplotypes identi-fied, eight were population-specific, and only one was shared by two populations. Nine different haplotypes were also detected inA. fasciatus, six of them being private and three shared by two populations. Both inA. altiparanaeand
A. fasciatus, the most common haplotypes were found in samples from Pirassununga and Penápolis, both collected in the Upper Paraná basin. Moreover, in both species an ex-tremely lowδvalue between Pirassununga and Penápolis was observed. This result may suggest either a recent time of separation of these two populations, or the occurrence of gene flow between them. The fact thatAstyanaxspecies are capable of short-distance migrations (V. Garutti, pers. comm.), and that Pirassununga and Penápolis are con-nected by the Paraná river, although situated approximately 330 km apart, allows us to postulate the occurrence of gene flow via the stepping-stone model (Kimura, 1953). Accord-ing to Slatkin (1987), the exchange between populations of a few individuals per generation would be sufficient to pre-vent the accumulation of a significant genetic drift between geographically distant sites. However, in order to test the hypothesis of a “stepping-stone” gene flow occurring
Figure 4- Geographical distribution of mtDNA haplotypes inAstyanax fasciatus. Composite haplotypes are denoted by capital letters in the fol-lowing order:BamHI,BclI,BglI,DraI,EcoRI,EcoRV,HindIII,PvuII,
ScaI, andXbaI.
Figure 5- Geographical distribution of mtDNA haplotypes inAstyanax scabripinnis paranae(sca1-sca2) andA. schubarti(sh1-sh8). Composite haplotypes are denoted by capital letters in the following order:BamHI,
between Pirassununga and Penápolis, it would be necessary to sample individuals from intermediate populations.
On the other hand, the presence of non-shared haplo-types between samples from Avaré (Paranapanema river) and Pirassununga/Penápolis (Mogi Guaçu and Tietê rivers, respectively), both inA. altiparanaeandA. fasciatus, sug-gests the absence of gene flow and, consequently, a geo-graphical isolation of these populations.
Haplotype diversity was found to range between moderate and high values in all populations, with the ex-ception of theA. scabripinnis population from the Tietê river, which presented lowh values. Taking into account that A. scabripinnis is a headwater species composed of small populations which are most likely isolated from each other, the low haplotype diversity could be explained by a reduction of genetic variability due to genetic drift. More-over, the headwater habitats are more stable, therefore lead-ing to a more uniform genetic composition. As for the other species, the sporadic occurrence of low haplotype diversity in bothA. altiparanaeandA. schubarticould be due to the predominance of one particular haplotype in the sample. In fact, thehvalue indicates that, in spite of their diversity, the mtDNA haplotypes are not very divergent from each other.
The size of the mitochondrial genome estimated for the fiveAstyanaxspecies is in accordance with values pre-viously reported for other fish species (Billington and Hebert, 1991). When comparing the mtDNA genome sizes ofA. altiparanae, from the Upper Paraná river basin, andA. lacustris, from the São Francisco river basin, there seems to be a variation of about 500 bp, the genome of the latter be-ing the longer one. This profile is suggested by theBamHI,
BglI andXbaI restriction patterns. The digestions were re-peated, in order to prevent technical artifact. Differences in mtDNA length could be due to addition/deletion of se-quences of nucleotides or to duplications of tandem repeats in the control region of mtDNA. Size variations of 500 bp or less are typically found in the mtDNA control region, and are common in lower vertebrates (Berminghamet al., 1986; Moritzet al., 1987). They may also be due to the low detection sensitivity of the DIG kit. As it is based on a color reaction instead of a chemiluminescent or radioactive reac-tion, which are more sensitive, small fragments of 500 bp or less may go undetected with this protocol. To further inves-tigate this matter, the control region of both species will have to be sequenced.
The results reported here regarding the mitochondrial genome differences found in A. altiparanae and A. lacustrisare in agreement with morphological data. BothA. altiparanae (Upper Paraná basin) and A. lacustris (São Francisco basin) were formerly ascribed to the speciesA. bimaculatus, having only recently been recognized and de-scribed as distinct species belonging to the bimaculatus
species complex, a group comprising at least 15 species and subspecies that share a number of morphological traits (Garutti and Britski, 2000).
MtDNA restriction patterns obtained for two
Astyanax fasciatusindividuals from Três Marias, MG (São Francisco river basin), indicated the presence of one haplo-type that is distinct from the others detected in the Upper Paraná basin (data not shown). Due to the small sample size (N = 2), data from these individuals were not included in the analysis, in order to avoid any bias concerning the di-versity indices. However, the fact that this haplotype was not observed in any of the other populations ofA. fasciatus
sampled in the Upper Paraná basin might suggest some de-gree of isolation among populations of these two hydro-graphic basins. According to Menezes (1988), the Upper Paraná and São Francisco river basins are believed to have separated during the late Tertiary, originating a barrier to gene flow. In fact, cytogenetic and morphological studies have reported marked differences among populations of other fish species from these two basins (Almeida-Toledo
et al., 1993; Shibatta and Garavello, 1993). Garutti and Britski (2000) consider theAstyanax fasciatusspecies of the Upper Paraná basin as being different from those of the São Francisco basin. According to these authors, A. fasciatuscomprises a complex of related forms, and further analyses are likely to result in the description of several new species, as occurred with thebimaculatusgroup.
According to Garutti (1995), the genusAstyanaxhas a compartmentalized distribution, suggesting a remarkable endemism: there is a different form for each basin and, within each basin, there are several different forms with rel-atively restricted geographical distributions.
Thus, although the genusAstyanax presents a wide geographical distribution in the Neotropical region, most populations seem to be partially or totally isolated from each other. The results obtained so far suggest that random genetic drift and gene flow may be among the main forces affecting the geographical distribution of haplotypes in
Astyanaxspecies.
Molecular markers generated by RFLP analysis of mitochondrial DNA were very informative to characterize
Astyanaxspecies, and to detect intraspecific genetic vari-ability. The data presented provide a strong base for further analyses concerning population structure and evolutionary relationships within this group of Neotropical fishes.
Acknowledgments
References
Agnèse JF, Adépo-Gourène B, Abban EK and Fermon Y (1997) Genetic differentiation among natural populations of the Nile tilapia Oreochromis niloticus (Teleostei, Cichlidae). Heredity 79:88-96.
Almeida-Toledo LF, Foresti F, Daniel MF and Toledo-Filho SA (1993) Nucleolar chromosome variants in Sternopygus macrurus(Pisces, Sternopygidae) from three Brazilian river basins. Caryologia 46:53-61.
Avise JC, Arnold J, Ball RM, Bermingham E, Lamb T, Neigel JE et al (1987) Intraspecific phylogeography: the mitochon-drial DNA bridge between population genetics and system-atics. Annu Rev Ecol Syst 18:489-522.
Bermingham E, Lamb T and Avise JC (1986) Size polymorphism and heteroplasmy in the mitochondrial DNA of lower verte-brates. J Hered 77:249-252.
Billington N and Hebert P (1991) Mitochondrial DNA diversity in fishes and its implications for introductions. Can J Fish Aquat Sci 48 (suppl. 1):80-94.
Britski HA (1972) Peixes de água doce do Estado de São Paulo: Sistemática. In: Poluição e Piscicultura. Faculdade de Saúde Pública da USP, Instituto de Pesca da CPRN da Secretaria da Agricultura, São Paulo, pp 79-108.
Daniel-Siva MFZ (1996) Estudos citogenéticos comparativos em quatro espécies do gêneroAstyanax (Pisces, Characidae). Master’s Thesis, Universidade de São Paulo, São Paulo. Daniel-Silva MFZ and Almeida-Toledo LF (2001) Chromosome
R-banding pattern and conservation of a marker chromo-some in four species, genusAstyanax (Characidae, Tetra-gonopterinae). Caryologia 54(3):209-215.
Garutti V (1995) Revisão taxonômica dosAstyanax(Pisces, Cha-racidae), com mancha umeral ovalada e mancha no pedún-culo caudal, estendendo-se à extremidade dos raios caudais medianos, das bacias do Paraná, São Francisco e Amazô-nica. Livre-Docência Thesis, Universidade Estadual Paulis-ta, São José do Rio Preto.
Garutti V and Britski HA (1997) Descrição de uma espécie nova deAstyanax (Teleostei, Characidae), com mancha umeral horizontalmente ovalada, da bacia do rio Guaporé, Ama-zônia. Pap Avulsos Zool 40(14):217-229.
Garutti V and Britski HA (2000) Descrição de uma espécie nova de Astyanax(Teleostei: Characidae) da bacia do Alto Rio Paraná e considerações sobre as demais espécies do gênero na bacia. Comun Mus Ciênc Tecnol PUCRS, Sér Zool 13:65-88. Graves JE (1998) Molecular insights into the population
struc-tures of cosmopolitan marine fishes. J Hered 89:427-437. Hynes RA, Duke EJ and Joyce P (1989) Mitochondrial DNA as a
genetic marker for brown trout (Salmo trutta L.) popula-tions. J Fish Biol 35:687-701.
Kimura M (1953) `Stepping-stone’ model of population. Ann Rep Natl Inst Genet Japan 3:62-63.
Maistro EL, Oliveira C and Foresti F (2000) Sympatric occur-rence of two cytotypes of Astyanax scabripinnis (Chara-ciformes, Characidae). Genet Mol Biol 23(2):365-369. McElroy D, Moran P, Bermingham E and Kornfield I (1992) The
Restriction Enzyme Analysis Package (REAP). Version 4.0. J Hered 83:157-158.
Menezes NA (1988) Implications of the distribution patterns of the species of Oligosarcus (Teleostei, Characidae) from central and southern South America. In: Vanzolini PE and Heyer WR (eds) Proceedings of a workshop on neotropical
distribution patterns. Academia Brasileira de Ciências, Rio de Janeiro, pp 295-304.
Moreira-Filho O and Bertollo LAC (1991)Astyanax scabripinnis (Pisces, Characidae): a species complex. Rev Bras Genet 14:331-357.
Morelli S, Bertollo LAC, Foresti F, Moreira-Filho O and To-ledo-Filho SA (1983) Cytogenetic considerations on the ge-nusAstyanax(Pisces, Characidae). I. Karyotypic variability. Caryologia 36:235-244.
Moritz C, Dowling TE and Brown WM (1987) Evolution of ani-mal mitochondrial DNA: relevance for population biology and systematics. Annu Rev Ecol Syst 18:269-292.
Nei M (1987) Molecular Evolutionary Genetics. Columbia Uni-versity Press, New York, 512 pp.
Nei M and Li W-H (1979) Mathematical model for studying ge-netic variation in terms of restriction endonucleases. Proc Natl Acad Sci USA 76:5269-5273.
Nei M and Tajima F (1981) DNA polymorphism detectable by re-striction endonucleases. Genetics 97:145-163.
Oliveira C, Almeida-Toledo LF, Foresti F, Britski HA and To-ledo-Filho SA (1988) Chromosome formulae of Neotropical freshwater fishes. Rev Bras Genet 11:577-624.
Sambrook J, Fritsch EF and Maniatis T (1989) Molecular Clon-ing. A Laboratory Manual. 2nd edition. Cold Spring Harbor Laboratory Press, New York.
Shibatta OA and Garavello JC (1993) Estudo da variação geográ-fica emSalminus hilariiValenciennes, 1849, das bacias do Alto Paraná e São Francisco, através da análise morfométrica multivariada em componentes principais. Naturalia 18:109-116.
Simsek M, Olive DM and Al-Hassan JM (1990) Analysis of mito-chondrial DNA by restriction endonucleases to distinguish three species of Ariid catfish from the Arabian Gulf. Biochem Syst Ecol 18:467-469.
Slatkin M (1987) Gene flow and the geographic structure of natu-ral populations. Science 236:787-792.
Southern EM (1975) Detection of specific sequences among DNA fragments separated by gel electrophoresis. J Mol Biol 98:503-517.
Souza IL, Moreira-Filho O and Bertollo LAC (1995) Cytogenetic diversity in theAstyanax scabripinnis(Pisces, Characidae) complex. II. Different cytotypes living in sympatry. Cyto-logia 60:273-281.
Weitzman SH and Fink WL (1983) Relationships of the neon tet-ras, a group of South American freshwater fishes (Teleostei, Characidae), with comments on the phylogeny of new world characiforms. Bull Mus Com Zool Harv 150(6):339-395. Weitzman SH and Malabarba LR (1998) Perspectives about the
phylogeny and classification of the Characidae (Teleostei: Characiformes). In: Malabarba LR, Reis RE, Vari RP, Luce-na ZM and LuceLuce-na CA (eds) Phylogeny and classification of Neotropical fishes. EDIPUCRS, Porto Alegre, pp 161-170. Wolstenholme DR (1992) Animal mitochondrial DNA: structure
and evolution. In: Wolstenholme DR and Jeon KW (eds) International review of Cytology/A survey of Cell Biology -Mitochondrial Genomes, v. 141. Academic Press, New York, pp 173-216.