The use and limits of ITS data in the analysis of intraspecific variation
in
Passiflora
L. (Passifloraceae)
Geraldo Mäder
1, Priscilla M. Zamberlan
1, Nelson J.R. Fagundes
1, Tielli Magnus
1,
Francisco M. Salzano
1, Sandro L. Bonatto
2and Loreta B. Freitas
11
Programa de Pós-Graduação em Genética e Biologia Molecular, Departamento de Genética,
Instituto de Biociências, Universidade Federal do Rio Grande do Sul, Porto Alegre, RS, Brazil.
2Laboratório de Biologia Genômica e Molecular, Faculdade de Biociências,
Pontifícia Universidade Católica do Rio Grande do Sul, Porto Alegre, RS, Brazil.
Abstract
The discovery and characterization of informative intraspecific genetic markers is fundamental for evolutionary and conservation genetics studies. Here, we used nuclear ribosomal ITS sequences to access intraspecific genetic di-versity in 23 species of the genusPassiflora L. Some degree of variation was detected in 21 of these. The Passiflora andDecaloba (DC.) Rchb. subgenera showed significant differences in the sizes of the two ITS regions and in GC content, which can be related to reproductive characteristics of species in these subgenera. Furthermore, clear geo-graphical patterns in the spatial distribution of sequence types were identified in six species. The results indicate that ITS may be a useful tool for the evaluation of intraspecific genetic variation inPassiflora.
Key words:genetic diversity, intraspecific variability, ITS,Passiflora, phylogeography.
Received: March 11, 2009; Accepted: July 14, 2009.
Introduction
Understanding the distribution of alleles throughout the geographic range of a species is fundamental for molec-ular evolutionists, allowing inferences about the influence of historical processes in the spatial distribution of particu-lar lineages (Emersonet al., 2001). Phylogeography is a young discipline that represents a bridge linking population genetics, molecular phylogenetics and biogeography,
amongst other fields (Avise et al., 1987; Avise, 2000).
Phylogenetic methods can be used to construct haplotype trees that would indicate the historical relationships of gene lineages in a population or species. By comparing such trees to the geographical structure of the data one can infer historical patterns of population subdivision, as well as come to an understanding of current distribution of the ma-jor genetic clusters in a studied species, which may be
use-ful for conservation purposes (Frankham et al., 2002).
Furthermore, well-resolved phylogenies at the species-level or below are necessary to identify the taxa and popula-tions which have undergone recent speciation and those
which are currently diverging (Bradshaw et al., 1995;
Whittallet al., 2006).
For over two decades, nuclear ribosomal ITS (inter-nal transcribed spacers of the large subunit of ribosomal DNA) has been the most popular molecular marker in the nuclear genome for evolutionary studies in various plant
groups (e.g.Baldwin et al., 1995; Alvarez and Wendel,
2003; Hughes et al., 2006; Nieto-Feliner and Rosselló,
2007). Even though the use of ITS as a molecular marker might be problematic because of paralogy and other com-plex evolutionary patterns caused by its highly repetitive nature (Alvarez and Wendel, 2003), the general evolution-ary mechanism for this region proposes that most intra-genomic copies would share identical sequences as a result of concerted evolution, a homogenizing process that de-pends on unequal crossing over during meiosis and biased gene conversion (Dover, 1994; Liao, 1999).
Another advantage in using ITS as molecular marker in plants is that it provides an alternative to cpDNA mark-ers, which may inform only part of the history of a species, since cpDNA is usually inherited from only one of the par-ents (Birky Jr., 2001; Xu, 2005), and thus proposed migra-tion patterns based entirely on cpDNA may be inaccurate when applied to the population as a whole. The ITS region has been successfully used to infer phylogeographic
pat-terns in a wide range of species (Jeandroz et al. 1997;
Manoset al., 1999; Rodriguez-Lanetty and
Hoegh-Guld-berg, 2002; Duranet al., 2004; Lorenz-Lemkeet al., 2005;
Koehler-Santos et al., 2006; Nettel and Dodd, 2007;
Genetics and Molecular Biology, 33, 1, 99-108 (2010)
Copyright © 2009, Sociedade Brasileira de Genética. Printed in Brazil www.sbg.org.br
Send correspondence to Loreta B. Freitas. Departamento de Ge-nética, Instituto de Biociências, Universidade Federal do Rio Gran-de do Sul, Caixa Postal 15053, 91501-970 Porto Alegre, RS, Brazil. E-mail: [email protected].
Yamajiet al., 2007). Furthermore, since the ITS region is flanked by well-conserved rRNA genes, universal primers can be used for widely different plant groups, thereby avoiding the need for developing specific primer sets, as is the case for SSR markers.
Passiflora L. is the largest genus in the Passiflo-raceae, consisting of over 520 species, recently split into four subgenera (Feuillet and MacDougal, 2003). The mo-lecular phylogeny of the genus has been investigated by various authors, and in general is in agreement with the morphological proposition of subgenera classification (Muschneret al., 2003; Yockteng and Nadot, 2004; Hansen et al., 2006). Particularly, Muschneret al.(2003) and AK Hansen (PhD. Thesis, University of Texas, 2004) have used ITS to estimate phylogenies for the whole genus. Krosnick and Freudenstein (2005) have used ITS with success to
ana-lyze Supersection Disemma (subgenus Decaloba (DC.)
Rchb. Lorenz-Lemkeet al.(2005) and Koehler-Santoset
al. (2006) have also assessed intraspecific variability for twoPassifloraspecies based on ITS sequences.
In this study, we used ITS sequences to evaluate gen-eral patterns of intra and interspecific variation in sevgen-eral species representing all fourPassiflorasubgenera, to test the usefulness of this genetic marker for further phylo-geographic studies in this genus. We found general differ-ences in ITS structure between the two most speciose subgenera (PassifloraandDecaloba), besides identifying geographic associations among lineages in at least six spe-cies.
Materials and Methods
Plant material and DNA extraction
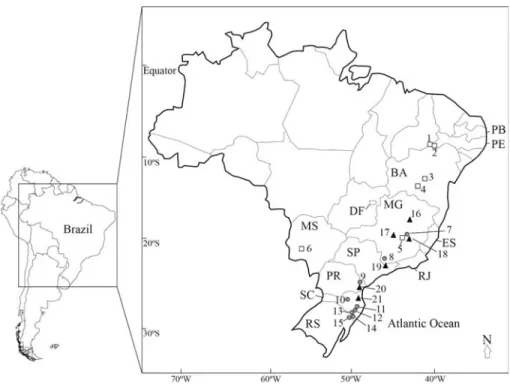
Leaf material was obtained from different geograph-ical regions (Table 1). Figure 1 shows collection sites for those species whose preliminary phylogeographical pattern
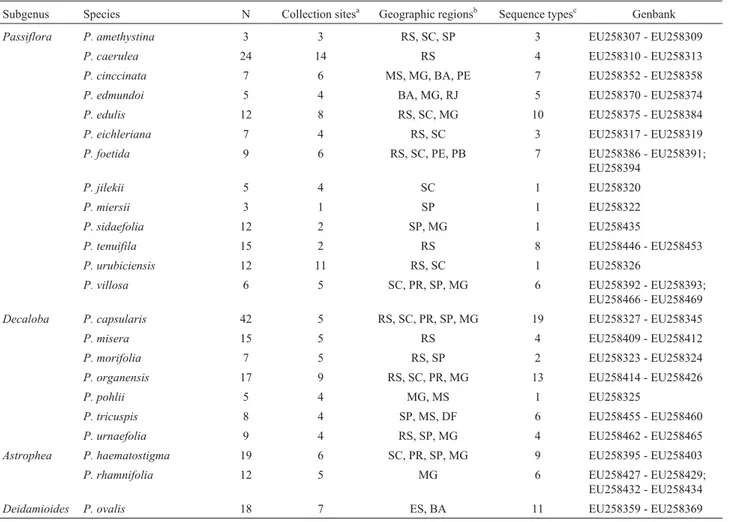
Table 1- List of the species studied, their taxonomic position according to the infrageneric classification of Feuillet and MacDougal (2003), and GenBank accession numbers for DNA sequences. The number of individuals examined, the number of collection sites and the geographic origin of the populations are given for each species.
Subgenus Species N Collection sitesa Geographic regionsb Sequence typesc Genbank
Passiflora P. amethystina 3 3 RS, SC, SP 3 EU258307 - EU258309
P. caerulea 24 14 RS 4 EU258310 - EU258313
P. cinccinata 7 6 MS, MG, BA, PE 7 EU258352 - EU258358
P. edmundoi 5 4 BA, MG, RJ 5 EU258370 - EU258374
P. edulis 12 8 RS, SC, MG 10 EU258375 - EU258384
P. eichleriana 7 4 RS, SC 3 EU258317 - EU258319
P. foetida 9 6 RS, SC, PE, PB 7 EU258386 - EU258391;
EU258394
P. jilekii 5 4 SC 1 EU258320
P. miersii 3 1 SP 1 EU258322
P. sidaefolia 12 2 SP, MG 1 EU258435
P. tenuifila 15 2 RS 8 EU258446 - EU258453
P. urubiciensis 12 11 RS, SC 1 EU258326
P. villosa 6 5 SC, PR, SP, MG 6 EU258392 - EU258393;
EU258466 - EU258469 Decaloba P. capsularis 42 5 RS, SC, PR, SP, MG 19 EU258327 - EU258345
P. misera 15 5 RS 4 EU258409 - EU258412
P. morifolia 7 5 RS, SP 2 EU258323 - EU258324
P. organensis 17 9 RS, SC, PR, MG 13 EU258414 - EU258426
P. pohlii 5 4 MG, MS 1 EU258325
P. tricuspis 8 4 SP, MS, DF 6 EU258455 - EU258460
P. urnaefolia 9 4 RS, SP, MG 4 EU258462 - EU258465
Astrophea P. haematostigma 19 6 SC, PR, SP, MG 9 EU258395 - EU258403
P. rhamnifolia 12 5 MG 6 EU258427 - EU258429;
EU258432 - EU258434
Deidamioides P. ovalis 18 7 ES, BA 11 EU258359 - EU258369
aThe collection sites forP. cinccinata P. organensisandP. haematostigmaare shown in Figure 1. b
Abbreviations refer to Brazilian states: RS: Rio Grande do Sul; SC: Santa Catarina; PR: Paraná; SP: São Paulo; RJ: Rio de Janeiro; ES: Espírito Santo; MG: Minas Gerais; MS: Mato Grosso do Sul; DF: Distrito Federal; BA: Bahia; PE: Pernambuco.
was evaluated. Voucher specimens were deposited in the ICN Herbarium, Botany Department, Biosciences Institute, Federal University of Rio Grande do Sul. Total DNA was extracted from young leaves dried in silica gel, using the method of Royet al.(1992).
PCR amplification and sequencing
Internal transcribed spacers (ITS 1 and 2) were ampli-fied using primers and amplification conditions as de-scribed by Desfeux and Lejeune (1996). To exclude the presence of low stability templates, 10% dimethyl
sulfo-xide (DMSO) was used (Buckler IV et al., 1997;
Fuer-tes-Aguilaret al., 1999). PCR products were checked by
horizontal electrophoresis in 1% agarose gel stained with GelRed (Biotium). All PCR products were purified using the polyethyleneglycol (PEG) precipitation method (Dunn and Blattner, 1987). The sequencing reaction was per-formed as described by Sangeret al.(1977) using ET termi-nators kit (GE Healthcare) on a MegaBACE 1000 auto-matic sequencer (Amersham Biosciences). The quality of the sequences was examined through the Chromas package
(available from http://www.technelysium.com.au/
chromas.html). Nucleotide sequences were searched against the GenBank database (http://ncbi.nlm.nih.gov/
BLAST) using BLAST tools (Altschulet al., 1990).
Data analysis
GenBank numbers for the obtained sequences are given in Table 1. Forward and reverse reads were analyzed for all sequences. A site was identified as ambiguous when
double peaks occurred in the same position in both strands, with the weakest signal reaching at least 25% of the strength of the strongest (Fuertes-Aguilar et al., 1999; Fuertes-Aguilar and Nieto-Feliner, 2003). The term ‘am-biguous’ was used instead of ‘heterozygote site’, as the ori-gin of ambiguity could not be determined with any degree of certainty, since a variation might represent an actual heterozygote (for which each allele had been inherited from one parent) or only a variation among different ITS copies across the genome. Thus, in all analysis, ambiguous sites were treated as missing data. Sequences were aligned with the PRANK program (Löytynoja and Goldman, 2008). Variable sites, nucleotide and haplotypic diversity, were estimated using the Arlequin 3.11 (Excoffieret al., 2005) software. Relationships among sequences were inferred by
means of median-joining networks (Bandeltet al., 1999)
under Network version 4.5. Finally, inter and intraspecific distances were estimated with PAUP* version 4.0 (Swofford, 1998), by taking the distance estimated through maximum likelihood, and assuming the evolutionary model suggested under the Aikaike Information Criterion in the Modeltest 3.7 program (Posada and Crandall, 1998). Since the sequences among subgenera were too divergent to be combined in the same alignment, diversity in each subgenus was analyzed separately.
Results
GC content ranged from 49% to 66% (Table 2 - align-ments are available directly from the authors), with an aver-age of 60%, being significantly higher in the subgenus
ITS diversity inPassiflora 101
Mäder
et
al.
Subgenera and spe-cies
ITS1 5.8 S ITS2 %GC Nucleotide
diver-sity
Sequence diversity
Length Ts Tv Indels Ts Tv Indels Length Ts Tv Indels
Passiflora
P. amethystina 227 0 [0] 0 [0] 0 0 [0] 0 [0] 0 215 3 [0] 2 [0] 1 64 0.0050 (0.0044) 1.0000 (0.2722)
P. caerulea 227 3 [1] 0 [0] 0 0 [0] 0 [0] 0 222 1 [1] 0 [0] 1 63 0.0010 (0.0009) 0.5000 (0.0665)
P. cinccinata 233 5 [1] 6 [0] 2 0 [0] 0 [0] 0 218 4 [1] 4 [1] 0 63 0.0104 (0.0059) 0.9231 (0.0367)
P. edmundoi 226 5 [1] 3 [1] 0 0 [0] 0 [0] 0 218 2 [0] 3 [0] 2 64 0.0092 (0.0054) 0.8889 (0.0596)
P. edulis 227 6 [2] 5 [1] 0 1 [0] 0 [0] 0 219 3 [1] 2 [1] 2 64 0.0060 (0.0035) 0.9130 (0.0350)
P. eichleriana 225 1 [0] 1 [0] 0 0 [0] 0 [0] 0 220 1 [1] 3 [0] 0 64 0.0024 (0.0019) 0.2857 (0.1964)
P. foetida 230 26 [15] 7 [3] 8 0 [0] 0 [0] 0 214 14 [3] 6 [1] 14 60 0.0227 (0.0119) 0.8627 (0.0573)
P. jilekii 226 1 [1] 0 [0] 0 0 [0] 0 [0] 0 219 0 [0] 0 [0] 0 63 0 0
P. miersii 226 0 [0] 0 [0] 0 0 [0] 0 [0] 0 220 1 [1] 0 [0] 0 62 0 0
P. sidaefolia 226 4 [4] 5 [5] 0 0 [0] 0 [0] 0 184 2 [2] 1 [1] 0 66 0 0
P. tenuifila 226 10 [3] 3 [1] 0 0 [0] 0 [0] 0 218 0 [0] 4 [1] 0 63 0.0067 (0.0038) 0.8535 (0.0246)
P. urubiciensis 226 0 [0] 0 [0] 0 0 [0] 0 [0] 0 220 0 [0] 0 [0] 0 61 0 0
P. villosa 228 7 [1] 5 [2] 4 0 [0] 1 [1] 0 216 4 [0] 5 [1] 2 63 0.0168 (0.0093) 0.9091 (0.0459)
Decaloba
P. capsularis 271 11 [4] 0 [0] 0 3 [1] 0 [0] 0 203 11 [1] 3 [0] 6 55 0.0037 (0.0023) 0.9168 (0.0156)
P. misera 278 3 [1] 1 [0] 0 0 [0] 0 [0] 0 198 6 [1] 0 [0] 0 53 0.0014 (0.0011) 0.3873 (0.0969)
P. morifolia 275 4 [0] 1 [0] 0 0 [0] 0 [0] 0 198 1 [0] 2 [0] 0 54 0.0033 (0.0022) 0.2637 (0.1360)
P. organensis 277 10 [5] 9 [1] 0 0 [0] 0 [0] 0 199 2 [2] 0 [0] 0 54 0.0045 (0.0027) 0.9269 (0.0228)
P. pohlii 276 0 [0] 0 [0] 0 0 [0] 0 [0] 0 199 0 [0] 0 [0] 0 52 0 0
P. tricuspis 277 4 [3] 0 [0] 0 0 [0] 0 [0] 0 201 2 [2] 0 [0] 0 49 0.0008 (0.0008) 0.8667 (0.0467)
P. urnaefolia 276 0 [0] 2 [1] 0 1[1] 0 [0] 0 200 2 [1] 0 [0] 0 53 0.0009 (0.0009) 0.6536 (0.0982)
Astrophea
P. haematostigma 269 5 [5] 0 [0] 0 0 [0] 0 [0] 0 208 3 [1] 5 [1] 4 63 0.0047 (0.0028) 0.7568 (0.0663)
P. rhamnifolia 269 3 [1] 4 [1] 0 0 [0] 0 [0] 0 204 1 [1] 0 [0] 0 63 0.0022 (0.0016) 0.8116 (0.0465)
Deidamioides
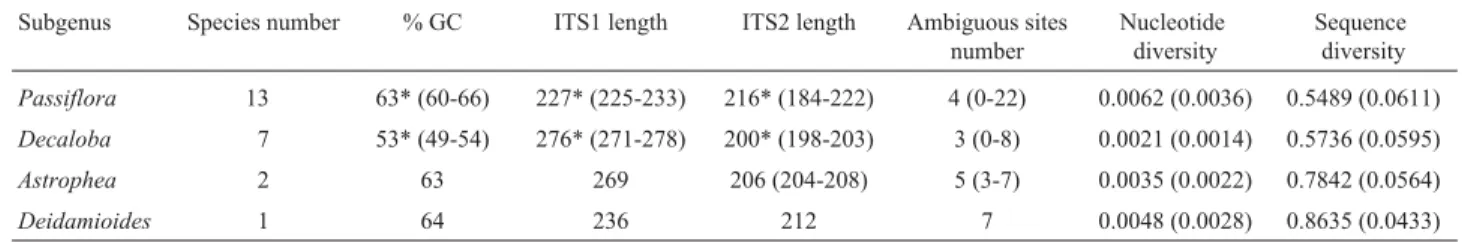
Passiflora(63%) than inDecaloba(53%) (p < 0.002). ITS1
length varied between 225 bp (P. eichleriana Mast.) and
278 bp (P. miseraHBK), whereas for ITS2, this variation was from 184 bp (P. sidaefoliaM. Roemer) to 222 bp (P. caeruleaL.) (Table 2). ITS length was significantly differ-ent between the two subgenera for both ITS1 and ITS2 (Ta-ble 3). The size of the 5.8S gene (160 bp) was constant in all analyzed species, although a certain intraspecific polymor-phism, half of which represented by ambiguous sites, was found in this region inP. capsularisL., P. edulisSims.,P. urnaefoliaRusby. andP. villosaVell.
With the exception ofP. pohliiMast., in Mart.
(sub-genus Decaloba) and P. urubiciensis Cervi (subgenus
Passiflora), both of which were monomorphic, all species had some degree of intraspecific variability, represented by insertion/deletion (indels) and substitution events, part of which involving ambiguities. When we excluded all ambi-guities from the dataset for subsequent analyses we found
that three more species become monomorphic (P. jilekii
Wawra,P. miersiiMast. in Mart. andP. sidaefolia, all be-longing to the subgenusPassiflora). The number of nucleo-tide substitutions was higher than indels, and transitions more numerous than transversions (Table 2). The intra-specific index of nucleotide diversity varied from zero to 0.0227 (Table 2). The highest intraspecific pairwise dis-tance was 0.0447 (P. foetidaL.). Pairwise interspecific dis-tances between individuals belonging to species from the same subgenus, varied from 0.0128 to 0.0260 in the
subge-nus Astrophea (DC.) Mast. (both between P.
haematostigmaMart. ex Mast. andP. rhamnifoliaMast.), from 0.0049 (P. tricuspisMast. in Mart.vs. P. organensis Gard.) to 0.3860 (P. capsularis vs. P. morifolia Mast. in Mart.) inDecalobaand from zero (P. miersiiMast. in Mart. vs. P. edmundoi Sacco) to 0.1713 (P. caerulea vs. P. foetida) in Passiflora. For the subgenus Deidamioides (Harms) Killip a single species was studied. The distribu-tions of inter and intraspecific pairwise distances are shown in Figure 2.
As in this study we presented an overview of ITS ge-netic diversity inPassifloraspecies as a whole, rather than an exhaustive analysis of just a few species, it could be ar-gued that the somewhat limited, and to some extent, un-equal sampling of the different species may tend to bias our estimates. To assess the influence of sample size on genetic
diversity, we calculated the Spearman correlation coeffi-cient between either sample size or number of sampled populations against two measures of genetic diversity, the number of different sequence types and nucleotide diver-sity. We observed a significant positive correlation be-tween sample size and both the number of sampled popula-tions and that of different sequence types (rS = 0.601, p = 0.002 and rS = 0.462, p = 0.027, respectively). Never-theless, when nucleotide diversity was considered, no sig-nificant correlation was found with either sample size or the number of sampled localities (rS = 0.070, p = 0.751; and rS = 0.260, p = 0.231; respectively). These results indicate that the values presented here for nucleotide diversity are independent of sampling artifacts, and thus may be viewed as approximations of the level of genetic diversity in these species. However, it is also evident from our data that in-creased sampling would be required for a better character-ization of all sequence types present in a given species.
When considered together with sampling locations,
genetic variation for at least six species (P.
haematostigma, P. organensis, P. cincinnata Mast., P. edmundoi, P. villosa, and P. capsularis) showed some geographic structure as can be observed from the network connecting the different sequence types (Table 4;
Figu-re 3). ForP. cincinnata (Figure 3a) there was a central
core of sequence types located in NE Brazil (BA and PE states), to which the others were connected, the most dis-tantly located population also having the most divergent sequence type. A more complex picture was observed for P. organensis(Figure 3b), wherein the most distinct
lin-ITS diversity inPassiflora 103
Table 3-Passiflorasubgenera average characteristics. Values within parentheses refer to the range of variation or standard deviation.
Subgenus Species number % GC ITS1 length ITS2 length Ambiguous sites number
Nucleotide diversity
Sequence diversity
Passiflora 13 63* (60-66) 227* (225-233) 216* (184-222) 4 (0-22) 0.0062 (0.0036) 0.5489 (0.0611)
Decaloba 7 53* (49-54) 276* (271-278) 200* (198-203) 3 (0-8) 0.0021 (0.0014) 0.5736 (0.0595) Astrophea 2 63 269 206 (204-208) 5 (3-7) 0.0035 (0.0022) 0.7842 (0.0564)
Deidamioides 1 64 236 212 7 0.0048 (0.0028) 0.8635 (0.0433)
*Statistically significant values (p < 0.002).
eages were found at the two extremes of distribution (MG and RS, see Figure1), whereas another group of lineages was arranged in a roughly north/south gradient. A clearer
pattern emerged forP. haematostigma(Figure 3c), with a
clear separation between the sequences from Minas
Ge-rais (MG) and those from other more southern localities, which are arranged in a north/south gradient (SP, PR, SC). Finally, in the three remaining species we also found dif-ferences among isolated individuals from different re-Figure 3- Median-joining networks based on ITS sequence types. Each circle represents a sequence type, their sizes being proportional to respective fre-quencies. Shading indicates the state in Brazil where each sequence-type was found (according to boxes; key to the abbreviations in Table 4). Transversal bars indicate the number of mutations that differentiate sequence types; Mv: median vector. The differences between the numbers of sequence types indi-cated in Table 1 forP. haematostigmaare due to hypervariable sites that were removed for network analysis. 3a -P. cincinnata; 3b -P. organensis; 3c -P. haematostigma.The relationship between sequence types and collection sites is indicated in Table 4.
Table 4- Collection points ofPassifloraspecies considered in phylogeographic analyses.
Species Sampling sites Geographic coordinates Sequence types
P. cincinnata 1- Casa Nova/BA 09° 09’43” S/40° 58’15” W c2
2- Petrolina/PE 09° 23’55” S/40° 30’03” W c1 3- Abaíra/BA 13° 14’59” S/41° 39’49” W c3,c4
4- Caetité/BA 14° 07’36” S/42° 26’05” W c3 5- Brumadinho/MG 20° 08’36” S/44° 11’59” W c7 6- Jardim/MS 21° 28’49” S/56° 07’53” W c6
P. organensis 7- Caeté/MG 19° 52’56” S/43° 40’12” W o3 8- Munhoz/MG 22° 36’31” S/46° 21’41” W o1, o2
9- Quatro Barras/PR 25° 20’16” S/48° 54’49” W o4, o5, o6 10- Petrolândia/SC 27° 35’29” S/49° 44’14” W o5, o8, o9 11-Bom Jardim da Serra/SC 28° 22’14” S/49° 34’41” W o8
12- Timbé do Sul/SC 28° 49’42” S/49° 50’30” W o8 13- Praia Grande/SC 29° 07’25” S/49° 58’29” W o7 14- Três Cachoeiras/RS 29° 26’53” S/49° 55’37” W o10
15- Maquiné/RS 29° 34’36” S/50° 17’35” W o11, o12, o13 P. haematostigma 16- São Gonçalo do Rio Preto/MG 18° 00’15” S/43° 23’27” W h2, h4
17- Araújos/MG 19° 53’59” S/45° 15’21” W h2 18- Itabirito/MG 20° 22’01” S/43° 39’40” W h1, h2, h3, h4 19- Biritiba/SP 23° 39’04” S/46° 08’17” W h5, h6, h7
gions albeit with a non-trivial relationship between genetic lineages and geography.
Discussion
In almost all the species sampled in this study (21 out of 23), a certain degree of genetic variation occurred in the ITS region, even though for some of these only few individ-uals were sequenced. This is in agreement with other stud-ies, thereby implying that in Passiflora, the ITS region seems to be more informative at the populational level than
other marker. Lorenz-Lemkeet al.(2005), when studying
32 individuals ofP. actiniaHook and 20 individuals ofP. elegansMast., and Koehler-Santoset al.(2006), studying 32 plants fromP. alataCurtis, all discovered genetic varia-tion on using ITS but none with cpDNA markers.
Lorenz-Lemkeet al.(2005) found 32 polymorphic sites.
Nucleo-tide diversity was 0.0060 in P. actinia and 0.0020 inP.
elegans, whereas Koehler-Santoset al.(2006) detected an ITS nucleotide diversity value of 0.0036 as inP. alata.
Patterns of intraspecific variation inPassiflorahave been also studied by using different markers. More
specifi-cally, Fajardoet al.(1998) employed RAPD markers and
found higher levels of variation inP. ligularisJuss. andP. adenopoda DC. when compared to P. edulis and P. maliformisL., whereas Sanchezet al.(1999) used cpDNA restriction fragment length polymorphism, and found
intra-specific variation in four species (P. maliformis, P.
ligularis,P. edulis, andP. mollissima(Kunth) Bailey), but no variation in another three (P.caerulea,P.sp. india, and P. adenopoda). Finally, a morphometric approach under-taken by Plotzeet al.(2005) found different levels of varia-tion in leaf vein pattern among ten species, withP. caerulea being the most diverse. Even though differences among sampled species and markers make a direct comparison of these studies difficult, the emerging overall picture is that intraspecific variation is not evenly distributed among spe-cies, and that a common pattern of intraspecific diversity for the nuclear genome, the plastid genome and morphol-ogy may be hard to obtain, given the discrepancy of differ-ent datasets for the same species (e.g. P. caerulea,P. edulis andP. maliformis). Possibly, this picture reflects the com-plexities of the evolutionary history of the genus, and indi-cates that robust patterns would only emerge when different markers are considered together.
In this study we did not take into consideration sites for which two nucleotides could be detected in the same in-dividual. Because there are several ITS repeats and because each individual inherited its genome from both of its par-ents, it is not possible to know whether sites harboring two different nucleotides are really heterozygous or whether they rather represent ITS sequence variation across differ-ent repeats in a single haploid genome. It is therefore im-possible to infer meaningful haplotypes based on ITS sequences obtained from PCR amplifications from total DNA. Importantly, because we excluded from our analysis
all sites with ambiguous information, the degree of genetic variation in the ITS region in this genus is actually an un-derestimate. A way of maximizing the detection of genetic variation in ITS sequences would be by cloning all individ-uals and sequencing multiple clones for each. However, this alternative is not only expensive for phylogeographic and population genetics studies, but might also be subject to criticism because one would be mixing orthologous and paralogous variation in a single analysis (Bailey et al., 2003). AK Hansen (PhD. Thesis, University of Texas, 2004) sequenced ITS clones obtained for 41Passiflora spe-cies and observed that in 25% of the studied taxa, various ITS sequences were more related to sequence types in other species. It is not known whether this illustrates the com-plexity of using paralogue ITS sequences in a single analy-sis or not, since, according to other studies on the same genus, variation patterns inconsistent with sequence types from a single monophyletic species have never been found (Muschneret al., 2003; Krosnick and Freudenstein, 2005; Lorenz-Lemkeet al., 2005).
A comparison of intra and interspecific genetic dis-tances (Figure 2) suggests little overlap between the two levels, with more than 50% of the intraspecific compari-sons resulting in values larger than zero, thus stressing the potential of the ITS region as a molecular marker in phylo-geographic studies inPassiflora. The narrow overlap be-tween intra and interspecific values may be understood in two-ways. First, the intraspecific genetic variation may be inflated if there are unrecognized species within a given taxon name. This may be the case forP. foetida, for which 38 varieties are recognized (Killip, 1938), and which showed the highest intraspecific variation (Table 2). A thorough taxonomic revision of this species would there-fore considerably reduce the overlap between intra and interspecific genetic variation in the ITS region. Second, interspecific distances are expected to be low between cently diverged species. Thus, we may expect that either re-cent speciation events or taxonomic confusion would cause an overlap between genetic distances estimated at these two taxonomic levels. This may be of special concern for speciose groups. Moreover, differences represented by indel events are not taken into account when estimating dis-tances, thus probably reducing the overall estimate of inter-specific divergence. For example, some individuals fromP. miersiiandP. edmundoiare only differentiated by a 2-bp indel in the ITS2 region.
Provided that concerted evolution is often invoked as an explanation for the maintenance of genetic homogeneity among ITS copies, why then does genetic variation in the ITS region seems to be the rule rather than the exception in Passifloraspecies? The time for homogenizing different ITS copies depends on the number of the different copies, on the number of different chromosomes containing nrDNA, and on the crossing-over rate among chromosomes (Quijada et al., 1998), since crossing-over towards
meres seems to be more common, as previously shown in GossypiumL. and Thinopyrum A. Löve (Wendel et al., 1995; Li and Zhang, 2002). Melo and Guerra (2003) mapped the 45S ribosomal DNA (including the ITS region) in severalPassifloraspecies. In none of the species ana-lyzed (includingP. capsularis, P. cincinnata,P. edulis,P. haematostigmaandP. morifolia,) had nrDNA located in telomeres, this indicating that chromosome location in this genus may be, at least partly, responsible for a slow down in the homogenization of the different ITS copies. This could partially explain, independent of the taxonomy issues, the high values observed forP. foetida, which has six nrDNA clusters far from telomeres, in regions of reduced cross-ing-over.
The differences in ITS1 and ITS2 length and GC
con-tent, detected among species in the subgeneraPassiflora
andDecaloba, might be related to their significantly differ-ent evolutionary rates, as shown by Muschneret al.(2003). The latter also ascertained that ITS1 and ITS2 nucleotide diversities were significantly higher inDecaloba than in Passifloraspecies. Decaloba species are in general self-compatible (Ulmer and MacDougal, 2004), a condition that favors lower intrapopulation and higher interpopulation ge-netic diversities, as there is less pollen dispersion (Makiet al., 1999). In the present work, no difference was detected when average intraspecific nucleotidic diversities were compared inPassiflora. This indicates that, despite the dif-ferent evolutive rates, ITS intraspecific variability it is not distinct in these subgenera. We consider that the
differenti-ated evolutionary rates in the subgenera Decaloba and
Passiflora do not represent obstacles to the use of ITS
markers for intraspecific populational analysis in
Passifloraspecies. However, this question must be handled carefully when dealing with phylogenetic questions in this genus and is worthy of future study.
Even though our study did not aim at detecting fine phylogeographic structure for these species, for at least six species, sampling site location could be related to the ob-served genetic diversity. Despite the low number of sam-ples, the overall pattern seems to indicate a general latitudinal trend. Of course, detailed phylogeographic stud-ies will be required to reveal accurate geographic patterns, and to infer those evolutionary processes that influenced the distribution of the genetic lineages currently found in these species. It is interesting to note that Lorenz-Lemkeet al.(2005), also based on ITS sequences, detected similar patterns inP. actiniaandP. elegans. Palynological data in-dicate two Holocene expansions in the Brazilian Atlantic Rain Forest from the northeast towards south Brazil (Lorscheitter, 1997). Nonetheless, any extensive assess-ment of whether the history of the genetic lineages within these species indeed reflects concordant colonization routes in the Brazilian Atlantic Rain Forest will await fur-ther studies and additional data.
Despite their complex evolution, ITS sequences have high inter and intraspecific variability inPassifloraspecies. This information can be of importance for accessing their evolutionary history and contributing to conservation. At least in some species, a clear geographic structure of se-quence types can be identified, with expressive agreement among the different species. As a whole, the results pre-sented here indicate that ITS is a useful tool for evaluating intraspecific variability inPassifloraspecies.
Acknowledgments
To Cladinara Roberts Sarturi for aid with sequencing. This project was supported by Conselho Nacional de De-senvolvimento Científico e Tecnológico (CNPq), Coorde-nação de Aperfeiçoamento de Pessoal de Nível Superior (CAPES), Programa Especial em Taxonomia (CNPq-PRO-TAX), Fundação de Amparo à Pesquisa do Estado do Rio Grande do Sul (FAPERGS), and Pró-Reitoria de Pesquisa da Universidade Federal do Rio Grande do Sul (PRO-PESQ-UFRGS).
References
Altschul SF, Gish W, Miller W, Myers EW and Lipman DJ (1990) Basic local alignment search tool. J Mol Biol 215:403-410. Alvarez I and Wendel JF (2003) Ribosomal ITS sequences and
plant phylogenetic inference. Mol Phylogenet Evol 29:417-434.
Avise JC (2000) Phylogeography: The History and Formation of Species. Harvard University Press, London, 447 pp. Avise JC, Arnold J, Ball RM, Bermingham E, Lamb T, Neigel JE,
Reeb CA and Saunders NC (1987) Intraspecific phylogeo-graphy: The mitochondrial DNA bridge between population genetics and systematics. Annu Rev Ecol Syst 18:489-522. Bailey CD, Carr TG, Harris SA and Hughes CE (2003)
Character-ization of angiosperm nrDNA polymorphism, paralogy and pseudogenes. Mol Phylogenet Evol 29:435-455.
Baldwin BG, Sanderson MJ, Porter JM, Wojciechowski MF, Campbell CS and Donoghue MJ (1995) The ITS region of nuclear ribosomal DNA: A valuable source of evidence on Angiosperm phylogeny. Ann Mo Bot Gard 82:247-277. Bandelt HJ, Forster P and Röhl A (1999) Median-joining
net-works for inferring intraspecific phylogenies. Mol Biol Evol 16:37-48.
Birky Jr. CW (2001) The inheritance of genes in mitochondria and chloroplasts: Laws, mechanisms, and models. Annu Rev Genet 35:125-148.
Bradshaw HD, Wilbert SM, Otto KG and Schemske DW (1995) Genetic mapping of floral traits associated with reproductive isolation in monkey flowers (Mimulus). Nature 376:762-765.
Buckler IV ES, Ippolito A and Holtsford TP (1997) The evolution of ribosomal DNA: Divergent paralogues and phylogenetic implications. Genetics 145:821-832.
Dover G (1994) Concerted evolution, molecular drive and natural selection. Curr Biol 4:1165-1166.
Dunn IS and Blattner FR (1987) Charons 36 to 40: Multi-enzyme, high capacity, recombination deficient replacement vectors with polylinkers and polystuffers. Nucleic Acids Res 15:2677-2698.
Duran S, Giribet G and Turon X (2004) Phylogeographical his-tory of the spongeCrambe crambe(Porifera, Poeciloscle-rida): Range expansion and recent invasion of the Macaro-nesian islands from the Mediterranean Sea. Mol Ecol 13:109-122.
Emerson BC, Paradis E and Thebaud C (2001) Revealing demo-graphic histories of species using DNA sequence data. Trends Ecol Evol 16:707-716.
Excoffier L, Laval G and Schneider S (2005) Arlequin v. 3.0: An integrated software package for population genetics data analysis. Evol Bioinform online 1:47-50.
Fajardo D, Angel F, Grum M, Tohme J, Lobo M, Roca WM and Sanchez I (1998) Genetic variation analysis of the genus
PassifloraL. using RAPD markers. Euphytica 101:341-347. Feuillet CP and MacDougal JM (2003) A new infrageneric
classi-fication ofPassiflora. Passiflora 13:34-38.
Frankham R, Ballaou JD and Briscoe DA (2002) Introduction to Conservation Genetics. Cambridge University Press, Cam-bridge, 642 pp.
Fuertes-Aguilar J and Nieto-Feliner G (2003) Additive polymor-phisms and reticulation in an ITS phylogeny of thrifts (Armeria, Plumbaginaceae). Mol Phylogenet Evol 28:430-447.
Fuertes-Aguilar J, Rosselló JA and Nieto-Feliner G (1999) Nu-clear ribosomal DNA (nrDNA) concerted evolution in natu-ral and artificial hybrids ofArmeria(Plumbaginaceae). Mol Ecol 8:1341-1346.
Hansen AK, Gilbert LE, Simpson BB, Downie SR, Cervi AC and Jansen RK (2006) Phylogenetic relationships and chromo-some number evolution inPassiflora. Syst Bot 31:138-150. Hughes CE, Eastwood RJ and Bailey CD (2006) From famine to
feast? Selecting nuclear DNA sequence loci for plant spe-cies-level phylogeny reconstruction. Phil Trans R Soc B 361:211-225.
Jeandroz S, Roy A and Bousquet J (1997) Phylogeny and phylo-geography of the circumpolar genus Fraxinus(Oleaceae) based on internal transcribed spacer sequences of nuclear ri-bosomal DNA. Mol Phylogenet Evol 7:241-251.
Killip EP (1938) The American species on Passifloraceae. Field Mus Nat Hist Bot Ser 19:1-613.
Koehler-Santos P, Lorenz-Lemke AP, Muschner VC, Bonatto SL, Salzano FM and Freitas LB (2006) Molecular genetic varia-tion inPassiflora alata(Passifloraceae), an invasive species in southern Brazil. Biol J Linn Soc Lond 88:611-630. Krosnick SE and Freudenstein JV (2005) Monophyly and floral
character homology of Old World Passiflora (Subgenus
Decaloba, SupersectionDisemma). Syst Bot 30:139-152. Li D and Zhang X (2002) Physical localization of the
18S-5.8S-26S rDNA and sequence analysis of ITS regions in
Thinopyrum ponticum(Poaceae, Triticaceae): Implications for concerted evolution. Ann Bot 90:445-452.
Liao D (1999) Concerted evolution: Molecular mechanism and biological implications. Am J Hum Genet 64:24-30. Lorenz-Lemke AP, Muschner VC, Bonatto SL, Cervi AC,
Sal-zano FM and Freitas LB (2005) Phylogeographic inferences
concerning evolution of BrazilianPassiflora actiniaandP. elegans(Passifloraceae) based on ITS (nr DNA) variation. Ann Bot 95:799-806.
Lorscheitter ML (1997) Paleoambientes do sul do Brasil no Qua-ternário através da palinologia: Revisão dos resultados obti-dos. Rev Univ Guarulhos - Geociênc 2:197-199 (Abstract in English).
Löytynoja A and Goldman N (2008) Phylogeny-aware gap place-ment prevents errors in sequence alignplace-ment and evolution-ary analysis. Science 320:1632-1635.
Maki M, Morita H, Oiki S and Takahashi H (1999) The effect of geographic range and dichogamy of genetic variability and population genetic structure in Tricyrtis section Flavae
(Liliaceae). Am J Bot 86:287-292.
Manos PS, Doyle JJ and Nixon KC (1999) Phylogeny, biogeo-graphy, and processes of molecular differentiation in
Quercus subgenus Quercus (Fagaceae). Mol Phylogenet Evol 12:333-49.
Melo NF and Guerra Filho MS (2003) Variability of the 5S and 45S rDNA sites inPassifloraL. species with distinct base chromosome numbers. Ann Bot 92:309-316.
Muschner VC, Lorenz AP, Cervi AC, Bonatto SL, Souza-Chies TT, Salzano FM and Freitas LB (2003) A first molecular phylogenetic analysis ofPassiflora(Passifloraceae). Am J Bot 90:1229-1238.
Nettel A and Dodd RS (2007) Drifting propagules and receding swamps: Genetic footprints of mangrove recolonization and dispersal along tropical coasts. Int J Org Evol 61:958-71. Nieto-Feliner G and Rosselló JA (2007) Better the devil you
know? Guidelines for insightful utilization of nrDNA ITS in species-level evolutionary studies in plants. Mol Phylogenet Evol 44:911-919.
Plotze RO, Falvo M, Pádua JG, Bernacci LC, Vieira MLC, Olivei-ra GCX and Bruno OM (2005) Leaf shape analysis using the mutiscale Minkowski fractal dimension, a new morpho-metric method: A study with Passiflora (Passifloraceae) Can J Bot 83:287-301.
Posada D and Crandall KA (1998) Modeltest: Testing the model of DNA substitution. Bioinformatics 14:817-818.
Quijada A, Liston A, Delgado P, Vázquez-Lobo A and Alva-rez-Buylla ER (1998) Variation in the nuclear ribosomal DNA internal transcribed spacer (ITS) region of Pinus rzedowskii revealed by PCR-RFLP. Theor Appl Genet 96:539-544.
Rodriguez-Lanetty M and Hoegh-Guldberg O (2002) The phylo-geography and connectivity of the latitudinally widespread scleractinian coralPlesiastrea versiporain the Western Pa-cific. Mol Ecol 11:1177-1189.
Roy A, Frascaria N, Mackay J and Bousquet J (1992) Segregating random amplified polymorphic DNAs (RAPDs) inBetula alleghaniensis. Theor Appl Genet 85:173-180.
Sánchez I, Angel F, Grum M, Duque MC, Lobo M, Tohme J and Roca W (1999) Variability of chloroplast DNA in the genus
PassifloraL. Euphytica 106:15-26.
Sanger F, Nicklen S and Coulson AR (1977) DNA sequencing with chain-terminating inhibitors. Proc Natl Acad Sci USA 74:5463-5467.
Swofford DL (1998) PAUP* Phylogenetic Analysis Using Parsi-mony (* and others methods) v. 4. Sinauer Associates, Sunderland.
Ulmer T and MacDougal JM (2004)Passiflora: Passionflowers of the world. Timber Press, Portland, 430 pp.
Wendel JF, Schnabel A and Seelanan T (1995) Bidirectional interlocus concerted evolution following allopolyploid speciation in cotton (Gossypium). Proc Natl Acad Sci USA 92:280-284.
Whittall JB, Medina-Marino A, Zimmer EA and Hodges SA (2006) Generating single-copy nuclear gene data for a recent adaptive radiation. Mol Phylogenet Evol 39:124-34. Xu J (2005) The inheritance of organelle genes and genomes:
Pat-terns and mechanisms. Genome 48:951-958.
Yamaji H, Fukuda T, Yokoyama J, Pak J-H, Zhou C-Z, Yang C-S, Kondo K, Morota T, Takeda S, Sasaki H,et al.(2007)
Retic-ulate evolution and phylogeography in Asarum sect.
Asiasarum(Aristolochiaceae) documented in internal tran-scribed spacer sequences (ITS) of nuclear ribosomal DNA. Mol Phylogenet Evol 44:863-884.
Yockteng R and Nadot S (2004) Phylogenetic relationships amongPassifloraspecies base on the glutamine synthetase nuclear gene expressed in chloroplast (ncpGS). Mol Phylo-genet Evol 31:379-396.
Associate Editor: Márcio de Castro Silva Filho