Hearing Loss, Dizziness, and Carbohydrate
Metabolism
Pedro L. Mangabeira Albernaz
11Department of Otolaryngology, Hospital Albert Einstein, São Paulo, São Paulo, Brazil
Int Arch Otorhinolaryngol 2016;20:261–270.
Address for correspondence Pedro L. Mangabeira Albernaz, MD, PhD, Department of Otolaryngology, Hospital Albert Einstein, Av. Albert Einstein, 627 Sala 117, São Paulo, SP 05652-000, Brazil
(e-mail: [email protected]).
Introduction
The inner ear is a highly complex organ with similarly complex metabolic mechanisms. Changes in glucose and insulin blood concentration may cause hearing loss and vestibular disorders.
A relation between hearing loss and diabetes was first reported by Abel Jordão in 1864.1Hearing loss in diabetic patients may be of vascular origin, due to atherosclerosis. Rust et al.,2however, demonstrated a loss of external hair cells in diabetic rats, more intense in the ones that ingested rapidly absorbable sugars. It is quite probable that these changes can also happen in diabetic patients.
Hypoglycemia, however, affects the inner ear by means of strictly metabolic mechanisms.
Harril,3 in 1951, described hypoglycemia as a cause of migraine and vertigo. Tintera and Goldman4(1956), Gold-man5(1962), and Powers6(1972) analyzed cases of Menière’s disease associated to hypoglycemia.
Updegraff,7in 1977, proposed routine insulin titration for examining patients with auditory and/or vestibular disorders that presented a clinical possibility of altered carbohydrate metabolism.
Updegraff’s proposal was based on the observations of Joseph R. Kraft,8who, in 1975, published his database with 3,000 glucose tolerance tests, including simultaneous insulin Keywords
►
sensorineural hearing
loss
►
dizziness
►
carbohydrate
metabolism
Abstract
Introduction
Metabolic activity of the inner ear is very intense, and makes it sensitive
to changes in the body homeostasis. This study involves a group of patients with inner
ear disorders related to carbohydrate metabolism disturbances, including hearing loss,
tinnitus, dizziness, and episodes of vertigo.
Objectives
To describe the symptoms of metabolic inner ear disorders and the
examinations required to establish diagnoses. These symptoms are often the
fi
rst to
allow for an early diagnosis of metabolic disorders and diabetes.
Methods
Retrospective study of 376 patients with inner ear symptoms suggestive of
disturbances of carbohydrate metabolism. The authors present patients
́
clinical
symp-toms and clinical evaluations, with emphasis on the glucose and insulin essays.
Results
Authors based their conclusions on otolaryngological
fi
ndings, diagnostic
procedures and treatment principles. They found that auditory and vestibular
symp-toms usually occur prior to other manifestations of metabolic changes, leading to an
early diagnosis of hyperinsulinemia, intestinal sugar malabsorption or diabetes.
Previ-ously undiagnosed diabetes mellitus type II was found in 39 patients.
Conclusions
The identi
fi
cation of carbohydrate metabolism disturbances is important
not only to minimize the patients
’
clinical symptoms, but also to help maintain their
general health.
received
March 20, 2015
accepted
May 6, 2015
published online
July 23, 2015
DOI http://dx.doi.org/ 10.1055/s-0035-1558450.
ISSN 1809-9777.
Copyright © 2016 by Thieme Publicações Ltda, Rio de Janeiro, Brazil
titration. He demonstrated that glucose levels alone were insufficient to diagnose accurately carbohydrate metabolism disorders. He introduced the concept of diabetesin situ, or occult diabetes, to describe types of changes that would evolve gradually to clinical diabetes. In his book, published in 2008,9he concluded that, based on more than 14,000 tests, his original observations were correct.
Fukuda,10 in 1982, and Mangabeira-Albernaz and Fu-kuda,11in 1984, using Kraft’s method, analyzed a group of patients with metabolic problems and inner ear disorders, and concluded that hyperinsulinemia was the most common finding. They confirmed that the insulin levels were more sensitive indicators of carbohydrate metabolism changes than glucose levels.
In 1985, Mangabeira-Albernaz et al.12 described for the first time vestibular disorders caused by hypoglycemia re-sulting from defective enzyme mechanisms of the small intestine (brush border membrane disease). Mangabeira-Albernaz & Miszputen13reviewed this subject in 2014.
D’Avila and Lavinsky, in 2005, studied the glucose and insulin profiles in patients with Menière’s disease14and Zuma, Maia and Lavinsky, in 2006, studied otoacoustic emissions in an animal model of induced hyperinsulinemia.15 Ramos, Ramos et al. revised the topic of metabolic vertigo in 2014.16
The stria vascularis is the essential metabolic center of the inner ear. It is responsible for the endocochlear potential and the maintenance of the chemical structure of endolymph, removing its sodium and controlling its high concentration of potassium. This is accomplished by {Naþ-Kþ} ATPase, com-monly called sodium-potassium pump, an enzyme that is well-distributed in the organism and present in the stria in high concentrations.17
Koide et al.,18in 1960, studied the action of insulin in the inner ear of guinea pigs. They noticed that a reduction of cochlear microphonics occurred three hours after the admin-istration of 80 UI of insulin per kilogram of body weight. This reduction lasted for approximately 80 minutes. The adminis-tration of glucose or other Krebs’cycle substrates resulted in a partial recovery.
Mendelsohn and Roderique,19 in 1972, administered insulin to guinea pigs and reported changes in the chemical composition of endolymph: a progressive reduction of the potassium concentration and progressive increase in sodi-um concentration. Three hours after insulin administra-tion, the potassium concentration varied from 147.8 mEq/L to 57.1 mEq/L and the sodium concentration increased from 5.85 mEq/L to 96.4 mEq/L. There was a simultaneous reduction of the endocochlear potential, and of cochlear microphonics.
It is well known that glucose and oxygen are essential nutrients to the sodium-potassium pump; however, glucose transport mechanisms in the cochlea are not so well known. There are studies showing that glucose transport is accom-plished through communication junctions (nexus) with the help of a transporter (GLUT1), the presence of which has been demonstrated in the basal cells of the stria vascularis in mice. Immunochemical tests have shown that GLUT1, ocludine (a protein that closes the nexus) and the proteins conexin
26 and conexin 30 have also been demonstrated in the basal cells of the stria, also in mice.20
Theþ80 mV endocochlear potential is essential for normal hearing and is intimately related to the mechanisms for potassium transportation.21,22Sodium is also metabolized by the stria vascularis by means of selective channels.23
In patients with brush border membrane disease, the high concentrations of lactose and saccharose in the small intes-tine create an osmotic unbalance that results in transposition of blood glucose to the intestine, producing hypoglycemia. The unabsorbed sugars proceed to the colon and are digested by intestinal bacteria, resulting in abdominal distension and, often, gas and diarrhea.13
Changes in glucose and insulin blood concentration affect cochlear homeostasis by changing the chemical structure of endolymph. The increase in sodium concentration and reduc-tion of potassium increase osmotic pressure, requiring more water in the endolymphatic space. The volume increase causes endolymphatic hydrops. It is known that endolym-phatic hydrops is the substrate of Menière’s disease, but we also know that hydrops occurs in other inner ear disorders. On the other hand, hydrops may derive from excessive production or lack of absorption of the endolymph and these mechanisms are unrelated with metabolic disorders.
Methods
This research was approved by the Ethics Committee of the Hospital Albert Einstein (CAAE: 36936314.8.0000.0071).
This is a retrospective study, including 376 patients (155 males and 221 females) sequentially seen in a clinic, from January 2004 to June 2014, under suspicion of metabolic inner ear problems. Their ages varied from 14 to 81 years, with a mean of 46.90 years. The age distribution is shown in►Fig. 1. Twenty-six of these patients (6.91%) were obese or markedly overweight.
The clinical suspicion was based on the patients’histories and hearing tests. All of the patients underwent a clinical examination, a neurotological evaluation and laboratory procedures.
Physical and Otolaryngological Examinations. All of the patients underwent a general physical examination and ear, nose, and throat evaluation.
Audiological Evaluation. Next, patients underwent audio-logical tests, including pure tone audiometry, speech discrim-ination tests and immitance tests. Auditory brainstem responses and electrocochleography were performed in se-lected cases.
Vestibular tests. Balance and cerebellar tests were per-formed, as well as tests for spontaneous and gaze nystagmus, eyetracking, optokinetic nystagmus, torsion swing tests, and air caloric tests. The eye movements were recorded by electronystagmography.
patients drink a solution with 75 g of glucose. The authors deemed unnecessary to increase patients’ sugar intake before the test.
Authors considered a value equal to or smaller than 55 mg/dL of glucose at any point as hypoglycemia. Values of more than 200 mg/dL at any point were considered indicative of diabetes mellitus type II.
Resistance to insulin was measured by taking into account the fast values of glucose and insulin, using a calculator for HOMA IR (Homeostasis Model Assessment – Insulin Resistance).
The interpretation of the insulin curves was conducted according to the principles established by Kraft.
Kraft’s type I curve represents the normal pattern of insulin release. The normal fast levels are 5 to 30 μUI/mL and the peak values occur either at 30 or 60 minutes. The maximum value for the sample obtained at 120 minutes is 50μUI/mL and the sum of the value for 120 and 180 minutes shall not exceed 60μUI/mL.
In Kraft’s type II curve, peak levels also occur at 30 or 60 minutes; however, the values at 120 and 180 minutes are higher, characterizing anormal peak and slow recovery.
In Kraft’s type III curve the peak is delayed. The peak may occur at 120 minutes–subtype IIIA–or at 180 minutes– subtype IIIB.
Kraft’s type IV curve is characterized by high fast values of insulin (50μUI/mL or more) and are seen in diabetic patients. The patients with fast values of 30μUI or more with one or more glucose values above 200 mg/dL were included in this category.
Kraft’s type V curve shows low values of insulin at all times and is suggestive of intestinal sugar malabsorption.
Fifty-one of the patients with a type V curve were submit-ted to an oral lactose tolerance test, with samples collecsubmit-ted at fast, then 30, 60, and 90 minutes after the ingestion of 50 g of lactose. The increase in the glucose blood levels is normally higher than 20 mg/dL; lesser levels suggest brush border membrane disease, a small intestine disorder affecting the
production of disaccharidases, particularly lactase.12,13 The test is also considered positive when the patient has diarrhea after the lactose intake.
The test was not ordered when the patient had a clinical history of frequent diarrhea and gas episodes. For four patients, only the oral lactose tolerance test was ordered, in view of their gastrointestinal symptoms.
More recently, a genetic test for lactose intolerance that does not require a lactose intake has been also employed.24,25 For some patients other laboratory tests related to their clinical history, such as T4 and TSH, cholesterol and its fractions, triglycerides, liver function tests, cortisol, and dehydroepiandrosterone.
Imaging.Some image tests were ordered for some patients. Computerized tomography scans are important in the differ-ential diagnosis of structural cochlear defects such as Mon-dini’s dysplasia, dilated vestibular aqueducts, superior semicircular canal dehiscence and malformations of the internal acoustic meatus. Magnetic resonance imaging with paramagnetic contrast was required in patients with unilat-eral deafness to discard vestibular schwannomas and other tumors.
Results
Clinical History.The patients in this study presented cochlear symptoms, vestibular symptoms or a combination of both types. Cochlear symptoms alone were observed in 77 patients (20.42%); vestibular symptoms in 155 (41.11%). Cochlear and vestibular symptoms occurred together in 36 patients (9.54%). Tinnitus was present in 102 (27.05%) of the patients with cochlear symptoms. Typical Meniere’s syndrome was seen in 29 patients (7.69%); 28 patients (7.42%) had migraine; intraaural pressure was present in 16 patients (4.24%). A history of drop attacks was referred by 9 patients (2.38%) and 12 patients (3.18%) had panic syndrome.
intermittent blocking of the ears, similar to that observed during an airplane’s descent.
The most common vestibular symptom was the sensation offloating, like walking on a soft rubber foamfloor. Typical vertiginous episodes occurred in some patients.
Many patients described a sudden need to ingest foods rich in sugar; this usually coincided with moments of hypoglycemia. Some of them had parents or relatives with type II diabetes.
Some patients complained of digestive problems such as constipation, diarrhea, and abdominal distention.
Episodes of severe hypoglycemia were associated to dumping in patients submitted to gastrectomy. This also occurred, less severely, in patients subjected to bariatric surgery.
A few patients referred episodes of blurred vision. Many patients stated that stress and tension often aggra-vated their symptoms.
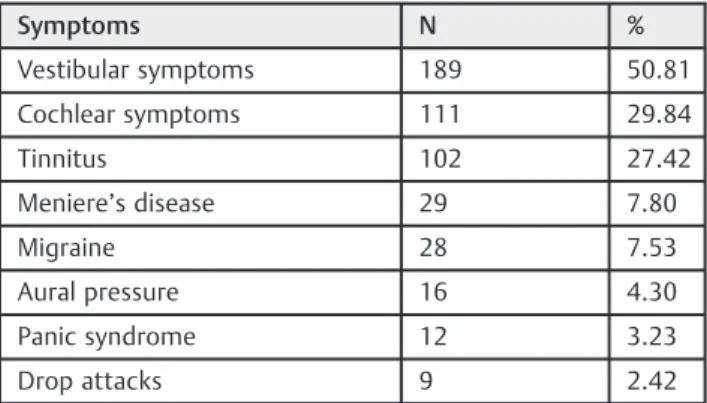
The symptoms of the 376 patients are shown in►Table 1. It is worth noting that many patients presented more than one of the symptoms listed.
Audiological Findings
►Fig. 2shows the most common audiometric curve observed in these patients. Speech discrimination was normal.
Immitance tests were usually normal. In some cases, electrocochleography showed changes in the relation be-tween summation and action potentials.
Vestibular Examination
Vestibular hyperreflexia was the most characteristicfinding in the vestibular evaluation of these patients. It was usually symmetrical, causing unsteadiness and afloating sensation. Some patients, however, presented asymmetrical responses and episodes of vertigo.
Glucose and Insulin Assays
The patients were divided into groups I, II, IIIA, IIIB, IV, and V, according to the type of their insulin curves, using Kraft’s classification.
►Table 2shows the means and standard deviations of the glucose blood levels.
The fast levels for glucose ranged from 67 to 146 mg/dL, with a mean of 85.93 and a standard deviation of 16.99.
Thirty-nine patients presented glucose levels of 200 mg/dL or more during the three-hour glucose tolerance tests.
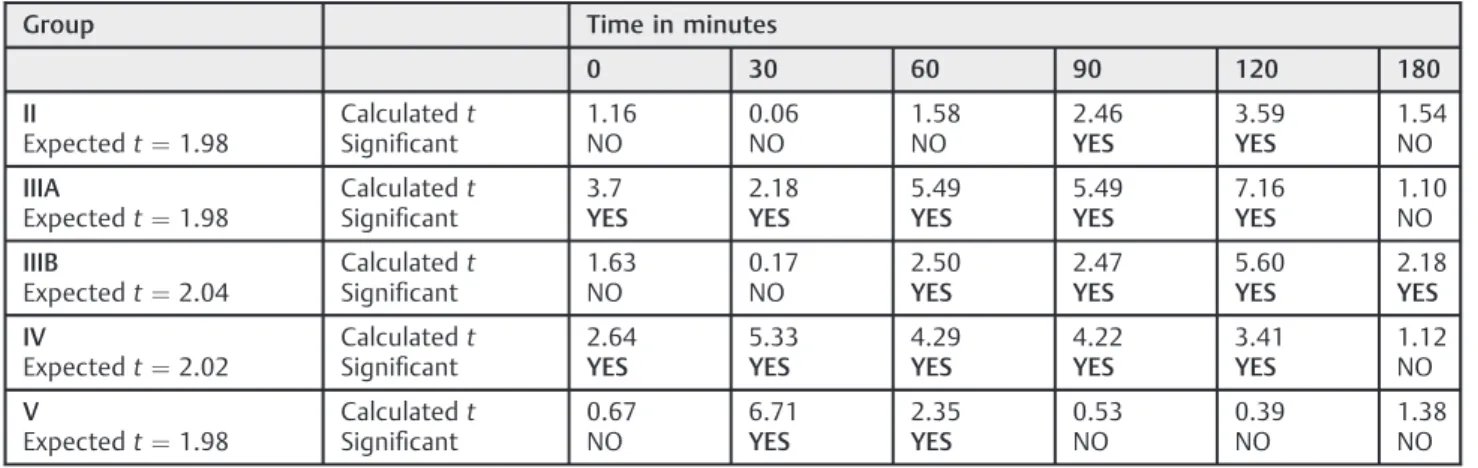
►Table 3shows a statistical evaluation of the significance of the differences in glucose blood levels found for groups II, IIIA, IIIB, IV, and V in relation to group I (normal). Studentt tests were employed to establish the significance of the results; the values of the expectedtcorrespond to a level of confidence of 0.05 (5.00%).
The values for the insulin curves, including the means and the standard deviations, are shown in►Table 4.
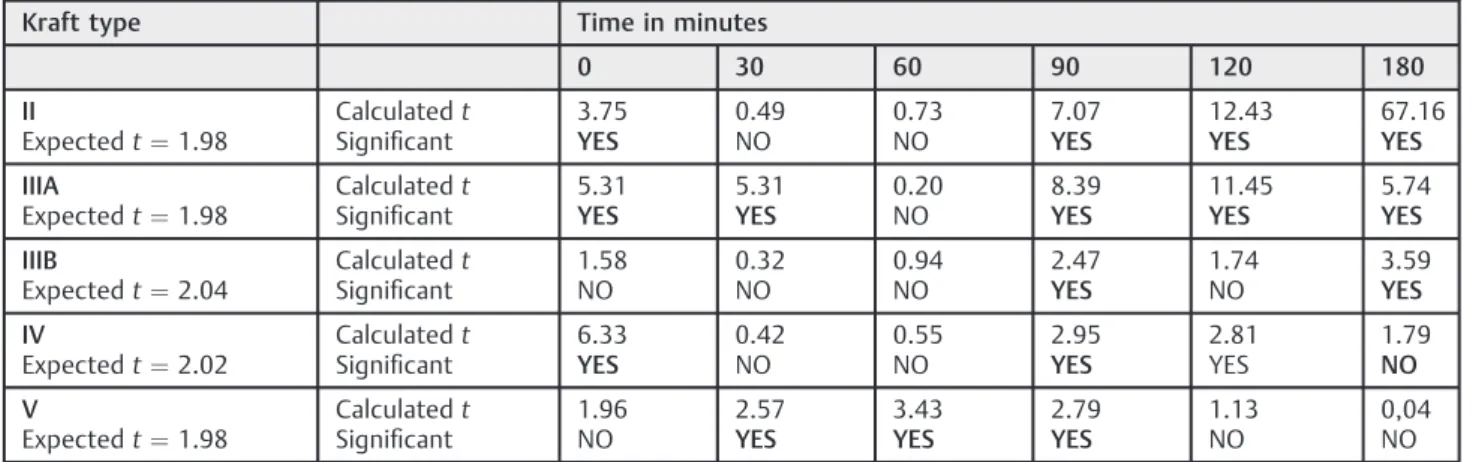
►Table 5shows a statistical evaluation of the significance of the differences in insulin blood levels found for groups II, IIIA, IIIB, IV, and V in relation to group I (normal).
Since all of the patients with insulin curve types II, IIIA, IIIB, and IV present hyperinsulinemia, they were compared to-gether with the patients with type V curves, who present intestinal malabsorption of carbohydrates (brush border membrane disease).
►Table 6shows mean glucose blood levels for the patients with hyperglycemia (groups II, IIIA, IIIB, and IV together) and the corresponding standard deviations.
►Table 7shows mean glucose blood levels for the patients with brush border membrane disease (group V) and the corresponding standard deviations.
►Table 8shows mean insulin blood levels for the patients with hyperinsulinemia (groups II, IIIA, IIIB, and IV) and the corresponding standard deviations.
►Table 9shows mean insulin blood levels for the patients with brush border membrane disease (group V) and the corresponding standard deviations.
►Fig. 3 shows a comparison of mean glucose levels in patients with hyperinsulinemia and brush border membrane disease.
►Fig. 4 shows a comparison of mean insulin levels in patients with hyperinsulinemia and brush border membrane. ►Table 10shows a statistical evaluation of the significance of the differences in insulin blood levels found for the patents with hyperinsulinemia (groups II, IIIA, IIIB, IV, together) and brush border membrane disease (group V).
Fig. 2 Audiogram most commonly seen in patients with metabolic disorders.
Table 1 Patients’symptoms
Symptoms N %
Vestibular symptoms 189 50.81
Cochlear symptoms 111 29.84
Tinnitus 102 27.42
Meniere’s disease 29 7.80
Migraine 28 7.53
Aural pressure 16 4.30
Panic syndrome 12 3.23
Drop attacks 9 2.42
Table 2 Patients’glucose blood levels
Time in minutes
Group 0 30 60 90 120 180
I mean 86.70 146.72 138.23 110.79 93.67 86.21
N¼31 std 9.88 31.63 44.12 46.28 33.89 25.07
II mean 89.01 152.56 152.13 132.8 117.09 78.50
N¼111 std 9.40 23.09 39.51 33.47 24.98 23.33
IIIA mean 95.79 161.15 181.90 171.49 151.28 92.56
N¼81 std 15.30 30.74 42.77 45.11 47.43 32.51
IIIB mean 90.67 149.67 164.33 161.67 162.33 133.00
N¼3 std 15.30 30.74 42.77 45.11 47.43 32.51
IV mean 100.36 199.09 179.91 180.27 157.18 104.10
N¼11 std 16.11 32.02 37.92 47.18 58.33 50.81
V mean 85.40 127.67 118.70 106.24 96.13 79.44
N¼135 std 9.05 25.50 29.19 26.01 22.17 23.10
Abbreviations: N, number of individuals; std, standard deviation.
Table 3 Statistical differences between groups II, IIIA, IIIB, IV, and V in relation to group I - glucose levels
Group Time in minutes
0 30 60 90 120 180
II
Expectedt¼1.98
Calculatedt
Significant
1.16 NO
0.06 NO
1.58 NO
2.46
YES
3.59
YES
1.54 NO
IIIA
Expectedt¼1.98
Calculatedt
Significant
3.7
YES
2.18
YES
5.49
YES
5.49
YES
7.16
YES
1.10 NO
IIIB
Expectedt¼2.04
Calculatedt
Significant
1.63 NO
0.17 NO
2.50
YES
2.47
YES
5.60
YES
2.18
YES
IV
Expectedt¼2.02
Calculatedt
Significant
2.64
YES
5.33
YES
4.29
YES
4.22
YES
3.41
YES
1.12 NO
V
Expectedt¼1.98
Calculatedt
Significant
0.67 NO
6.71
YES
2.35
YES
0.53 NO
0.39 NO
1.38 NO
Table 4 Insulin blood levels
Kraft Type Time in minutes
0 30 60 90 120 180
I mean 7.33 85.41 103.77 52.57 29.87 17.57
n¼31 std 4.04 88.69 94.14 22.56 11.50 10.14
II mean 11.57 93.55 116.65 102.03 88.30 30.11
N¼111 std 8.13 47.42 60.05 61.57 44.54 20.57
IIIA mean 12.64 72.60 107.43 123.19 140.86 56.00
N¼81 std 6.23 44.06 61.73 77.74 85.21 58.00
IIIB mean 16.00 100.33 156.33 132.33 165.67 225.67
N¼3 std 9.42 75.12 92.51 55.05 79.24 100.24
IV mean 38.45 96.18 123.45 146.09 129.27 66.50
N¼11 std 16.15 65.80 102.58 124.75 117.20 90.12
V mean 5.82 43.80 45.30 40.65 32.75 17.48
N¼135 std 3.08 21.71 17.99 19.43 17.68 15.09
Table 5 Statistical differences between groups II, IIIA, IIIB, IV, and V in relation to group I - insulin levels
Kraft type Time in minutes
0 30 60 90 120 180
II
Expectedt¼1.98
Calculatedt
Significant
3.75
YES
0.49 NO
0.73 NO
7.07
YES
12.43
YES
67.16
YES
IIIA
Expectedt¼1.98
Calculatedt
Significant
5.31
YES
5.31
YES
0.20 NO
8.39
YES
11.45
YES
5.74
YES
IIIB
Expectedt¼2.04
Calculatedt
Significant
1.58 NO
0.32 NO
0.94 NO
2.47
YES
1.74 NO
3.59
YES
IV
Expectedt¼2.02
Calculatedt
Significant
6.33
YES
0.42 NO
0.55 NO
2.95
YES
2.81 YES
1.79
NO
V
Expectedt¼1.98
Calculatedt
Significant
1.96 NO
2.57
YES
3.43
YES
2.79
YES
1.13 NO
0,04 NO
Table 6 Mean glucose blood levels in patients with hyperinsulinemia (N¼241)
Time in minutes
0 30 60 90 120 180
Mean (mg/dL) 92.31 158.54 166.46 151.99 133.33 86.11
std 11.81 28.15 42.51 43.28 41.05 31.22
Abbreviations: std, standard deviation.
Table 7 Mean glucose blood levels in patients with brush border membrane disease (N¼135)
Time in minutes
0 30 60 90 120 180
Mean (mg/dL) 85.40 127.67 118.70 106.24 96.13 79.44
std 9.05 25.50 29.19 26.01 22.17 23.10
Abbreviations: std, standard deviation.
Table 8 Mean insulin blood levels in patients with hyperinsulinemia (N¼241)
Time in minutes
0 30 60 90 120 180
Mean (μU/mL) 13.49 85.38 113.97 117.37 112.28 44.96
std 10.19 48.84 65.57 76.97 75.45 54.35
Abbreviations: std, standard deviation.
Table 9 Mean insulin blood levels in patients with brush border membrane disease (N¼135)
Time in minutes
0 30 60 90 120 180
Mean (μU/mL) 5.82 43.80 45.30 40.65 32.75 17.48
std 3.08 21.71 17.99 19.43 17.68 15.09
►Table 11shows the means and standard deviations of the glucose levels of the 55 patients submitted to an oral lactose tolerance test.
►Table 12shows the HOMA IR values for the patients with hyperinsulinemia, showing the percentage of cases in each type of Kraft curve that showed a value above the established limit of 2.7.
Imaging
The author found that one patient had a 1.5 mm intracana-licular vestibular schwannoma in the left ear. All other ear and/or cranial images were normal.
Discussion
Taking into consideration the series of studies previously performed by the present author and his associates,10,11,26a total of 1377 patients have been investigated over a period of 32 years, providing a significant amount of clinical experience.
There are no clear explanations for the fact that some patients have only cochlear symptoms, some have only vestibular symptoms whereas others have both cochlear and vestibular symptoms. Since the endolymph in the vestib-ular portion of the system does not have the 80 mV electric
charge, it would be reasonable to infer that the cochlea should be more sensitive to changes influids’chemical composition, but this is not the case. Mention must be made of symptoms not related to the inner ear, such as metabolic migraine, caused by excessive accumulation of sodium in the brain cells and blurred vision, caused by loss of glycogen in the lens in moments of intense hypoglycemia, recognized as a cause of cataracts in young persons.
Patients with hyperinsulinemia (Kraft curves type II, IIIA, IIIB, and IV) and patients with brush border membrane disease (Kraft curve type V) exhibit some clinical differences. Patients with excessive liberation of insulin have a ten-dency to present low glucose blood levels during certain hours of the day. The foods that cause excessive insulin liberation in sensitive people are the rapid absorption carbo-hydrates, such as purified sucrose and fructose.
Overweight patients have high levels of blood insulin caused by the increased peripheral insulin resistance due to blocked receptors. It is interesting to note the effect of bariatric surgery on these patients.
►Fig. 5 shows the marked differences in glucose and insulin blood levels in a 41-year-old female patient that underwent bariatric surgery. The glucose pre-operative curve shows a high fast blood level that rises to a delayed peak at 120 minutes.
The post-operative glucose curve shows a normal fast level, a normal peak at 30 minutes and reactive hypoglycemia at 120 minutes. This reactive hypoglycemia is common in total or partial gastrectomies due to dumping.
The pre-operative insulin curve shows a delayed peak at 180 minutes, showing that the pancreas is unable to react to the sudden increase in glucose blood level. The post-operative insulin curve is normal.
Brush border membrane disease, on the other hand, causes afluctuation of the glucose level due to the osmotic unbal-ance caused by unabsorbed sugars (usually lactose) in the small intestine. The limit established by Kraft is 30μUI/mL, but the author observed that some patients with confirmed disaccharidases had values up to 50μUI/mL. A double-peaked insulin curve, parallel to the glucose curve, was also found to be common in patients with intestinal carbohydrate malabsorption.
For these patients, the hypoglycemic peaks usually occur one to two hours after the glucose ingestion; whereas, in patients with hyperinsulinemia, it usually occurs three hours or more after the ingestion. The fact that patients with brush border membrane disease have symptoms similar to those with hyperinsulinemia supports the con-cept that the inner ear symptoms are actually related to hypoglycemia.
The involvement of the transport proteins that carry the monosaccharides into the blood stream after the enzymatic break-up of the disaccharides is usually affected by the disorder; therefore, it is also important to restrict sucrose to a certain extent. Maltase production is very rarely affected; it was only seen in rare cases of marathon runners, who would only eat carbohydrates for long periods of time. Contrary to patients with hyperinsulinemia, patients with Fig. 3 Mean glucose levels in patients with hyperinsulinemia (HI) and
brush border membrane disease (BBMD).
brush border membrane disease very seldom become diabetic.
In our original study12biopsies of the jejunal mucosa of the patients with suspected brush border membrane disease were obtained and we confirmed reduction or absence of lactase by microchemical assay. This was performed to ex-clude other types of intestinal disorders that could eventually produce similar symptoms. This turned out to be an unnec-essary procedure.
The hearing loss presented by each of these categories of patients is usually mild. Most of the time, the hearing thresh-olds for low and high tones show somefluctuation. As a rule, there is no complaint of hearing loss, since the thresholds for the speech frequencies are almost always within the normal social range; however, they often report the sensation of intermittent blocking, which they compare to what one experiences in a descending airplane. Furthermore, several patients refer to a sensitivity or discomfort toward loud noises.
Thefluctuant hearing loss and the sensitivity to noise are usually reversible with treatment. In some untreated cases, however, the hearing losses may become socially significant. The episodic sensation offloating, or walking over foam, is the most frequent vestibular symptom, although many pa-tients refer to episodes of vertigo. Vestibular hyperrelexia is the most commonfinding in vestibular examination, and is probably related to the changes in the density of endolymph, caused by the increased sodium concentration and water accumulation to correct osmotic changes.
Tension and stress often aggravate the symptoms by increasing the consumption of glucose by central nervous system cells.
The diagnosis of altered carbohydrate metabolism is con-firmed by the oral glucose tolerance test with simultaneous
insulin titration. Most clinicians rely only on the glucose fast levels for this diagnosis, but this is a test of low sensitivity, even if it is interpreted together with the glycated hemoglo-bin test. In this series of 376 patients, only 56 (14.89%) had glucose fast levels of 100 mg/dL or more. HOMA IR was abnormal (2.7 or greater) only in 25 patients (6.72%), suggest-ing that most of the patients in this study have intolerance to rapidly absorbable carbohydrates and do not show resistance to insulin.
The insulin curves were found to be twice as sensitive as the glucose curves.11It is interesting to note that there is a reluctance on the part of many clinicians and endocrinolo-gists to accept the predictions based on Kraft’s classification, in spite of the clinical and experimental data avail-able.9,11,18,19,26 Our findings confirm Kraft’s observations that insulin curves do, in fact, allow for the prediction of future diabetes.8,9
On the other hand, only 31 patients (8.22%) in this study had a normal (Kraft type I) insulin curve, indicating the value of the clinical history and neurological evaluation as a basis for the diagnosis of impaired carbohydrate metabolism.
The insulin curves were used to divide the patients into six groups, according to Kraft’s classification. Taking in consider-ation that the patients were selected on the basis of their clinical symptoms and results of neurotological tests, an actual control group is unavailable. For this reason the statistical tests were performed by comparing the patients with Kraft’s curve types II, IIIA, IIIB, IV, and V with the patients with type I (normal) curves.
In spite of the fact that the groups followed the classifi ca-tion of their insulin curves, it will be noted (►Tables 2and3) that the glucose curves of the patients in groups II, IIIA, IIIB, IV, and V showed statistically significant differences in relation to those of group I. This indicates that the glucose blood levels at
Table 10 Statistical differences between patients with hyperinsulinemia and brush border membrane disease
Time in minutes
0 30 60 90 120 180
GLUCOSE LEVELS
Expectedt¼1.98
6.34 10.83 12.84 12.82 11.41 19.04
Calculatedt
Significant
yes yes yes yes yes yes
INSULIN LEVELS
Expectedt¼1.98
11.93 11.36 15.26 14.67 15.62 5.10
Calculatedt
Significant
yes yes yes yes yes yes
Table 11 Means and standard deviations for oral lactose tolerance curves (N¼55)
Time in minutes
0 30 60 90
Mean (mg/dL) 84.31 96.05 92.12 91.25
std 12.57 15.76 16.82 19.63
different times are essentially dependent on the amount of liberated insulin. Statistically significant differences were also observed in relation to the insulin curves.
A comparison between the glucose and insulin levels of patients with hyperinsulinemia (groups II, IIA IIIB, and IV, together, compared with group V) also showed statistically significant differences.
The hearing losses that result from impaired carbohydrate metabolism are among the few that can be adequately treated and may return to normal. The same can be said of the vestibular symptoms, that disappear in most patients. In fact, controlling glucose blood levels and the amount of insulin liberated by the pancreas are effective not only to control inner ear symptoms, but also to identify patients that are prone to become diabetic and, possibly, delaying the onset of the disease.
These patients must reduce the intake of quickly absorb-able sugars and reduce intervals between their meals, eating every three hours of the day. The ideal food for the interme-diate meals are fruits; the fructose in fruit is not rapidly absorbed, being attached to the pulp of the fruit. As an alternative, unsweetened cereal bars or crackers can be consumed, or a light yogurt. Large molecule carbohydrates (i.e., bread, pasta, rice, beans) may be consumed, up to 100 g per day. Obese patients are strongly advised to lose weight to reduce the effect of insulin resistance due to the blocking of insulin receptors. The alternative is bariatric surgery, when indicated.
In patients with brush border membrane disease, we recommend only milk products without lactose.
Commer-cially available lactase may also be used to help digest milk and derivatives.
In view of the frequent involvement of the transport proteins that carry monosaccharides into the blood stream, sucrose must also be restricted. The amount of sugar intake must be determined by each patient using a trial-and-error approach. Such diets usually take 45 to 90 days to regulate the patient’s glucose levels. Those that suffer from severe vestib-ular disorders are given medications for a short period of time, until audiological tests show that hearing has been stabilized. Many vasodilator drugs increase the glucose con-sumption by the central nervous system cells; these medi-cations must be avoided.
The follow-up of patients with carbohydrate metabolism disorders of the inner ear is quite complex. Many patients do not return for tests. Occasionally, patients’ friends, or patients referred by them, relay that they are well. Some patients that abandoned their diets occasionally return when their symptoms get worse; most of them have been found to be diabetic.26
The identification of these problems, however, is very important for the patients. It provides them with a better quality of life, correcting their inner ear symptoms and preventing, or at least postponing for many years, the occur-rence of clinical diabetes.
Conclusions
The inner ears are very sensitive organs and, in many patients, are the first to show signs of carbohydrate metabolism disorders. The cochlear and vestibular symptoms resulting
Table 12 HOMA IR values
Type I Type II Type IIIA Type IIIB Type IV
Mean 0.93 1.41 1.64 1.96 4.70
Range 0.35/2.52 0.38/3.75 0.54/3.68 0.92/3.64 1.96/7.30
Standard Deviation 0.50 0.72 0.85 1.20 1.84
% above HOMA¼2.7 0% 5.41% 12.35% 33.33% 81.82%
Abbreviations: HOMA IR, Homeostasis Model Assessment–Insulin Resistance.
from these disorders are very common, can be diagnosed and treated, and are often reversible.
References
1 Jordão A. Estudos sobre a Diabete. Lisboa, Portugal: Typographia da Academia; 1864
2 Rust KR, Prazma J, Triana RJ, Michaelis OE IV, Pillsbury HC. Inner ear damage secondary to diabetes mellitus. II. Changes in aging SHR/N-cp rats. Arch Otolaryngol Head Neck Surg 1992;118(4): 397–400
3 Harrill JA. Headache and vertigo associated with hypoglycemic tendency. Laryngoscope 1951;61(2):138–145
4 Tintera JW, Goldman HB. Hypoadrenocorticism in otolaryngologic surgical procedures. N Y State J Med 1956;56(6):872–877 5 Goldman HB. Hypoadrenocorticism and endocrinologic treatment
of Meniere’s disease. N Y State J Med 1962;62:377–383 6 Powers WH. Metabolic aspects of Meniere’s disease. Laryngoscope
1972;82(9):1716–1725
7 Updegraff WR. Impaired carbohydrate metabolism and idiopathic Meniere’s disease. Ear Nose Throat J 1977;56(4):160–163 8 Kraft JR. Detection of diabetes mellitusin situ(occult diabetes). Lab
Med 1975;6(2):10–22
9 Kraft JR. Diabetes Epidemic and You. Trafford Publishing; 2008 10 Fukuda Y. Glicemia, Insulinemia e Patologia da Orelha Interna.
[dissertation]. São Paulo: Escola Paulista de Medicina, 1982 11 Mangabeira Albernaz PL, Fukuda Y. Glucose, insulin and inner ear
pathology. Acta Otolaryngol 1984;97(5-6):496–501
12 Mangabeira-Albernaz PL, Fukuda Y, Vilela MP, Miszputen SJ. Vestibular disorders caused by defective enzyme mechanisms in the small intestine. Acta Otolaryngol 1985;99(3-4):330–335 13 Mangabeira-Albernaz PL, Miszputen SJ. Vertigem e enzimas
di-gestivas. In Zuma e MFC, Mangabeira APL, Carmona PL. Otoneur-ologia Atual. Rio de Janeiro: Revinter; 2014:365–379
14 D’Avila C, Lavinsky L. Glucose and insulin profiles and their correlations in Ménière’s disease. Int Tinnitus J 2005;11(2): 170–176
15 Zuma e Maia FC, Lavinsky L. Distortion product otoacoustic emissions in an animal model of induced hyperinsulinemia. Int Tinnitus J 2006;12(2):133–139
16 Ramos S, Ramos RF, et al. Vertigem de Origem Metabólica. . In Zuma and Maia FC, Mangabeira Albernaz PL, Carmona PL. Oto-neurologia Atual, Rio de Janeiro, Brazil: Revinter; 2014:349–364 17 Kuijpers W, Bonting SL. Studies on (Naþ-Kþ)-activated ATPase.
XXIV. Localization and properties of ATPase in the inner ear of the guinea pig. Biochim Biophys Acta 1969;173(3):477–485 18 Koide Y, Tajima S, Yoshida M, Konno M. Biochemical changes in the
inner ear induced by insulin, in relation to the cochlear micro-phonics. Ann Otol Rhinol Laryngol 1960;69:1083–1097 19 Mendelsohn M, Roderique J. Cationic changes in endolymph
during hypoglycemia. Laryngoscope 1972;82(8):1533–1540 20 Suzuki T, Matsunami T, Hisa Y, Takata K, Takamatsu T, Oyamada M.
Roles of gap junctions in glucose transport from glucose trans-porter 1-positive to -negative cells in the lateral wall of the rat cochlea. Histochem Cell Biol 2009;131(1):89–102
21 Nin F, Hibino H, Doi K, Suzuki T, Hisa Y, Kurachi Y. The endoco-chlear potential depends on two Kþdiffusion potentials and an
electrical barrier in the stria vascularis of the inner ear. Proc Natl Acad Sci U S A 2008;105(5):1751–1756
22 Quraishi IH, Raphael RM. Generation of the endocochlear poten-tial: a biophysical model. Biophys J 2008;94(8):L64–L66 23 Kakigi A, Okada T, Takeda T, Taguchi D, Nishioka R. Presence and
regulation of epithelial sodium channels in the marginal cells of stria vascularis. Acta Otolaryngol 2008;128(3):233–238 24 Enattah NS, Sahi T, Savilahti E, Terwilliger JD, Peltonen L, Järvelä I.
Identification of a variant associated with adult-type hypolactasia. Nat Genet 2002;30(2):233–237
25 Mattar R, Monteiro MdoS, Silva JMK, Carrilho FJ. LCT-22018G: A single nucleotide polymorphism is a better predictor of adult-type hypolactasia/lactase persistence in Japanese-Brazilians than LCT-13910C>T. Clinics (São Paulo) 2010;65(12):1399–1400 26 Mangabeira-Albernaz PL. Inner Ear Disorders Induced by Impaired