Abstract
Submitted: July 17, 2016 Modiication: September 19, 2016 Accepted: October 10, 2016
Effects of radiant exposure values
using second and third generation
light curing units on the degree of
conversion of a lucirin-based resin
composite
Alternative photoinitiators with different absorption wavelengths have been used in resin composites (RCs), so it is crucial to evaluate the effectiveness of light-curing units (LCUs) on these products. Objective: Using Fourier transform infrared analysis (FTIR) in vitro, the effects of varying radiant exposure (RE) values generated by second and third generation LED LCUs on the degree of conversion (DC) and maximum rate of polymerization (Rpmax) of an experimental Lucirin TPO-based RC were evaluated. Material
and Methods: 1 mm or 2 mm thick silicon molds were positioned on a horizontal attenuated total relectance (ATR) unit attached to an infrared spectroscope. The RC was inserted into the molds and exposed to varying REs (18, 36 and 56 J/cm2) using second (Radii Plus, SDI) and third generation
LED LCUs (Bluephase G2/Ivoclar Vivadent) or a quartz tungsten based LCU (Optilux 501/SDS Kerr). FTIR spectra (n=7) were recorded for 10 min (1 spectrum/s, 16 scans/spectrum, resolution 4 cm-1) immediately after their
application to the ATR. The DC was calculated using standard techniques for observing changes in aliphatic to aromatic peak ratios both prior to, and 10 min after curing, as well as during each 1 second interval. DC and Rpmax
data were analyzed using 3-way ANOVA and Tukey’s post-hoc test (p=0.05). Results: No signiicant difference in DC or Rpmax was observed between the 1 mm or 2 mm thick specimens when RE values were delivered by Optilux 501 or when the 1 mm thick composites were exposed to light emitted by Bluephase G2, which in turn promoted a lower DC when 18 J/cm2 (13 s)
were delivered to the 2 mm thick specimens. Radii Plus promoted DC and Rpmax values close to zero under most conditions, while the delivery of 56
J/cm2 (40 s) resulted in low DC values. Conclusions: The third generation
LCU provided an optimal polymerization of Lucirin TPO-based RC under most tested conditions, whereas the second generation LED-curing unit was useless regardless of the RE.
Keywords: Composite resins. Dental photoinitiators. Dental curing lights. Kelly Antonieta Oliveira
Rodrigues de Faria CARDOSO1
Driellen Christine ZARPELLON2
Camila Ferreira Leite MADRUGA1
José Augusto RODRIGUES1
Cesar Augusto Galvão ARRAIS2
http://dx.doi.org/10.1590/1678-77572016-0388
1Universidade Guarulhos, Centro de Pós Graduação e Pesquisa, Guarulhos, SP, Brasil.
2Universidade Estadual de Ponta Grossa, Departamento de Odontologia, Ponta Grossa, PR, Brasil.
Corresponding address: Cesar Augusto Galvão Arrais Departamento de Odontologia Universidade Estadual de Ponta Grossa Av. Carlos Cavalcanti, 4748, Bloco M - Uvaranas
Introduction
In an attempt to meet patients’ growing needs for aesthetic satisfaction, clinicians are now frequently using teeth whitening techniques with their patients. As a result, bleached teeth have recently been lighter than usual6. In order to keep up with this new trend,
manufacturers have developed resin composites (RCs) with relatively unsaturated shades and a translucency to match bleached teeth. Given that camphorquinone (CQ), the most common photoinitiator used in light-cured RCs, has a bright yellow pigment that can interfere with the resin’s color when lighter shades are required5,27, lighter alternatives such as 1-Phenyl
1-2propanedione (PPD) or Lucirin TPO are being added to composite formulations9,18.
In contrast to camphorquinone, which has an absorption peak close to 470 nm, Lucirin TPO’s absorption peak is close to 390 nm. As a consequence, ultraviolet light with a wavelength ranging between 340 nm and 430 nm is required to activate this photoinitiator12,29. The irst and second generations
of light emitting diode (LED) light curing units (LCUs) used in dentistry emit blue light in a narrow wavelength between 410 and 470 nm. Thus, they are unable to properly cure resin materials in which the CQ has been partially replaced with alternative photoinitiators9,23,30.
Due to the limitations of the irst and second
generation LED LCUs, a “third generation” was developed. Also known as “polywave”, or multi-peak LCUs, these devices emit light with a wavelength ranging between 380 and 515 nm (from ultraviolet to blue) unlike the second generation LED LCUs, which emit light with a narrower wavelength (410 – 470 nm). For this reason, these polywave LED LCUs are able to provide optimal curing in photoactivated, resin-based materials that contain only alternative photoinitiators13,19,23. However, because the diodes
that emit ultraviolet light are not uniformly distributed on the LCU tip, polywave LED LCUs emit light of varying wavelengths through the LCU tip so that the wavelength of the beam of light is not uniformly distributed11. Therefore, the use of such devices can
impair polymerization in some areas of the surface and on bottom layers of these RCs14. In this regard,
it is possible that clinicians would expect that these LCUs are not as effective as quartz tungsten halogen (QTH) LCUs when different RE values are delivered to a Lucirin-based RC layer. However, there is no evidence
that polywave LED LCUs are more effective than QTH light in ensuring optimal polymerization when varying RE values are applied to composite resins that contain only Lucirin TPO. In addition, clinicians could also presume that exposing Lucirin-based resin composites to light emitted by second generation LED LCUs for longer periods of time could somehow promote optimal polymerization. However, although some information
is available in the literature regarding the inluence
of varying radiant emittance and exposure periods on the monomer conversion of RCs containing alternative photoinitiators7,25, no information is available about
the effects of the increased exposure period of such products to curing light when using second generation LED LCUs.
This study aimed to evaluate the inluence of the
RE and LCU type on the degree of conversion (DC) and maximum rate of cure (Rpmax) of experimental
composite resin containing only Lucirin TPO. The following null hypotheses were evaluated. (1) Varying
RE values have no inluence on the DC and Rpmax
values regardless of the LCU and RC thickness; (2) No differences in DC and Rpmax are noted when the
Lucirin-based composite is exposed to second and third generation LEDs, or QTH LCUs regardless of the RE values delivered and thickness.
Material and methods
Specimen preparation
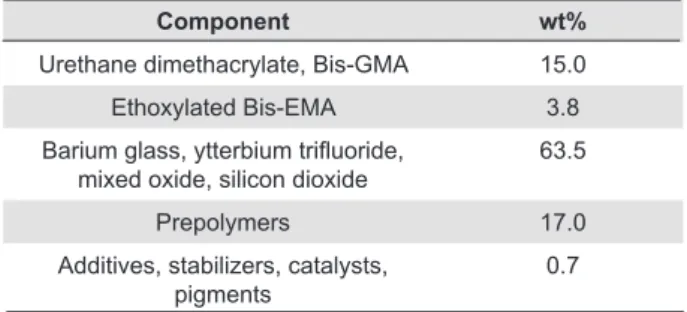
An experimental composite that contained only Lucirin TPO as a photoinitiator (Ivoclar Vivadent; Schaan, Liechtenstein) was evaluated. The RC composition is displayed in Table 1. Polyvinyl siloxane molds (Panasil, Kettenbach GmbH & Co.; Eschenburg, Germany) were made to create the square composite specimens (internal dimensions: 2 mm X 2 mm, 1 or
Component wt%
Urethane dimethacrylate, Bis-GMA 15.0
Ethoxylated Bis-EMA 3.8
Barium glass, ytterbium triluoride,
mixed oxide, silicon dioxide
63.5
Prepolymers 17.0
Additives, stabilizers, catalysts, pigments
0.7
Table 1- Composition of experimental resin composite (provided by the manufacturer)
Abbreviations:
2 mm thick; external dimensions: 2 cm X 2 cm). The mold was positioned on the diamond surface
of an attenuated total relectance unit (ATR, Standard
Golden Gate, Specac; Woodstock, GA, USA) coupled to an infrared spectroscopy unit (Tensor 27, Bruker Optik GmbH; Ettlingen, Germany). The composite was applied to the mold so that the resin bottom was in contact with the diamond surface of the ATR table. Care was taken to avoid that any pressure applied during RC’s placement into the mold deformed the mold and compromised the accuracy of the specimens’ dimensions, so the resin layer was inserted into the mold with a light pressure. The specimens were exposed to light emitted by a QTH LCU with a radiant emittance of 450 mW/cm2 (Optilux 501, SDS Kerr;
Danbury, CA, USA); a second generation LED LCU (Radii Plus, SDI; Bayswater, Victoria, Australia) with a radiant emittance of 1400 mW/cm2; or a polywave
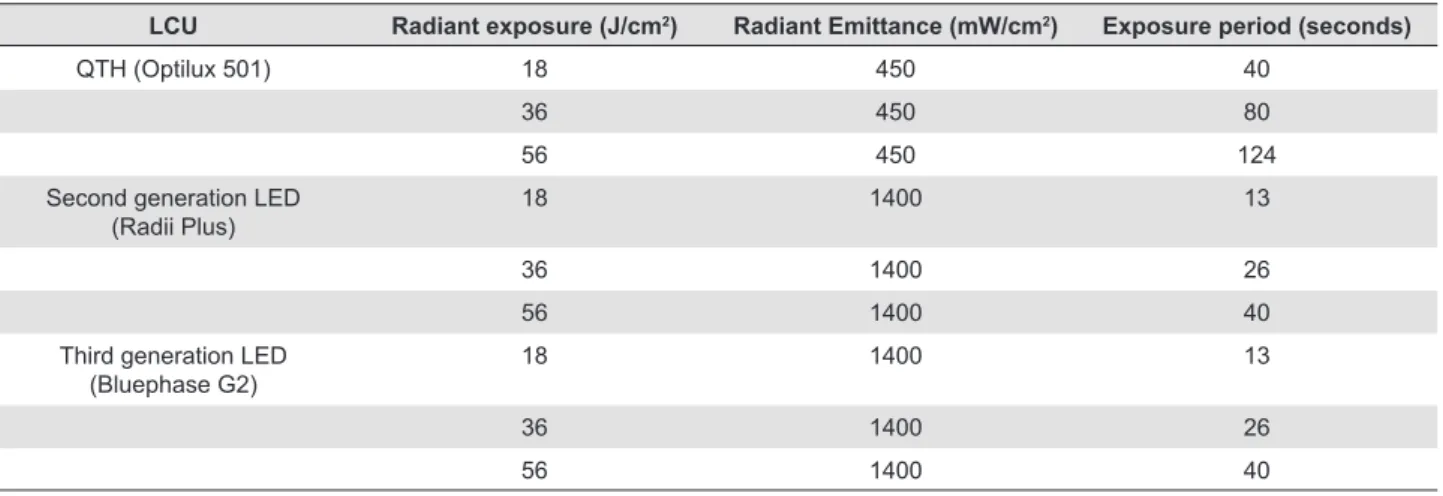
LED LCU (Bluephase G2, Ivoclar Vivadent; Schaan, Liechtenstein) with a radiant emittance of 1400 mW/cm2. Varying exposure periods (Table 2) were
selected to provide the following total RE values: 18 J/cm2, 36 J/cm2, and 56 J/cm2. The radiant emittance
values were measured using a radiometer (Cure Rite, Dentsply Caulk; Milford, DE, USA) in order to simulate clinicians’ routines. All procedures were performed at room temperature (approximately 25°C).
Degree of conversion
Real-time FTIR spectra between 1500 and 1680 cm-1 were obtained at a rate of 1 spectrum/second
(16 scans per spectrum) with a resolution of 4 cm-1 immediately before, during and 10 min after
exposure to curing light. Data were counted from the moment the infrared scan demonstrated that the resin was stabilized on the ATR surface. Based on previous studies, seven repetitions were used for each experimental group (n=7)1-3. Monomer conversion
was calculated using standard methods that evaluated changes in the ratios of aliphatic-to-aromatic C=C infrared absorption peaks (1636 cm-1/1608 cm-1) in
the uncured and cured states21,22 according to the
following equation:
Rpmax values corresponded to the highest rate
of polymerization (percentage) and were calculated based on the differences between DC values measured
in sequential, 1 second intervals throughout the 10 min analysis of each specimen.
The DC (%) and Rpmax (%/s) data were subjected
to a 3-way ANOVA followed by Tukey’s post-hoc test
(α=5%). All statistical tests and post-hoc power analyses were performed using a personal statistical pack (Statistics 19, SPSS Inc., IBM Company; Armonk, NY, USA).
Results
The DC and RPmax results are displayed in Tables
3 and 4, respectively. The observed power of the statistical tests was over 95%. According to the 3-way ANOVA analysis and Tukey’s post-hoc test, a
signiicant interaction between the “LCU,” “radiant
exposure,”, and “specimen thickness” factors was observed (p<0.0001).
When light from Optilux 501 or Bluephase G2 reached the 1 mm thick resin layer at varying RE
values, no signiicant differences in DC and RPmax
values were noted among the 18, 36, and 56 J/cm2
groups. Similar results were found for the 36 J/cm2
and 56 J/cm2 groups when 2 mm thick resin layers
were exposed to light emitted from these two LCUs. However, when Bluephase G2 delivered 18 J/cm2, the
DC values were lower than those obtained when higher RE values were delivered (p<0.001).
Regardless of resin thickness, exposure to Radii Plus light resulted in DC and Rpmax values close to zero
when 18 J/cm2 and 36 J/cm2 were delivered to the
RC. When 56 J/cm2 (40 seconds) was delivered to a
1 mm thick resin layer, the DC and Rpmax values were
higher than those that obtained after 18 or 36 J/cm2,
which were delivered to the resin layer (p<0.001). However, the delivery of 56 J/cm2 (40 seconds)
resulted in signiicantly lower DC values than those
observed when Optilux 501 and Bluephase G2 were used (p<0.001).
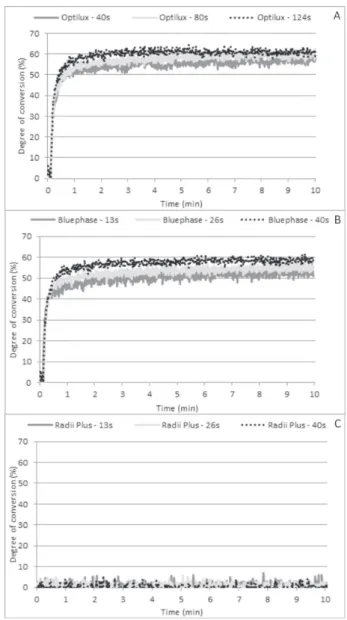
Figures 1 and 2 show the time-based conversion
proile when different RE values were delivered to 1
mm and 2 mm thick RC layers, respectively, using the tested LCUs. Optilux 501 and Bluephase G2 promoted
similar time-based conversion proiles when the curing
light was applied to a 1 mm thick resin layer (Figures 1A and 1B). There was no polymerization when Radii Plus delivered the lowest RE values (Figure 1C). Little monomer conversion was observed when the LCU delivered the highest RE values (Figure 1C).
The time-based conversion proiles of the 2 mm
thick RC layers were similar for all delivered RE values when Optilux 501 was used (Figure 2A). On
the other hand, a reduction in the polymerization rate until the monomer conversion reached a plateau was observed at lower DC values when Bluephase
LCU Radiant exposure (J/cm2) Radiant Emittance (mW/cm2) Exposure period (seconds)
QTH (Optilux 501) 18 450 40
36 450 80
56 450 124
Second generation LED (Radii Plus)
18 1400 13
36 1400 26
56 1400 40
Third generation LED (Bluephase G2)
18 1400 13
36 1400 26
56 1400 40
Table 2- LCUs, radiant exposure values, radiant emittance, and exposure period evaluated in the study
Radiant emittance values obtained with a radiometer (Cure Rite, DentsplyCaulk, Milford, DE, USA)
Composite layer thickness: 1mm
18 J/cm2 36 J/cm2 56 J/cm2
Optilux 501 61.7 (1.2) Aa 61.0 (1.6) Aa 61.2 (3.8) Aa
Bluephase G2 59.3 (2.4) Aa 60.3 (1.9) Aa 60.0 (2.6) Aa
Radii Plus 0.6 (0.5) Bb 1.1 (0.9) Bb 23.2 (3.2) Ba
Composite layer thickness: 2 mm
18 J/cm2 36 J/cm2 56 J/cm2
Optilux 501 58.9 (2.9) Aa* 61.3 (1.8) Aa 59.8 (2.5) Aa
Bluephase G2 51.0 (2.5) Bb* 56.7 (3.2) Ba* 58.8 (3.6) Aa
Radii Plus 1.1 (0.9) Ca 2.5 (3.7) Ca 1.4 (1.6) Ba*
Means followed by different letters (lower case - within row; upper case - within column) are signiicantly different for each composite layer
thickness. Differences in DC values between RC thickness is followed by asterisk (p=0.05)
Table 3- DC means (%) (standard deviation) of Lucirin-based RCs exposed to light from different curing units and delivered radiant exposure values
Composite layer thickness: 1 mm
18 J/cm2 36 J/cm2 56 J/cm2
Optilux 501 14.3 (2.0) Aa 12.2 (3.4) Aa 11.4 (2.8) Ba
Bluephase G2 14.9 (2.4) Aa 12.0 (1.5) Aa 13.2 (2.0) Aa
Radii Plus 0.1 (0.1) Ba 0.1 (0.1) Ba 4.1 (2.1) Cb
Composite layer thickness: 2 mm
18 J/cm2 36 J/cm2 56 J/cm2
Optilux 501 9.4 (1.9) Aa* 9.2 (0.9) Aa* 8.4 (1.6) Ba*
Bluephase G2 9.4 (1.4) Aa* 9.7 (1.3) Aa* 11.0 (2.1) Aa*
Radii Plus 0.1 (0.1) Ba 0.1 (0.1) Ba 0.1 (0.1) Ca*
Means followed by different letters (lower case - within row; upper case - within column) are signiicantly different for each composite layer
thickness. Differences in DC values between RC thickness is followed by asterisk (p=0.05)
G2 delivered lower RE values in comparison to the
conversion proile observed when higher RE values
were delivered (Figure 2B). As a consequence, lower 10 min DC values were noted. No polymerization was observed when Radii Plus was used regardless of the RE value (Figure 2C).
Discussion
In the present study, the increase in the delivered RE values did not result in higher DC or Rpmax under
most of the evaluated conditions. The only exception occurred when Bluephase G2 delivered 18 J/cm2 to a 2
mm thick layer, which exhibited signiicantly lower DC values than those of the other groups. Thus, the irst
hypothesis was rejected. The amount of RE delivered
to the bottom of the RC layer may be inluenced by
factors such as photoinitiator reactivity, light scattering
within the composite layer and a lack of uniformity in the light beam emitted by the LCU. In this regard, it should be noted that 17% of the light emitted by the polywave Bluephase G2 is close to the 405 nm27, which
is required to activate Lucirin TPO. On the other hand, approximately 25% of the light emitted by Optilux 501 is in this wavelength19,27. Furthermore, since the light
emitted by the polywave LED LCU evaluated in this study has non-uniform irradiance distribution13, it is
possible that the light with a wavelength matching the Lucirin absorption wavelength had a lower intensity in the tip center due to the location of the LED chip that emits violet light13. As a consequence, the lower
RE resulted in a lower DC when the polywave LED
LCU was used. Such an assumption can be conirmed by using speciic devices to measure the light beam proile, such as found with laser-grade beam proilers
and laboratory-grade light meters, which are capable
Figure 1- Time-based conversion of 1 mm thick RC layers exposed to Optilux 501 (A), Bluephase G2 (B), and Radii Plus (C) at varying RE values
of precisely measuring spectral distribution and radiant emittance values of light emitted by such LCUs, respectively. Thus, further studies are required
to conirm this guesstimate.
In this study, the QTH and polywave LED LCUs promoted higher DC values than the second generation LED LCU, which was unable to cure the RC regardless of the RE values delivered to the RC layer. This result corroborates the results of other studies10,18,24 and can
be justiied by the narrow wavelength (410 – 470 nm)
emitted by that LCU. In other words, the curing light within this narrow wavelength was not capable of properly activating alternative photoinitiators such as Lucirin TPO, even when high RE values were delivered. Thus, the second hypothesis was rejected.
Curiously, the highest RE values delivered by the second-generation LED LCU resulted in little monomer conversion (approximately 23%) in the 1 mm thick RC layer. In this regard, it should be noted that the wavelength emitted by the second-generation LED covers a narrow part of the Lucirin absorption wavelength. Given that this photoinitiator may be able to start the curing up to 20 times faster than CQ18, it
is possible that the use of high radiant emittance for a longer period of time may have led to the delivery of higher RE values within the narrow wavelength range capable of exciting Lucirin TPO. As a result, the RE amount delivered to the 1 mm thick resin layer was able to promote some monomer conversion (Table 1).
Based on this inding, one could state that higher RE
values delivered by the second generation LED LCU would promote an optimal polymerization. However, it should be emphasized that the RE values required to promote the high DC values found in the 1 mm thick RC layer would generate enough heat to cause irreversible pulp damage4,8,28.
In the present study, although shorter wavelengths (ultraviolet) were less capable of passing through the RC layer and promoting an optimal polymerization at the bottom of the resin10,15, the current indings
demonstrated that when lower RE values were delivered to 2 mm thick resin layers, the QHT LCU was able to promote DC values similar to those observed when higher energy doses were delivered. Indeed, the delivery of 18 J/cm2 and 36 J/cm2 by the
third-generation LED LCU resulted in DC values that were lower than those observed when 56 J/cm2 was
delivered and when the 1 mm thick resin layers were exposed to the light emitted by such an LCU. On the
other hand, in most groups, the use of a thicker resin layer resulted in Rpmax values that were lower than
those of the 1 mm thick resin layers. However, it should be emphasized that DC values were evaluated 10 min after exposure to light. Therefore, it is possible that the RC layers that showed lower Rpmax values would
exhibit faster post-polymerization after the light was shut off than the resin layers that showed higher Rpmax
values. As a consequence, despite the difference in Rpmax values, the faster post-polymerization after
polymer vitriication in resin layers with lower Rpmax
values would compensate for the apparently lower initial monomer conversion observed right after the light was shut off. This could be noted in the time-based conversion analysis, mainly when lower RE values were delivered to the RC layer (Figures 2A and 2B). As a result, further polymerization was expected after 10 min. Thus, the DC values obtained with the 2 mm thick resin layers after 13 s of exposure can
increase within the irst 24 hours20. As a result, the DC
values after longer evaluation periods could be close to, or even similar to, those observed when higher RE values were delivered. However, only further studies evaluating monomer conversion for longer periods of
time can conirm this speculation.
In the present study, a regular dental radiometer was used to measure the radiant emittance of the tested LCUs so that only the total radiant emittance values were determined. For this reason, the calculated
RE values were not based on speciic wavelengths but
on the sum of radiant emittance from all wavelengths, which is routinely used by clinicians. In addition, such hand held radiometers do not provide accurate radiant emittance values of the light emitted by LED LCUs in comparison to those provided by laboratory-grade meters16,17,26. Therefore, it is evident that this
radiometer may not be effective in determining the proper exposure period to ensure the optimal polymerization of the RC layer.
Based on the current findings, the evaluated polywave LCU can be as effective as the QTH LCU for providing optimal polymerization of Lucirin-based RC, but only when proper RE is delivered. In this regard, clinicians should be aware of the RC composition and
LCU light beam proile. With this information in hand,
emitted from second generation LED LCUs should be avoided as they do not compensate for the differences between the Lucirin TPO absorption wavelength peak and the LCU light wavelength.
Conclusion
Based on the current findings and within the limitations of the present study, it can be concluded that:
• The use of polywave LED LCUs can result in lower DC values when lower RE values are delivered to thicker RC layers that only contain Lucirin TPO.
• Both the polywave LED and QTH LCUs promoted higher DC and Rpmax values than did the second
generation LED LCU regardless of the delivered RE value.
• Although no difference in the Rpmax values were
found, thicker RC layers showed lower DC than thinner layers when the lowest RE value (18 J/cm2) was
delivered by the polywave LED LCU.
Acknowledgements
This study was supported by PIBIC/CNPq and the Sao Paulo Research Foundation (FAPESP) grant #2008/04970-6.
References
1- Aguiar TR, Oliveira M, Arrais CA, Ambrosano GM, Rueggeberg F, Giannini M. The effect of photopolymerization on the degree of conversion, polymerization kinetic, biaxial flexure strength, and modulus of self-adhesive resin cements. J Prosthet Dent. 2015;113(2):128-34.
2- Arrais CA, Chagas CL, Munhoz A, Oliveira M, Reis AF, Rodrigues JA. Effect of simulated tooth temperature on the degree of conversion of self-adhesive resin cements exposed to different curing conditions. Oper Dent. 2014;39(2):204-12.
3- Arrais CA, Giannini M, Rueggeberg FA. Effect of sodium sulinate
salts on the polymerization characteristics of dual-cured resin cement systems exposed to attenuated light-activation. J Dent. 2009;37(3):219-27.
4- Blay J, Price RB. Cellular inhibition produced by dental curing lights is a heating artifact. J Biomed Mater Res B Appl Biomater. 2010;93(2):367-74.
5- Brandt WC, Schneider LF, Frollini E, Correr-Sobrinho L, Sinhoreti MA. Effect of different photo-initiators and light curing units on degree of conversion of composites. Braz Oral Res. 2010;24(3):263-70. 6- Carey CM. Tooth whitening: what we now know. J Evid Based Dent Pract. 2014;14 Suppl:70-6.
7- Hadis M, Leprince JG, Shortall AC, Devaux J, Leloup G, Palin WM. High irradiance curing and anomalies of exposure reciprocity law in resin-based materials. J Dent. 2011;39(8):549-57.
8- Hannig M, Bott B. In-vitro pulp chamber temperature rise during composite resin polymerization with various light-curing sources. Dent Mater. 1999;15(4):275-81.
9- Ilie N, Hickel R. Can CQ be completely replaced by alternative initiators in dental adhesives? Dent Mater J. 2008;27(2):221-8. 10- Leprince JG, Hadis M, Shortall AC, Ferracane JL, Devaux J, Leloup G, et al. Photoinitiator type and applicability of exposure reciprocity law in
illed and unilled photoactive resins. Dent Mater. 2011;27(2):157-64.
11- Michaud PL, Price RB, Labrie D, Rueggeberg FA, Sullivan B. Localised irradiance distribution found in dental light curing units. J Dent. 2014;42(2):129-39.
12- Neumann MG, Miranda WG, Jr, Schmitt CC, Rueggeberg FA,
Correa IC. Molar extinction coeficients and the photon absorption eficiency of dental photoinitiators and light curing units. J Dent.
2005;33(6):525-32.
13- Price RB, Fahey J, Felix CM. Knoop hardness of ive composites
cured with single-peak and polywave LED curing lights. Quintessence Int. 2010;41(10):e181-91.
14- Price RB, Felix CA, Andreou P. Evaluation of a dual peak third generation LED curing light. Compend Contin Educ Dent. 2005;26(5):331-2.
15- Price RB, Felix CA, Andreou P. Third-generation vs a second-generation LED curing light: effect on Knoop microhardness. Compend Contin Educ Dent. 2006;27(9):490-6.
16- Price RB, Ferracane JL, Shortall AC. Light-curing units: a review of what we need to know. J Dent Res. 2015;94(9):1179-86.
17- Price RB, Labrie D, Kazmi S, Fahey J, Felix CM. Intra- and inter-brand accuracy of four dental radiometers. Clin Oral Investig. 2012;16(3):707-17.
18- Randolph LD, Palin WM, Bebelman S, Devaux J, Gallez B, Leloup G, et al. Ultra-fast light-curing resin composite with increased conversion and reduced monomer elution. Dent Mater. 2014;30(5):594-604. 19- Rueggeberg FA. State-of-the-art: dental photocuring - a review. Dent Mater. 2011;27(1):39-52.
20- Rueggeberg FA, Caughman WF. The inluence of light exposure on
polymerization of dual-cure resin cements. Oper Dent. 1993;18(2):48-55.
21- Rueggeberg FA, Craig RG. Correlation of parameters used to estimate monomer conversion in a light-cured composite. J Dent Res. 1988;67(6):932-7.
22- Rueggeberg FA, Hashinger DT, Fairhurst CW. Calibration of FTIR conversion analysis of contemporary dental resin composites. Dent Mater. 1990;6(4):241-9.
23- Rueggeberg FA, Swift EJ Jr. Exposure times for contemporary composites. J Esthet Restor Dent. 2013;25(2):82-4.
24- Santini A, Miletic V, Swift MD, Bradley M. Degree of conversion and microhardness of TPO-containing resin-based composites cured by polywave and monowave LED units. J Dent. 2012;40(7):577-84. 25- Selig D, Haenel T, Hausnerová B, Moeginger B, Labrie D, Sullivan B, et al. Examining exposure reciprocity in a resin based composite using high irradiance levels and real-time degree of conversion values. Dent Mater. 2015;31(5):583-93.
26- Shortall AC, Felix CJ, Watts DC. Robust spectrometer-based methods for characterizing radiant exitance of dental LED light curing units. Dent Mater. 2015;31(4):339-50.
27- Sim JS, Seol HJ, Park JK, Garcia-Godoy F, Kim HI, Kwon YH. Interaction of LED light with coinitiator-containing composite resins: effect of dual peaks. J Dent. 2012;40(10):836-42.
28- Souza PP, Hebling J, Scalon MG, Aranha AM, Costa CA. Effects of intrapulpal temperature change induced by visible light units on the metabolism of odontoblast-like cells. Am J Dent. 2009;22(3):151-6. 29- Stansbury JW. Curing dental resins and composites by photopolymerization. J Esthet Dent. 2000;12(6):300-8.