=~~~~~~~~~~~~~~~
I
1
j
1
A 1 JO113 PR E NM
JU1
Ubr t*dud¿CLMENTATi'~ & htALih INF,
aASHIN:'Td4 DC USA
mlortality in Children 1-4
In adopting the regional strategies for health for all and the Plan of Action for their implementation, the Member Governments of PAHO, in order to reduce health disparities both among and within each of the countries of the Region, defined six minimum regional goals.' One of these relates specifically to mortality in children in the 1-4 year age group, stipulating that in no country of the Region will the mortality rate for children 1-4 years of age exceed 2.4 per 1,000.
Mortality in children 1-4 years of age is being increas-ingly accepted as an indicator of a nation's standard of living, its degree of socioeconomic development, the influence of certain cultural and environmental factors on health, and the availability, quality, and efficiency of its health services structure. Knowledge of the mor-tality in this age group and of its causes contributes to
' See PAHO Official Documents 173 (1980) and 179 (1982).
the definition of policies and priorities and the formu-lation of health programs.
The mortality data presented here are derived mainly from the periodic reports the countries send in to PAHO on the basis of their official records. Problems in the coverage and quality of the records may limit analy-sis of the data and the possibility of comparison between countries. However, even in countries with underreporting, a study of the proportion of reported deaths affords a good estimate of the trend of the real behavior of mortality, which in normal situations without epidemic outbreaks or disasters tends to be regular and systematic. The underreporting of death rates in the 1-4 age group is much less than that of infant mortality rates because the latter are more influ-enced by the quality of the denominator, i.e., the number of live births. The denominator for the 1-4 group is less variable and can be obtained from census data or from simple and fairly reliable intercensal esti-mates. Consequently, ratio variations between the
IN THIS ISSUE...
* Mortality in Children 1-4 Years of Age in the Americas * Diseases Subject to the International Health
Regulations
* Acquired Immune Deficiency Syndrome (AIDS)
* The Cuban Aedes aegypti Campaign: a Year Later
* Special Program on Research and Training in
Tropical Diseases (TDR)
* Influenza in Latin America and the Caribbean, 1981-1982
* The Caribbean Epidemiology Center (CAREC) * Reports on Meetings and Seminars
infant mortality rate and the mortality rate for children aged 1-4 in Latin America are due mainly to a low recording of live births and an underreporting of infant mortality.
Between 1970 and 1978 the mortality among children 1-4 years of age continued the sustained downward trend observed over the previous decade in the countries of the Region. Table 1 shows the number of deaths and the rate per 1,000 population in this age group for the countries recording them in 1970 and 1978 (or the year closest to 1978). 1978 was selected because the mortality data available for more recent years pertain to a smaller number of countries. The total population of children
Table 1. Number of deaths in children 1-4, and rates per 1,000 population, selected countries, 1970 and around 1978.
1970 1978
Number of Rate per Number of Rate per Country deaths 1,000 deaths 1,000
Antigua 13 1.6 7 0.8
Argentina 6,212 3.3 4,618 2.2
Bahamas 40 1.8 2 2a 0.8
Barbados 47 2.2 26 1.3
Belize 74 4.3 35a 1.6
Canada 1,263 0.8 886 0.6
Chile 3.684 4.1 1,554 1.5
Colombia 19,570 6.8 13,8 6 6b 4.5
Costa Rica 1,155 4.6 2 3 3a 1.1
Cuba 1,163 1.2 847 0.9
Dominica 50 4.9 7 0.6
Dominican
Republic 3.262 5.9 2,118 3.0
Ecuador 12.989 14.9 9,097 8.1
El Salvador 5,925 11.1 2,473 4.1
Grenada 58 4.4 39 2.5
Guatemala 17,116 24.0 11,933 13.1
Honduras 3,861 9.9 2,656 4.8
Panama 1,400 7.4 483 2.1
Paraguayc 1,196 6.7 1,110 5.0
Peru 22,781 12.5 10,915 5.2
Saint Lucia 61 4.0 25 1.4
St. Vincent 72 5.3 58 3.9
Suriname 206 4.3 66 1.4
Trinidad 197 1.8 13 3b 1.3
United States
of America 11,548 0.8 8,429 0.7
Uruguay 287 1.3 229 1.1
Venezuela 7,528 5.2 4,021 2.4
Total 121,758 75,886
al9 79.
b1977.
Clnformation area.
aged 1-4 in the 28 countries selected was 32,375,200 in 1978. The total number of deaths in this group recorded in the countries fell by 37.6 per cent between 1970 and 1978. There was a reduction in the rates for all the countries, the most marked drops being those of Costa Rica (from 4.6 to 1.1 per 1,000) and Dominica (from 4,9 to 0,6). The smallest reductions were observed in Can-ada (from 0.8 to 0.6) and the United States (from 0.8 to 0.7), which were also the countries with the lowest rates in both years. This is in line with the fact that the drop in mortality rates tends to be slowest where the rates are lowest.
The drop in mortality in most of the countries came mainly from reductions in deaths from respiratory and diarrheal diseases. There was no substantial change over the period in the proportion of deaths from con-genital anomalies (an important cause of death in the first year of life) or from malignant neoplasms.
Of the countries with more than 200 deaths registered in 1978 in the 1-4 age group, the five with the highest and the five with the lowest mortality rates in this group were selected. Table 2 presents the mortality among children aged 1-4 as the percentage of the total annual deaths in both sets of countries. These percentages are extremely high in the countries with the highest rates-as high rates-as 18.64 per cent in Guatemala. In three of the five countries with the lowest rates, however, the pro-portion stays under 1 per cent. These figures convey the potentially enormous effect a reduction in these early deaths can have on the structure of mortality, and how greatly the life expectancy of the population at large could therefore be improved.
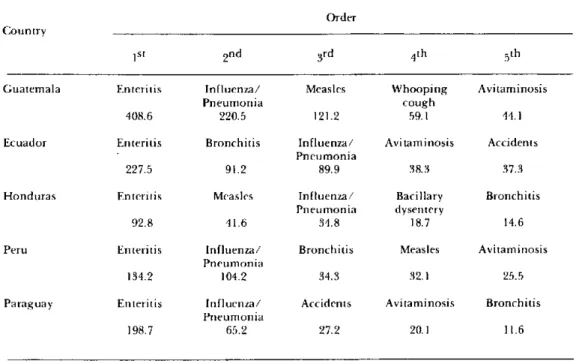
Tables 3 and 4 show the five leading causes of death and the corresponding mortality rates in each of the five countries in the two groups. In the group with the highest rates (Table 3), communicable diseases clearly predominate and enteritis is uniformly first in all the countries. In the group with the lowest rates (Table 4),
Table 2. Deaths in the 1-4 year age group as percentages of
general mortality.
Countries with highest Countries with lowest mortality rates in children mortality rates in children
aged 1-4 aged 1-4
Country Percentage of Country Percentage of total deaths total deaths
Guatemala 18.64 United States
of America 0.43
Ecuador 16.07 Canada 0.52
Honduras 14.64 Uruguay 0.81
Peru 13.34 Cuba 1.54
Paraguay 8.52 Costa Rica 2.70
2
e
on the other hand, the leading causes are non-communicable-such as neoplasms, congenital
anom-alies, and accidents. In all five countries in this group,
accidents are the chief cause of mortality, with similar
rates which range between 21.2 and 29.2 per 100,000. The mortality rates from communicable diseases such as pneumonia and enteritis are quite different in the two groups, being significantly higher in the countries
Table 3. Five leading causes of death with rates per 100,000 in children 1-4 years, in countries with highest rates in this age group, 1978.
Order Country
ISt 2nd 3rd 4ih 5th
Guatemala Enteritis Influenza/ Measles Whooping Avitaminosis
Pneumonia cough
408.6 220.5 121.2 59.1 44.1
Ecuador Enteritis Bronchitis Influenza/ Avitaminosis Accidents Pneumonia
227.5 91.2 89.9 38.3 37.3
Honduras Enteritis Measles Influenza/ Bacillary Bronchitis Pneumonia dysentery
92.8 41.6 34.8 18.7 14.6
Peru Enteritis Influenza/ Bronchitis Measles Avitaminosis Pneumonia
134.2 104.2 34.3 32.1 25.5
Paraguay Enteritis Influenza/ Accidents Avitaminosis Bronchitis Pneumonia
198.7 65.2 27.2 20.1 11.6
. Table 4. Five leading causes of death with rates per 100,000 in children 1-4 years, in countries with lowest rates in this age group, 1978.
Order
Country
ISt 2nd 3rd 4th 5th
United Siates Accidents Congenital Malignant Influenza/ Homicide of America anornalies neoplasms Pneumonia
29.2 8.3 4.8 2.9 2.5
Canada Accidents Congenital Malignant Influenza/ Homicide anomalies neoplasms Pneumonia
27.7 13.2 5.9 2.7 1.6
Uruguay Accidents Congenital Malignant Influenza/ Enteritis anomalies neoplasms Pneumonia
23.5 14.9 9.1 9.1 7.2
Cuba Accidents Influenza/ Congenital Malignant Enteritis Pneumonia anomalies neoplasms
22.3 14.9 8.3 6.6 4.2
Costa Rica Accidents Enteritis Influenza/ Congenital Malignant Pneumonia anomalies neoplasms
21.2 18.8 12.0 8.7 5.3
with the highestoverallrates. In the case of enteritis, for instance, the rates in the first group range between 92.8 and 408.6 deaths per 100,000, but are below 19 in the second. There is little difference between the mortality rates from accidents in the two groups, though the proportions of the different kinds of accidents can vary from country to country. In the other 18 countries intermediate situations are observed, not only with respect to the varying combinations of communicable and noncommunicable causes among their five leading causes of deaths, but also in that the rates are between those of the two extreme groups.
The greatest advance that could be achieved in the coming decade, especially in the countries with the highest rates, would be a continuation of the reduction in mortality from respiratory infections and diarrheal diseases and, on a lesser scale, from accidents. It can be predicted that the downward trend of the first two causes will continue over the years ahead with imme-diate repercussions on the structure of mortality in the 1-4 age group.
Since the rates presented are national averages, they reveal nothing of the possible geographic and social variations within each country; moreover, the death certificates used do not provide socioeconomic infor-mation. Major limitations are also imposed by the diffi-culty of correlating mortality data with indicators of economic and social development and of the availabil-ity and accessibilavailabil-ity of health services. These deficien-cies point up the need for specific research to identify the population groups most at risk and the social, eco-nomic, and cultural variables-including access to health services-that bear on sickness and death in children 1-4 years of age. The findings of such studies could provide guidance for integrated prevention and control programs for the diseases that are the leading causes of mortality in this age group in the countries of the Region.
(Source: Epidemiology Unit, Health Programs Development, PAHO.)
.
Diseases Subject to the International
Health Regulations
Cholera, yellow fever, and plague cases and deaths reported in the Region of the Americas up to 30 April 1983.
Yellow
feverl-C:otlry and Cholera Plague adminisirative subdivision cases Cases Deaths cases BOLIVIA -0 I 0 20
Beni -
-Cochabamba - 7
7-La Paz - 2 2 20 PERI - 4 4
-Madre de Dios l-
-e
4